[Preprint]. 2024 Feb 12:2024.02.09.579714.
doi: 10.1101/2024.02.09.579714.

Myosin-I Synergizes with Arp2/3 Complex to Enhance Pushing Forces of Branched Actin Networks

Affiliations

Myosin-I Synergizes with Arp2/3 Complex to Enhance Pushing Forces of Branched Actin Networks

Mengqi Xu et al. bioRxiv. .

Update in

Abstract

Myosin-Is colocalize with Arp2/3 complex-nucleated actin networks at sites of membrane protrusion and invagination, but the mechanisms by which myosin-I motor activity coordinates with branched actin assembly to generate force are unknown. We mimicked the interplay of these proteins using the "comet tail" bead motility assay, where branched actin networks are nucleated by Arp2/3 complex on the surface of beads coated with myosin-I and the WCA domain of N-WASP. We observed that myosin-I increased bead movement efficiency by thinning actin networks without affecting growth rates. Remarkably, myosin-I triggered symmetry breaking and comet-tail formation in dense networks resistant to spontaneous fracturing. Even with arrested actin assembly, myosin-I alone could break the network. Computational modeling recapitulated these observations suggesting myosin-I acts as a repulsive force shaping the network's architecture and boosting its force-generating capacity. We propose that myosin-I leverages its power stroke to amplify the forces generated by Arp2/3 complex-nucleated actin networks.


Conflict of interest statement

Competing interests: The authors declare that they have no competing interests.

Figures
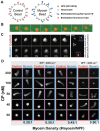
Figure 1.
Figure 1.. Alteration of comet tail morphology by myosin-I.
(A) Schematic of (left) control- and (right) myosin-beads coated with NPF and neutravidin, where neutravidin is further conjugated with (control-bead) biotinylated CF640 fluorescent dye or (myosin-bead) biotinylated Drosophila Myo1d. (B) Time-lapse sequence of a (red) myosin-bead walking on a (green) single-actin-filament track. Speed ~8 nm/s. Scale bar 2 μm. (C) Time series of the growth of actin comet tail from symmetry breaking to generation of a polarized comet tail from (top) control-bead and (bottom) myosin-bead. Scale bar 5 μm. (D) Phase map showing representative examples of 2 μm-diameter beads coated with a range of myosin-densities in the presence of 30 – 200 nM CP, 4 μM (5% Rhodamine labeled) actin, and 200 nM Arp2/3 complex. For each myosin density condition, the left column show control-beads that were acquired in the same imaging field as the myosin-beads in the right column. The myosin and NPF densities were determined by SDS-PAGE gel, where the NPF density is the same for group 0.28:1, 0.35:1 and 0.43:1, ~ 6000 um−2, and ~ 4000 um−2 for group 0.80:1. Images were acquired 20–35 min after mixing. Brightness and contrast were linearly set to be the same for each control- and myosin-bead pair but different among panels at different conditions for better visualization. Scale bar 5 μm.
Figure 2.
Figure 2.. Disruption and fracturing of actin shells by myosin-I.
(A) Time series of (top) control-beads and (bottom) 0.43:1 myosin-beads acquired in the same imaging field in the presence of 200 nM CP showing the inability of myosin-beads to form a comet tail. (B) Time series of (top) control-beads and (bottom) 0.43:1 myosin-beads acquired in the same field in the presence of 25 nM CP showing fracturing of the actin shell and comet tail growth from a myosin-bead but not the control-bead. Conditions: 4 μM actin (5% Rhodamine labeled), 200 nM Arp2/3 complex, 200 nM or 25 nM CP. Scale bar 5 μm.
Figure 3.
Figure 3.. Myosin-I decreases the actin density of comet tails.
(A) Time-series of (top) control- and (bottom) 0.43:1 myosin-beads growing comet tails in the presence of 50 nM CP. The actin network growing from the myosin-bead is less dense but has a similar tail length as the control. Conditions: 4 μM actin (5% Rhodamine labeled), 200 nM Arp2/3 complex and 50 nM CP. Scale bar 5 μm. (B) Comparison of the mean fluorescence intensities (Fluor. Int. / Area) of actin comet tails grown from control- and myosin-beads, captured 20 min after mixing. The solid lines connect experimental pairs (N=5, n = 11). (C) Actin comet tail length as a function of time and (D) tail growth rates derived from the slopes of the time courses in (C). (E) Comet tail fluorescence as a function of time. Control- and myosin-bead experimental pairs are normalized to the average fluorescence level of the control-beads from 1100 s –1300 s. (F) Rate of fluorescent actin incorporation into comet tails derived from the slopes of the time courses in (E). (C, E) Large points show the averaged value at binned time interval (every 100 sec). Traces are from individual beads with each myosin-bead acquired with a control-bead in the same field of view (N=5, n=11). Error bars are SD. (G) Growth efficiency for control and myosin-beads. Efficiency is defined as comet tail length per unit actin fluorescence intensity. Box plots (B,D, F, G) show median (center line), interquartile range (box) and min-max values (whiskers). p values were calculated using two-tail paired t test. Each point represents a control- and myosin-bead pair acquired in same field of view. See also Supplementary Fig.
Figure 4.
Figure 4.. Comets grown from myosin-beads incorporate less Arp2/3 complex.
(A) Representative actin comet tails assembled from (top) control- and (bottom) myosin-beads showing (magenta) actin and (green) SNAP-Arp2/3 complex. Images were acquired approximately 25 – 35 min after mixing. Brightness and contrast were set differently for actin and SNAP-Arp2/3 complex panels for visualization. Conditions: 4 μM actin (5% Rhodamine labeled), 200 nM Arp2/3 complex (80% SNAP-Surface 488 labeled), 40 nM CP. Scale bar is 5 μm. (B) Total actin fluorescence intensity, (C) total SNAP-Arp2/3 fluorescence intensity and (D) actin to SNAP-Arp2/3 fluorescence ratio over the entire comet tail region. (E) Total SNAP-Arp2/3 fluorescence intensity on bead surface. Plot shows median (center line), interquartile range (box) and min-max values (whiskers). p values were calculated using two-tail paired t test. Each point represents a pair of control- and myosin-beads (N=2, n=33)
Figure 5.
Figure 5.. The myosin power stroke is required for altering network architectures.
(A) Time-series of actin assembly around (top) control and (bottom) rigor myosin-beads at 50 nM CP. Rigor myosin heavily delayed the growth of actin comet tails. (B) Representative images of actin comet tails grown under different ATP concentrations (top: control beads; bottom: myosin-beads). Adding ATP back rescued comet tail growth. Images were acquired 20–30 min after mixing. (C) Representative actin network patterns assembled on control-, myosin-, rigor-myosin, and HaloABD-beads under three different CP concentrations, as indicated. Images were acquired 20 – 30 min after mixing. Brightness and contrast were set to the same values for each panel. (D) Representative actin comet tails generated by (top) control- and (bottom) myosin-beads in the absence and presence of 100 μM free Ca2+ at 50 nM CP. Images were acquired approximately 15–20 min after mixing. (E) Length and (F) network density quantified by total fluorescence intensity per area for control- and myosin-beads in the absence and presence of 100 μM free Ca2+ (N=1, n=15). Control- and myosin-bead experimental pairs are normalized to the average fluorescence level of the control-beads. Box plots (E, F) show median (center line), interquartile range (box) and min-max values (whiskers). p values were calculated using two-tail paired t test. Conditions: 4uM actin (5% Rhodamine labeled), 200 nM Arp2/3 complex, 15–200 nM CP, 0–1 mM ATP, as indicated. Scale bar 5 μm.
Figure 6.
Figure 6.. The myosin power stroke can fracture the actin shell.
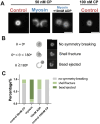
(A) Representative actin shells of control-, myosin-beads assembled under 50 nM CP, arrested by adding 20μM (5 molar excess) of Latrunculin B and CK-666 before symmetry breaking; as well as myosin-beads assemble under the same conditions but arrested with the addition of 10mM ADP to inhibit myosin power stroke. Myosin-beads fractured and ejected from the actin shell, while control- and myosin-beads (with 10mM ADP) remained enclosed in the shell. Control-bead assembled under 100 nM CP showing similar network density as the myosin-beads, didn’t show shell fracture or bead ejection. Image was captured approximately 40min after arrest. (B) The extents of shell breaking was classified by shell-breaking angle θ: θ = 0, no symmetry breaking; 0 < θ < 180, shell fracture; θ ≥180, bead ejected. Scale bar is 5μm. (C) Percentage of populations with different extents of shell breaking for control (50 nM CP) (n=182), myosin (n=158), myosin (with 10mM ADP) (n=89), control (100 nM CP) (n=65), N=2. Conditions: 4μM actin (5% Rhodamine labeled), 200 nM Arp2/3, 50 or 100 nM CP. 20μM (5 molar excess) phalloidin and 2 mM ATP were also added to prevent actin depolymerization and preserve myosin motor activity. Actin assembly was arrested 100s after mixing. Scale bar is 5 μm.
Figure 7.
Figure 7.. Filament level model of actin comet tail recapitulates experimental results.
(A) Schematic of model of actin polymerization around the nucleating bead. Model includes filament level nucleation, branching, filament fragmentation, debranching, capping, and force exerted by implicit myosin. (B) Timelapse of symmetry breaking event under intermediate capping condition (branch length = 0.5 μm) with no myosin. Color scale indicates filament tension (Red: tensile; Blue: compressive). (C) Tension distributions within actin comet tails formed at either control (0.0 pN) or two myosin forces (0.2 pN or 0.4 pN) under intermediate capping condition (branch length = 0.5 μm). Image shows a cut through the center of the comet tail. Color scale indicates filament tension (Red: tensile; Blue: compressive). (D) Simulated timelapse of epifluorescence images under different myosin forces (branch length = 0.5 μm). (E) Elongation speed (F) actin intensity and (G) Arp2/3 complex intensity for simulated beads as a function of myosin force (branch length = 0.5 μm). (H) Forces acting on beads along the direction of bead propulsion due to actin polymerization (green) and myosin pushing (orange) as a function of the myosin force (branch length = 0.5 μm). (I) Orientation of filaments around the beads (within 0.15 μm of the bead surface) as a function of myosin force (branch length = 0.5 μm). (J) Simulated symmetry breaking after actin polymerization and branching arrest. Actin was allowed to polymerize around the bead for 42.7 s (0.2 pN myosin force with 0.5 μm filament length) to form a shell of intermediate thickness before halted. The time of arresting was set as t = 0 s.
Figure 8.
Figure 8.
Schematic of how myosin-I modulates actin network structure through its power-strok

References

    1. Blanchoin L., Boujemaa-Paterski R., Sykes C., Plastino J., Actin dynamics, architecture, and mechanics in cell motility. Physiol Rev 94, 235–263 (2014). - PubMed
    1. Rottner K., Faix J., Bogdan S., Linder S., Kerkhoff E., Actin assembly mechanisms at a glance. Journal of Cell Science 130, 3427–3435 (2017). - PubMed
    1. Svitkina T., The Actin Cytoskeleton and Actin-Based Motility. Cold Spring Harb Perspect Biol 10, (2018). - PMC - PubMed
    1. Papalazarou V., Machesky L. M., The cell pushes back: The Arp2/3 complex is a key orchestrator of cellular responses to environmental forces. Curr Opin Cell Biol 68, 37–44 (2021). - PMC - PubMed
    1. Gautreau A. M., Fregoso F. E., Simanov G., Dominguez R., Nucleation, stabilization, and disassembly of branched actin networks. Trends Cell Biol 32, 421–432 (2022). - PMC - PubMed

Publication types