[Preprint]. 2024 Feb 18:2024.02.16.580560.
doi: 10.1101/2024.02.16.580560.

Mechanisms of Epigenomic and Functional Convergence Between Glucocorticoid- and IL4-Driven Macrophage Programming

Affiliations

Mechanisms of Epigenomic and Functional Convergence Between Glucocorticoid- and IL4-Driven Macrophage Programming

Dinesh K Deochand et al. bioRxiv. .

Update in

Abstract

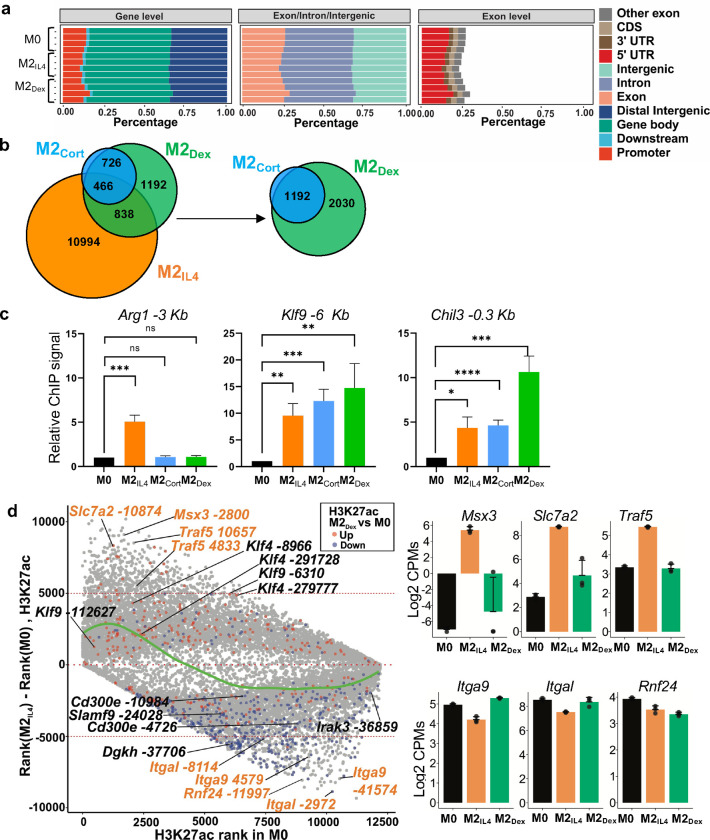
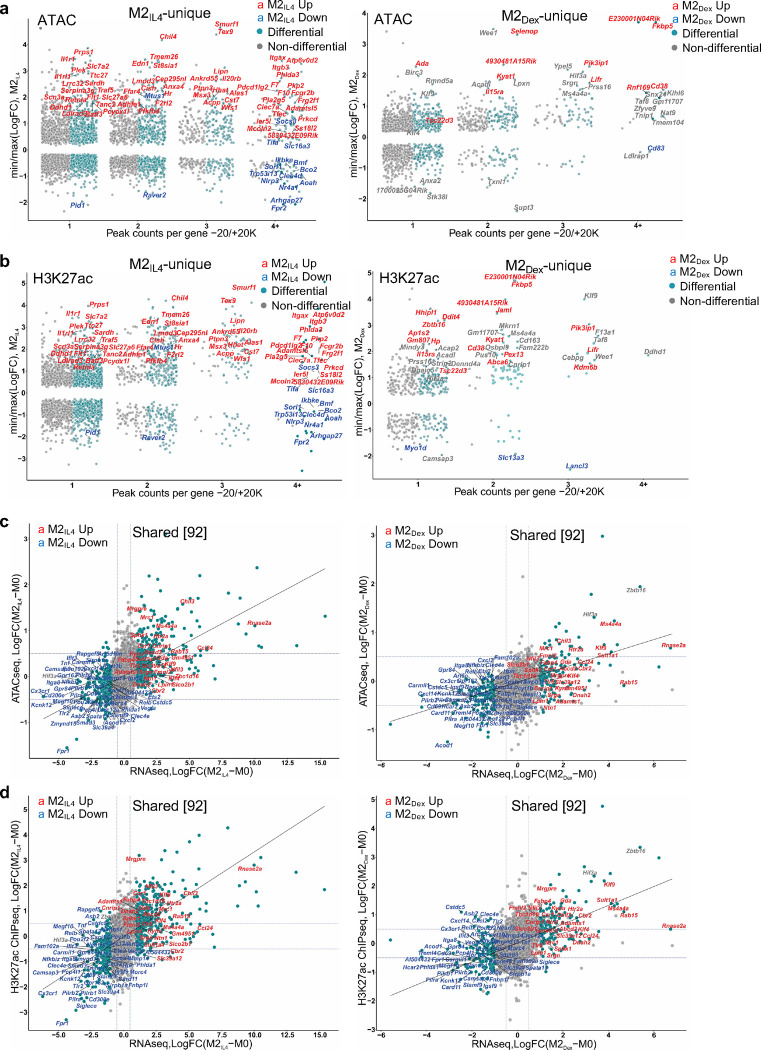
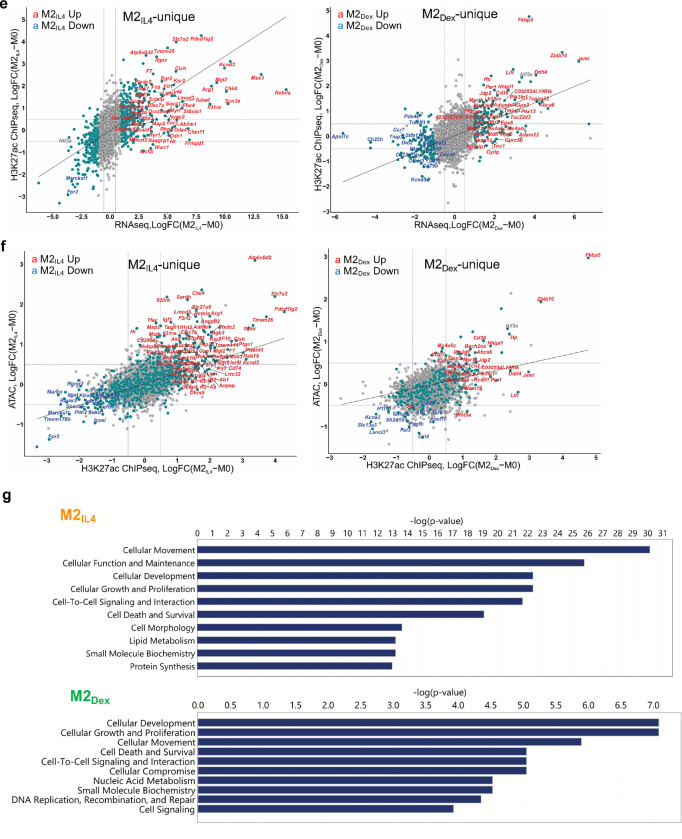
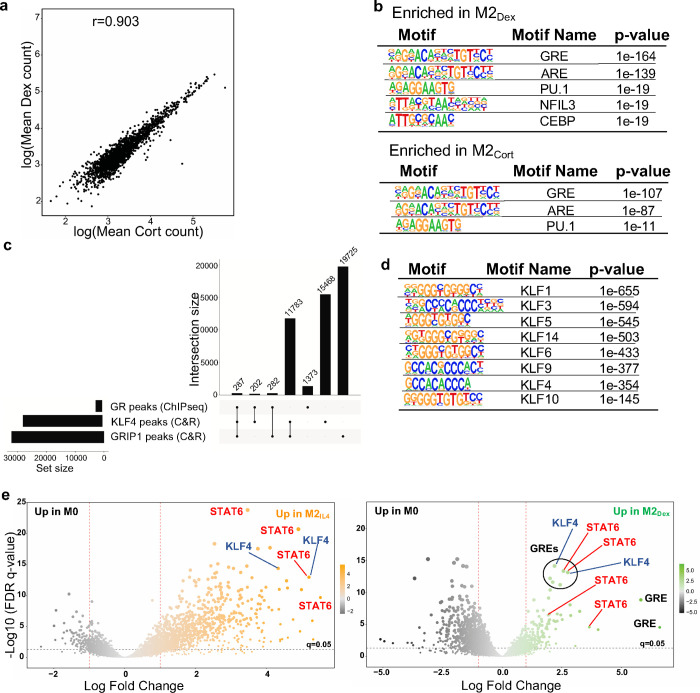
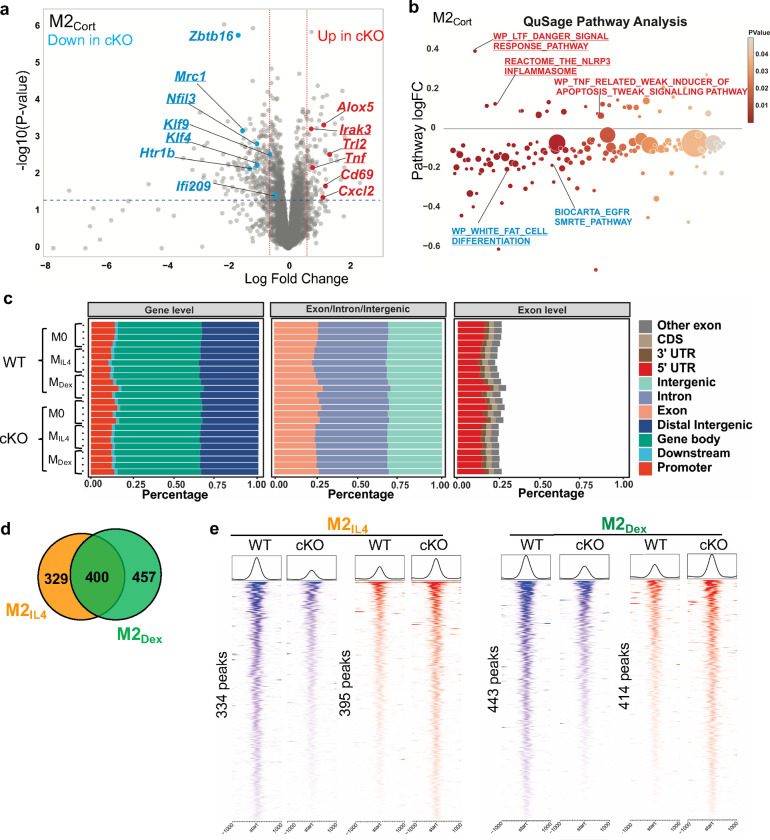
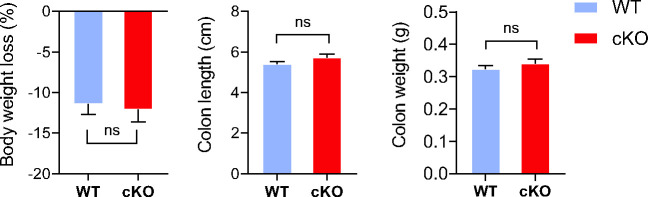
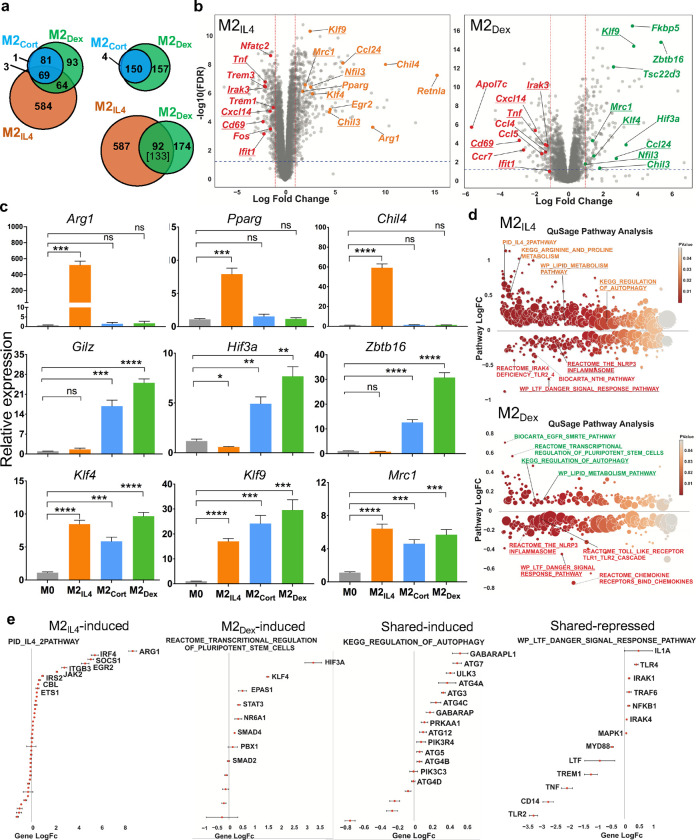
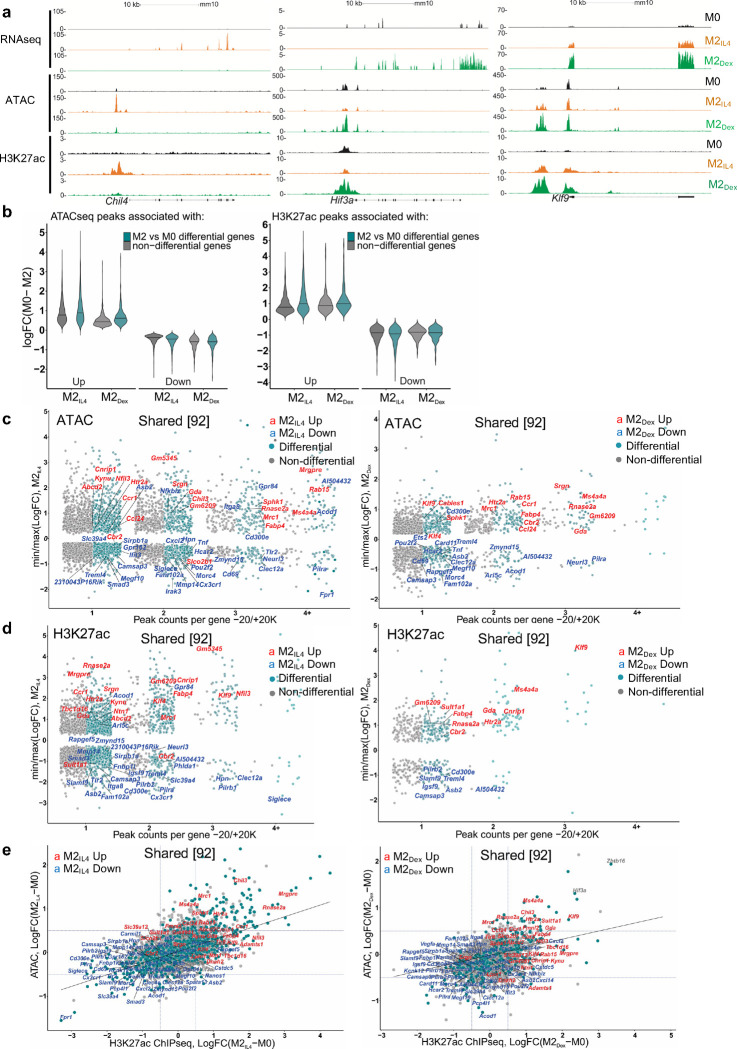
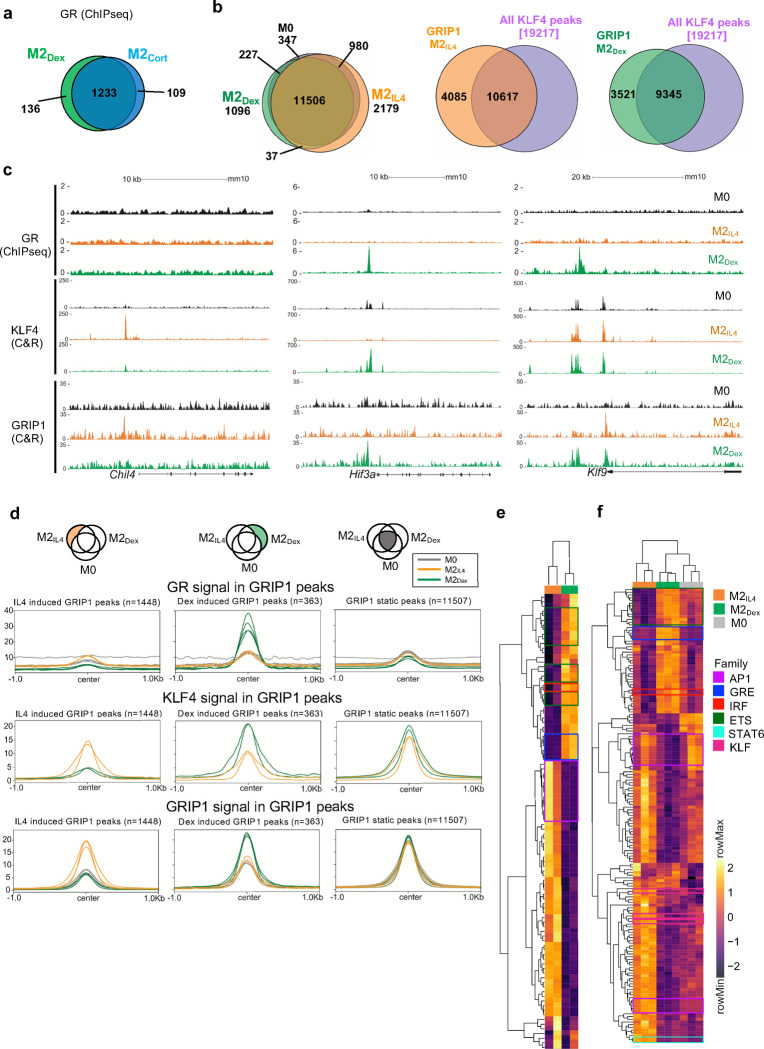
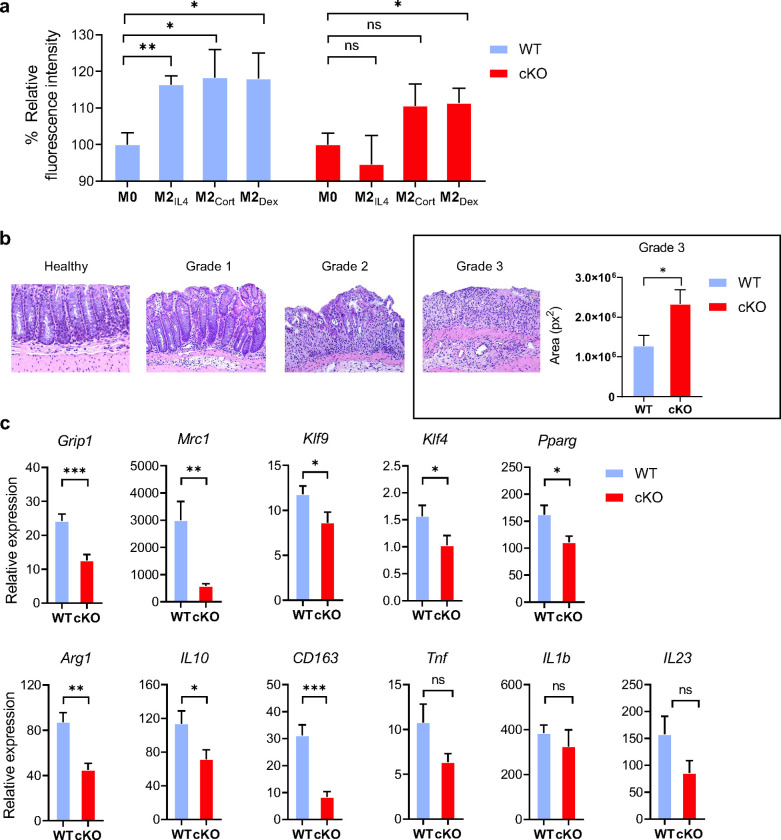
Macrophages adopt distinct phenotypes in response to environmental cues, with type-2 cytokine interleukin-4 promoting a tissue-repair homeostatic state (M2IL4). Glucocorticoids, widely used anti-inflammatory therapeutics, reportedly impart a similar phenotype (M2GC), but how such disparate pathways may functionally converge is unknown. We show using integrative functional genomics that M2IL4 and M2GC transcriptomes share a striking overlap mirrored by a shift in chromatin landscape in both common and signal-specific gene subsets. This core homeostatic program is enacted by transcriptional effectors KLF4 and the GC receptor, whose genome-wide occupancy and actions are integrated in a stimulus-specific manner by the nuclear receptor cofactor GRIP1. Indeed, many of the M2IL4:M2GC-shared transcriptomic changes were GRIP1-dependent. Consistently, GRIP1 loss attenuated phagocytic activity of both populations in vitro and macrophage tissue-repair properties in the murine colitis model in vivo. These findings provide a mechanistic framework for homeostatic macrophage programming by distinct signals, to better inform anti-inflammatory drug design.

Keywords: Homeostatic macrophage programming; chromatin and epigenomics; enhancer landscape; glucocorticoid receptor; kruppel-like factor 4; tissue repair and inflammation; transcriptional regulation.


Figures

Extended Data Fig. 1:
Extended Data Fig. 1:. Transcriptomic analysis of the M2IL4 and M2GC macrophage populations.
a Expression of selected genes upregulated in M2Cort and M2Dex (n=3). b Volcano plot shows DEGs in M2Cort relative to M0 (LogFC ≥ 1; FDR <0.05). Selected upregulated genes are highlighted blue, and downregulated in red. Some of the shared target genes between M2IL4, M2Dex, and M2Cort are underlined. c Venn diagrams show differentially regulated pathways determined by QuSAGE in M2IL4 and M2Dex relative to M0 (p <0.05). d Differential pathways in M2 determined by QuSAGE as in Fig. 1d. Underlined are some of the pathways shared between M2IL4, M2Dex and M2Cort (upregulated, blue; downregulated, red). e Genes from two pathways selectively repressed in M2IL4 and M2Dex are plotted as logFC±SD.
Extended Data Fig. 2:
Extended Data Fig. 2:. M2IL4 and M2GC macrophage populations share epigenetic landscape.
a The distribution of ATACseq peaks relative to known genomic features in M0, M2IL4 and M2Dex populations across replicates (n=3). b Venn diagram shows differential M2IL4, M2Cort and M2Dex H3K27ac peaks relative to M0. c H3K27ac assessed by ChIP-qPCR at enhancers of indicated genes in 2IL4, M2Cort and M2Dex normalizedto that in M0. Student’s t-test; *p < 0.05, **p < 0.01, ***p < 0.001, ****p < 0.0001, ns, non-significant. n=3, error bars are SEM. d Rank shift analysis of mean H3K27ac signals in M0 (baseline) and M2IL4. Peaks that are also differentially regulated in M2Dex are colored in red (hyperacetylated) and blue (hypoacetylated). The LOESS regression line (green) shows the relationships between acetylation strength in M0 and signal change in M2IL4. Enhancer sites associated with representative IL4-specific (orange) and shared (black) genes are marked, and the expression of representative genes as determined by RNAseq (Fig. 1) is plotted on the right.
Extended Data Fig. 3:
Extended Data Fig. 3:. Signal-specific and shared enhancers in M2IL4 and M2GC macrophages.
a-b Comparisons of TSS window-associated ATACseq (a) or H3K27ac ChIPseq (b) peaks in differential (teal) vs. non-differential (gray) genes in M2IL4 (left panels) and M2Dex (right panels) stratified by the number of gene-associated peaks. Only peaks with the largest positive (max) or negative (min) changes relative to M0 are shown. A subset of up- (red) and downregulated (blue) M2IL4-unique (left) and M2Dex-unique (right) DEGs identified by RNAseq (Fig. 1) are labeled. c-d Correlations between normalized RNAseq and ATACseq (c) or H3K27ac ChIPseq (d) signals in the TSS-proximal − 1K + 1K windows for differential (teal) and non-differential (gray) genes in M2IL4 (left) and M2Dex (right). A subset of 92 shared up- (red) and downregulated (blue) DEGs identified by RNAseq (Fig. 1) are labeled. e-f Correlations between normalized RNAseq and ATACseq (e) or ATACseq and H3K27ac ChIPseq (f) signals in the TSS-proximal −1K + 1K windows for differential (teal) and non-differential (gray) genes in M2IL4 (left) and M2Dex (right). A subset of the up- (red) and downregulated (blue) 587 M2IL4-unique DEGs (left) or 174 M2Dex-unique DEGs identified by RNAseq (Fig. 1) are labeled. g Differentially regulated pathways identified by Ingenuity Pathway Analysis (QIAGEN) of genes associated with change in both the ATACseq and H3K27ac ChIPseq signal in M2IL4 and M2Dex populations.
Extended Data Fig. 4:
Extended Data Fig. 4:. GR, KLF4 and GRIP1 genome-wide binding in differentially polarized macrophage populations.
a Read counts in peaks Spearman’s correlation between M2Dex and M2Cort GR ChIPseq. b Top enriched transcription factor binding motifs in GR ChIPseq peaks in M2Dex and M2Cort. Peaks were analyzed by HOMER2 findMotifsGenome.pl to identify significantly enriched motifs relative to genomic background. c UpSet plot shows GC-induced peaks from GR ChIPseq and the total peak atlases from KLF4 and GRIP1 CUT&RUN as analyzed by BedSect. Set-size: number of total regions (overlaps and unique). Intersection size: number of total regions with specified overlaps. d Enrichment p-values for KLF family motifs in KLF4 CUT&RUN-derived peaks. Peaks were analyzed by HOMER2 findMotifsGenome.pl to identify significantly enriched motifs relative to a set of background regions with similar GC content. e Volcano plots of GRIP1 CUT&RUN differential peaks in M2IL4 (left) and M2Dex (right) relative to M0. Size of the peak point on graph is commensurate with −log10(FDR), whereas color shade is proportional to the log2FC. Peaks were scanned for the presence of transcription factor binding motifs within the HOMER database using motifmatchr and select motifs (GRE, black; STAT6, red; KLF4, blue) are indicated.
Extended Data Fig. 5:
Extended Data Fig. 5:. GRIP1 is required for the M2IL4 and M2GC programming.
a Volcano plot shows DEGs in GRIP1 cKO vs. WT in M2Cort relative to M0 of each genotype. (FC ≥1.5; unadjusted p-value<0.05). A subset of DEGs expressed at higher levels in the cKO relative to WT are highlighted in red, whereas those downregulated - in blue. Examples of the shared M2IL4:M2GC GRIP1 target genes are underlined. b Differentially regulated pathways in M2Cort (unadjusted p < 0.01) identified by QuSAGE with MsigDB are shown for GRIP1 cKO vs. WT. Select up- (red) and downregulated (blue) pathways are labeled, and those shared between IL4 and GC are underlined. Circle size is proportional to the number of genes in the pathway and color signifies p-value. c The distribution of ATACseq peaks relative to known genomic features in M0, M2IL4 and M2Dex populations across replicates for WT (n=3) and GRIP1 cKO (n=4). d Venn diagram of GRIP1-dependent differential ATACseq peaks in M2IL4 and M2Dex (n=4, FC ≥ 2; FDR <0.05). e Heatmaps of the GRIP1-dependent ATACseq peaks in M2IL4 and M2Dex (FC ≥ 2; FDR <0.05) are separated into those dependent on GRIP1 for opening (blue) or closing (red).
Extended Data Fig. 6:
Extended Data Fig. 6:. GRIP1 contributes to phagocytic activity of M2IL4 and M2GC in vitro and healing properties in vivo.
Body weight, colon length and weight changes of WT and cKO mice 2 wks after initiating DSS-induced colitis.
Fig.1 |
Fig.1 |. Transcriptomic analysis of the M2IL4 and M2GC populations.
a, Transcriptomic changes in M0 macrophages polarized with IL4 or GCs corticosterone (Cort) or dexamethasone (Dex) for 24 h were determined by RNAseq (n=3). Venn diagrams show DEGs in M2IL4 and M2GC relative to M0 (FC ≥ 2; FDR <0.05); 92 of 133 genes are regulated in both M2IL4 and M2Dex in the same direction. b, Volcano plots show DEGs in M2IL4 (left) and M2Dex (right) relative to M0 (LogFC ≥ 1; FDR< 0.05). Selected upregulated genes are highlighted in orange (M2IL4) and green (M2Dex). Downregulated genes are highlighted in red in both populations. Examples of the M2IL4:M2Dex shared DEGs are underlined. c, RT-qPCR validation of genes upregulated selectively in M2IL4 (top), M2GC (middle), or both (bottom). Student’s t-test; *p < 0.05, **p < 0.01, ***p < 0.001, ****p < 0.0001, ns, non-significant. n=4, error bars are SEM. d, Differentially regulated pathways (unadjusted p < 0.01) identified using QuSAGE and MsigDB canonical pathways (c2.cp.v7.3, Broad Institute) are shown for M2IL4 (top) and M2Dex (bottom). Underlined are the shared pathways between M2IL4 (upregulated, orange; downregulated, red) or M2Dex (upregulated, green; downregulated, red). Circle size is proportional to the number of genes in the pathway and color signifies p-value. e, Genes from indicated pathways induced or repressed in M2IL4, M2Dex, or both are plotted LogFC±SD and ordered by p-value.
Fig.2 |
Fig.2 |. M2IL4 and M2GC macrophage populations share epigenetic landscape.
a, ATACseq was performed on M0, M2IL4 and M2Dex. Venn diagram shows the number of differential ATACseq peaks in M2IL4 and M2Dex relative to M0 (n=4, FC ≥ 2; FDR <0.05). 4,913 of 8,213 peaks were differential in both populations and regulated in the same direction. b, Heatmaps of the induced (red) and suppressed (blue) signal-specific and shared M2IL4 and M2Dex ATACseq peaks (FC ≥ 2; FDR <0.05). c-d, Enriched transcription factor binding motifs with associated p-values were identified by HOMER known motif analysis with JASPAR 2022 motif database in signal-specific and shared up- (c) and downregulated (d) ATACseq peaks in M2IL4 and M2Dex. e, Polarization-induced increases in the 5’ Tn5 cut site counts within indicated binding motifs of interest in the M2IL4 and M2Dex populations. f, Venn diagram shows the differential M2IL4 and M2Dex H3K27ac ChIPseq peaks relative to those in M0 (FDR< 0.05) with 1,304 of 1,667 peaks regulated in the same direction in both populations. g, Heatmaps of induced (red) and suppressed (blue) signal-specific and shared filtered H3K27ac peaks (FC ≥ 2; FDR <0.05) in M2IL4 and M2Dex. h, Volcano plots show differential H3K27ac ChIPseq peaks for M2IL4 (left) and M2Dex (right) relative to those in M0 (LogFC ≥ 1; FDR< 0.05); the location of selected hyperacetylated sites relative to the TSS of the closest gene are shown in orange (M2IL4) or green (M2Dex). Hypoacetylated sites are shown in red for each population. Sites overlapping in M2IL4 and M2Dex are underlined. i, Non-promoter 12,211 H3K27ac peaks after excluding 1,650 promoter-proximal peaks (−300/+200 relative to TSS) are shown as a Venn diagram with the number of differential, relative to M0, M2 population-specific and shared peaks (FC ≥ 2; FDR<0.05) indicated. j, Average H3K27ac ChIPseq signals at M2IL4 (top), M2Dex (middle), and shared (bottom) differential non-promoter peaks from (I) represented as violin plots.
Fig.3 |
Fig.3 |. M2Dex and M2IL4 have both distinct and shared de novo enhancers as demonstrated by H3K27ac ChIPseq.
a, Correlation between RNAseq, ATACseq and H3K27ac ChIPseq signals in selected M2IL4-specific, M2Dex-specific and shared genes. b, Genome-wide changes in up- or downregulated differential ATACseq (left) and H3K27ac ChIPseq (right) peaks located within −20K +20K window centered on the TSS in M2IL4 and M2Dex, as indicated. c-d, Comparison of TSS window-associated ATACseq (c) or H3K27ac ChIPseq (d) peaks in differential (teal) vs. non-differential (gray) genes in M2IL4 (left panels) and M2Dex (right panels), as indicated, stratified by the number of gene-associated peaks. Only peaks with the largest positive (max) or negative (min) changes relative to M0 are shown. A subset of 92 shared up- (red) and downregulated (blue) DEGs identified by RNAseq (Fig. 1) are labeled in each of the 4 panels. e, Correlation between normalized H3K27ac ChIPseq and ATACseq signals in the TSS-proximal −1K +1K windows for differential (teal) and non-differential (gray) genes. A subset of 92 shared upregulated (red) and downregulated (blue) DEGs identified by RNAseq (Fig. 1) are labeled.
Fig.4 |
Fig.4 |. GR, KLF4 and GRIP1 genome-wide binding in differentially polarized macrophage populations.
a, Venn diagram shows the numbers and overlap of GR ChIPseq peaks in M2Dex and M2Cort macrophages relative to M0 baseline (n=4; FC ≥ 2, FDR <0.05). b, Venn diagram shows the numbers and overlap of (left) GRIP1 CUT&RUN peaks in M0, M2IL4 and M2Dex populations (n=3; FC ≥ 1.5, FDR <0.05) or (middle and right) GRIP1 in M2IL4 and all KLF4 peaks (n=2) or GRIP1 in M2Dex and all KLF4 peaks, as indicated. c, GR (ChIPseq), KLF4 (CUT&RUN) and GRIP1 (CUT&RUN) read density distribution over Chil4, Hif3a and Klf9 loci in M0, M2IL4 and M2Dex. d, Average profiles of GR, KLF4 and GRIP1 signal from each macrophage population centered on GRIP1 CUT&RUN M2IL4- (left), M2Dex- (middle) specific or invariant ‘static’ (right) peaks (n=3; FC ≥ 2, FDR <0.05). e-f, Transcription factor binding motif enrichment Z-scores in KLF4 (e) and GRIP1 (f) peak subsets in each macrophage population (M2IL4=orange, M2Dex=green, M0=grey, as indicated) were determined in chromVAR from the HOMER list of motifs. Motifs with high variability among the samples (padj <= 1*10−6) were plotted and indicated motif families are highlighted in boxes.
Fig.5 |
Fig.5 |. GRIP1 is required for the establishment of M2IL4 and M2GC transcriptomes.
a-b, Expression of (a) GRIP1 or (b) IL4- (top) GC- (middle) or shared (bottom) M2 target genes in WT and GRIP1 cKO M0, M2IL4, M2Cort, and M2Dex populations as assessed by RT-qPCR. Average relative expression of each transcript in WT M0 is arbitrarily set to 1. n=4; Student’s t-test; *p < 0.05, **p < 0.01, ***p < 0.001, ****p < 0.0001, ns, non-significant. Error bars are SEM. c, Stacked bar plot shows the number of DEGs in GRIP1 cKO vs. WT as a fraction of WT M2IL4, M2Dex, or shared DEGs relative to M0 (RNAseq, WT: n=3, cKO: n=4). d, Volcano plot shows DEGs in GRIP1 cKO vs. WT in M2IL4 (left) and M2Dex (right) relative to M0 of each genotype. (FC≥1.5, unadjusted p-value<0.05). Selected inflammation-related genes expressed at higher levels in the cKO M2IL4 and M2Dex relative to WT are highlighted in red. Key M2 target genes downregulated in the cKO are highlighted in both M2IL4 (orange) and M2Dex (green). Examples of the shared M2IL4:M2Dex GRIP1 target genes are underlined. e, Differentially regulated pathways (unadjusted p < 0.01) identified using QuSAGE with MsigDB canonical pathways subset (Broad Institute) are shown for GRIP1 cKO vs. WT in M2IL4 (left) and M2Dex (right). Select pathways are labeled (upregulated, red; downregulated, orange for IL4 and green for Dex); M2IL4:M2Dex-shared pathways are underlined. Circle size is proportional to the number of genes in the pathway and color signifies p-value.
Fig.6 |
Fig.6 |. Macrophage GRIP1 contributes to phagocytic activity of M2IL4 and M2GC in vitro and tissue healing in vivo.
a, Relative fluorescence intensity of WT (set to 100%) and GRIP1-cKO M2IL4, M2Cort and M2Dex relative to that in M0 after exposure to pHrodo Green S. aureus BioParticles (see Methods). Shown are mean values and error bars are SEM (n=3, student t-test). b, Histopathological changes assessed by H&E staining of colons from WT and cKO mice 2 wks after initiating DSS-induced colitis. Grade 1, 2 and 3 are defined in Methods. Plotted is the total area representing grade 3 for colon specimens of WT and GRIP1-cKO (n=4, student t-test). c, The expression of indicated genes was measured by RT-qPCR of total RNA from colons of WT and cKO mice. The expression of each gene was normalized to β-actin, and then fold difference to baseline, non-treated (calibrant) value calculated for WT or cKO. Shown are mean values and error bars are SEM (WT: n=10–15, cKO: n=6–8; student t-test).

Similar articles

References

    1. Germic N., Frangez Z., Yousefi S. & Simon H.-U. Regulation of the innate immune system by autophagy: monocytes, macrophages, dendritic cells and antigen presentation. Cell Death & Differentiation 26, 715–727 (2019). - PMC - PubMed
    1. Davies L.C., Jenkins S.J., Allen J.E. & Taylor P.R. Tissue-resident macrophages. Nature immunology 14, 986–995 (2013). - PMC - PubMed
    1. Perdiguero E.G. & Geissmann F. The development and maintenance of resident macrophages. Nature immunology 17, 2–8 (2016). - PMC - PubMed
    1. Locati M., Curtale G. & Mantovani A. Diversity, mechanisms and significance of macrophage plasticity. Annual review of pathology 15, 123 (2020). - PMC - PubMed
    1. Wynn T.A. & Vannella K.M. Macrophages in tissue repair, regeneration, and fibrosis. Immunity 44, 450–462 (2016). - PMC - PubMed

Publication types