[Preprint]. 2024 Feb 13:2024.02.11.24301704.
doi: 10.1101/2024.02.11.24301704.

Host-Microbe Multiomic Profiling Reveals Age-Dependent COVID-19 Immunopathology

Affiliations

Host-Microbe Multiomic Profiling Reveals Age-Dependent COVID-19 Immunopathology

Hoang Van Phan et al. medRxiv. .

Update in

  • Host-microbe multiomic profiling reveals age-dependent immune dysregulation associated with COVID-19 immunopathology.
    Phan HV, Tsitsiklis A, Maguire CP, Haddad EK, Becker PM, Kim-Schulze S, Lee B, Chen J, Hoch A, Pickering H, van Zalm P, Altman MC, Augustine AD, Calfee CS, Bosinger S, Cairns CB, Eckalbar W, Guan L, Jayavelu ND, Kleinstein SH, Krammer F, Maecker HT, Ozonoff A, Peters B, Rouphael N; IMPACC Network; Montgomery RR, Reed E, Schaenman J, Steen H, Levy O, Diray-Arce J, Langelier CR. Phan HV, et al. Sci Transl Med. 2024 Apr 17;16(743):eadj5154. doi: 10.1126/scitranslmed.adj5154. Epub 2024 Apr 17. Sci Transl Med. 2024. PMID: 38630846 Free PMC article.

Abstract

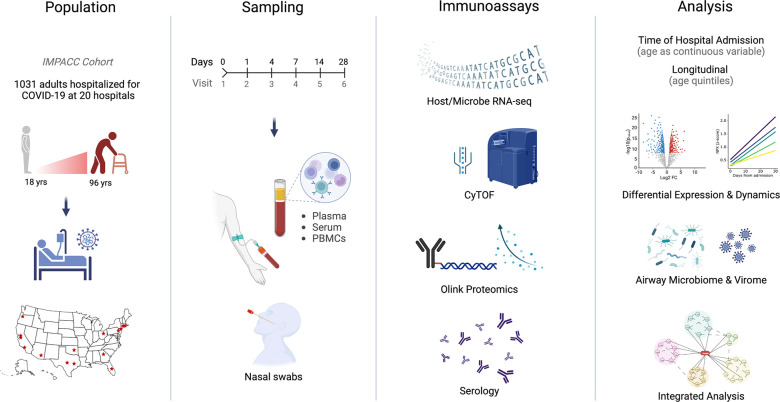
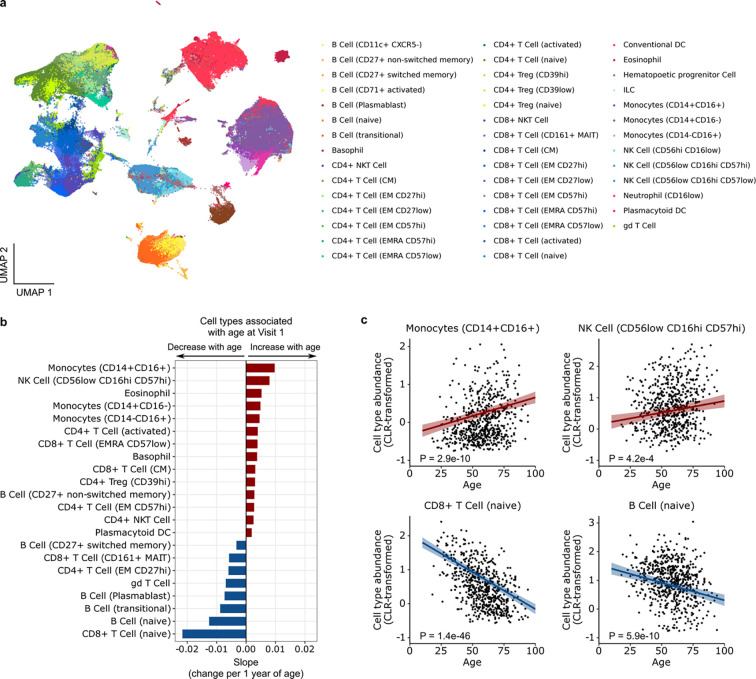
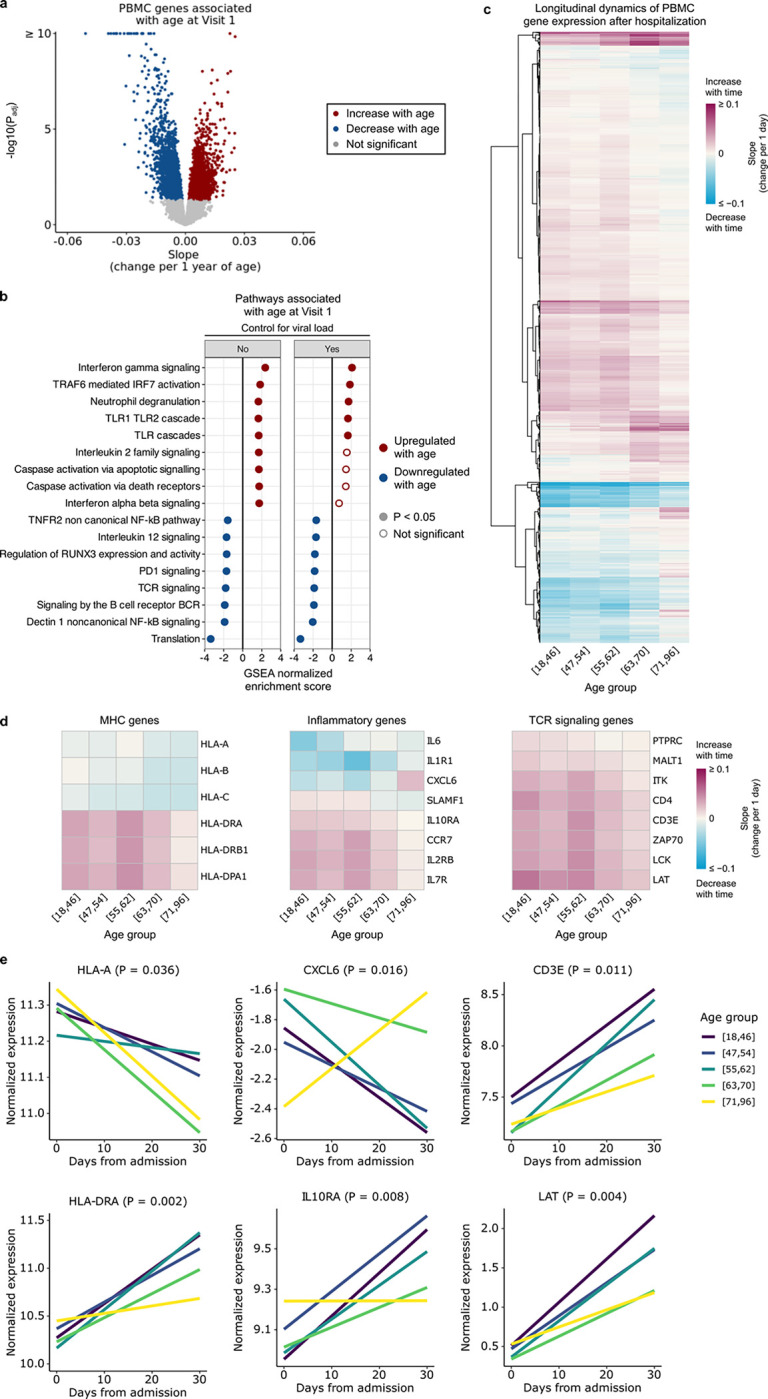
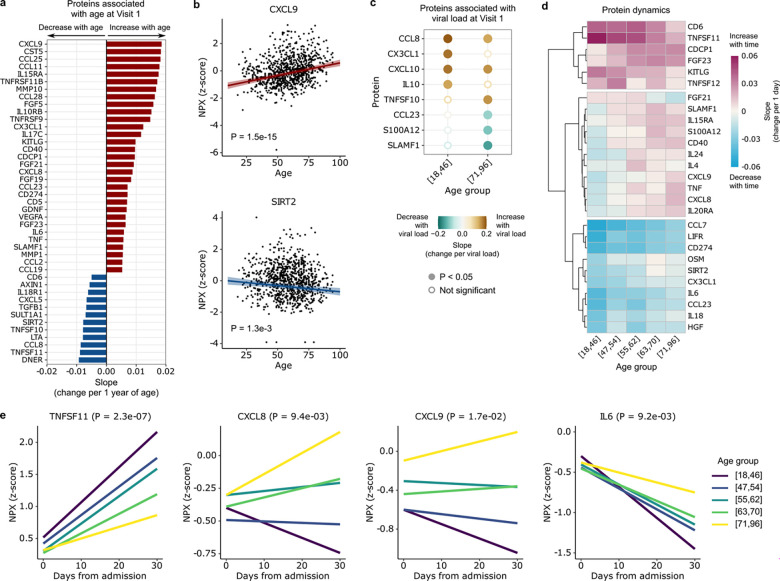
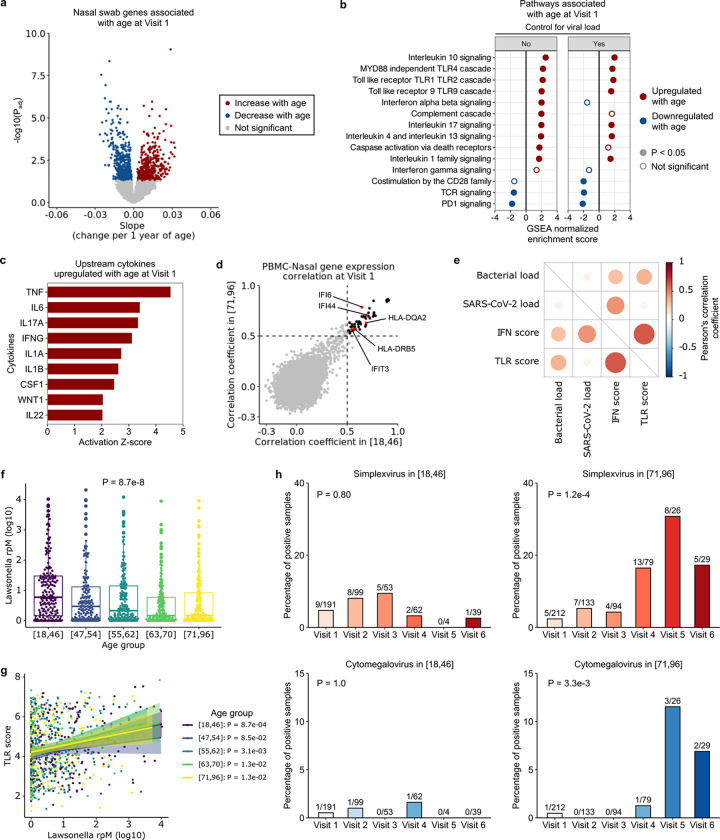
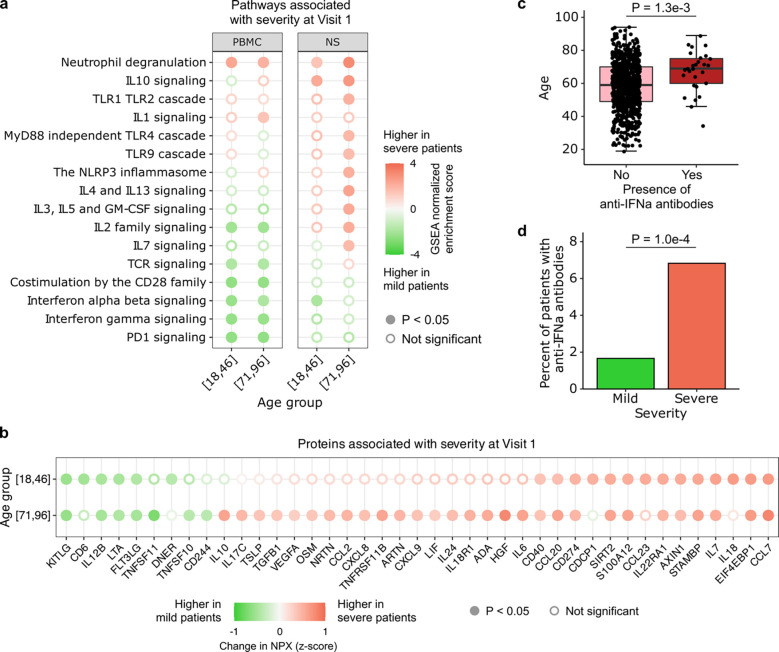
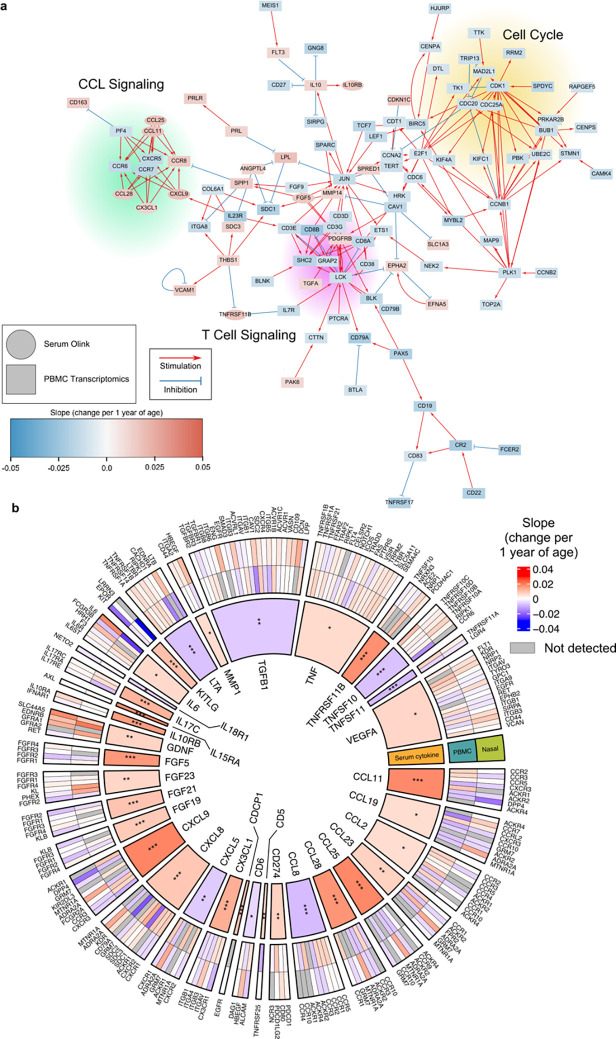
Age is a major risk factor for severe coronavirus disease-2019 (COVID-19), yet the mechanisms responsible for this relationship have remained incompletely understood. To address this, we evaluated the impact of aging on host and viral dynamics in a prospective, multicenter cohort of 1,031 patients hospitalized for COVID-19, ranging from 18 to 96 years of age. We performed blood transcriptomics and nasal metatranscriptomics, and measured peripheral blood immune cell populations, inflammatory protein expression, anti-SARS-CoV-2 antibodies, and anti-interferon (IFN) autoantibodies. We found that older age correlated with an increased SARS-CoV-2 viral load at the time of admission, and with delayed viral clearance over 28 days. This contributed to an age-dependent increase in type I IFN gene expression in both the respiratory tract and blood. We also observed age-dependent transcriptional increases in peripheral blood IFN-γ, neutrophil degranulation, and Toll like receptor (TLR) signaling pathways, and decreases in T cell receptor (TCR) and B cell receptor signaling pathways. Over time, older adults exhibited a remarkably sustained induction of proinflammatory genes (e.g., CXCL6) and serum chemokines (e.g., CXCL9) compared to younger individuals, highlighting a striking age-dependent impairment in inflammation resolution. Augmented inflammatory signaling also involved the upper airway, where aging was associated with upregulation of TLR, IL17, type I IFN and IL1 pathways, and downregulation TCR and PD-1 signaling pathways. Metatranscriptomics revealed that the oldest adults exhibited disproportionate reactivation of herpes simplex virus and cytomegalovirus in the upper airway following hospitalization. Mass cytometry demonstrated that aging correlated with reduced naïve T and B cell populations, and increased monocytes and exhausted natural killer cells. Transcriptional and protein biomarkers of disease severity markedly differed with age, with the oldest adults exhibiting greater expression of TLR and inflammasome signaling genes, as well as proinflammatory proteins (e.g., IL6, CXCL8), in severe COVID-19 compared to mild/moderate disease. Anti-IFN autoantibody prevalence correlated with both age and disease severity. Taken together, this work profiles both host and microbe in the blood and airway to provide fresh insights into aging-related immune changes in a large cohort of vaccine-naïve COVID-19 patients. We observed age-dependent immune dysregulation at the transcriptional, protein and cellular levels, manifesting in an imbalance of inflammatory responses over the course of hospitalization, and suggesting potential new therapeutic targets.


Figures

Fig. 1:
Fig. 1:. Graphical study overview.
This study evaluated 1,031 COVID-19 patients between the ages of 18 and 96 enrolled in the IMPACC cohort at 20 hospitals across the United States. Blood (PBMCs, plasma and serum) and nasal swab samples were collected at up to 6 visits over 28 days and processed for RNA sequencing, proteomics, mass cytometry, and serology.
Fig. 2:
Fig. 2:. Older adults have more severe COVID-19 and higher SARS-CoV-2 viral loads.
(a) Age distribution of the participant cohort. (b, c) Box plot showing the relationship between patients’ age and (b) trajectory group severity or (c) mortality. (d) Nasal swab SARS-CoV-2 viral load at Visit 1 (reads per million (rpM) measured by metatranscriptomics) in each age group. In (b-d), P-values were calculated using Kruskal-Wallis test. (e) Nasal swab SARS-CoV-2 viral load over time in each age group. P-value was calculated with generalized additive mixed effects modeling.
Fig. 3:
Fig. 3:. Aging alters immune cell populations during COVID-19.
(a) Uniform Manifold Approximation and Projection (UMAP) plot highlighting blood cell types analyzed by CyTOF. (b) Bar plot depicting blood cell types that are upregulated (red) or downregulated (blue) with age at Visit 1. “gd T cell” stands for γd T cell. (c) Scatter plots depict centered log ratio (CLR) transformed proportions of CD14+CD16+ monocytes and naïve CD8 T cells as a function of age. P values were calculated using linear modeling with Benjamini-Hochberg correction.
Fig. 4:
Fig. 4:. Aging leads to changes in PBMC gene expression during COVID-19.
(a) Volcano plot highlighting genes associated with age at Visit 1 in PBMC RNA-seq data. (b) Plot demonstrating the normalized enrichment score of select Reactome pathways associated with age at Visit 1, with and without controlling for viral load, in PBMC samples. (Full results are tabulated in Supp. Data 1 and 2.) P values in (a, b) were calculated with limma’s linear model and Benjamini-Hochberg correction. (c) Heatmap representing the temporal slopes (i.e., change in gene expression per 1 day) of 2,812 genes that differ longitudinally between the 5 age groups (adjusted P < 0.05). (d) Heatmaps representing the temporal slopes of select MHC, inflammatory, and TCR signaling genes from (c). (e) Plots demonstrating the temporal dynamics of 6 example genes from (g). P values were calculated using linear mixed effects modeling and Benjamini-Hochberg correction. (Full temporal dynamics plots with confidence intervals are provided in Supp. Fig. 6.)
Fig. 5:
Fig. 5:. Aging leads to differences in cytokine and chemokine levels during COVID-19.
(a) Bar plot highlighting proteins that are upregulated (red) or downregulated (blue) with age at Visit 1 (adjusted P < 0.05). (b) Scatter plots of the normalized protein expression (NPX) of representative proteins, CXCL9 and SIRT2, as a function of age. P values are calculated using linear regression and Benjamini-Hochberg correction. (c) Dot plot representing the slope of cytokine expression versus viral load in the youngest and oldest age quintiles, [18,46] and [71,96], respectively. (d) Heatmap depicting temporal slopes (i.e., change in protein expression per 1 day) of all cytokines that display age-dependent longitudinal dynamics (adjusted P < 0.05). (e) Plots showing the temporal dynamics of 4 example cytokines from (d). P values in (d, e) are calculated using linear mixed effects modeling and Benjamini-Hochberg correction.
Fig. 6:
Fig. 6:. Aging changes upper respiratory tract gene expression and the airway microbiome in COVID-19.
(a) Volcano plot depicting genes associated with age at Visit 1 in nasal swab metatranscriptomics data. (b) Normalized enrichment scores of select Reactome pathways associated with age at Visit 1, with (right) and without (left) controlling for viral load, in nasal samples. (c) Bar plot depicting cytokines predicted by Ingenuity Pathway Analysis to be upregulated with age in nasal samples. (d) Scatter plot depicting the Pearson’s correlation coefficient of gene expression between PBMC and nasal samples. Each dot indicates the correlation coefficient between PBMC expression and nasal expression of a gene, in the youngest (x-axis) and oldest (y-axis) age group. The black dots mark the genes with correlation coefficients > 0.5 in both age groups (n = 52 genes). (e) Dot plot highlighting correlations between SARS-CoV-2 viral load (log-transformed reads per million (rpM)), total bacterial abundance (log-transformed rpM), interferon stimulated gene (ISG) expression score and Toll like receptor (TLR) gene expression score. (f) Relative abundance of Lawsonella (rpM) across the age quintiles. In (f, g), P values were calculated with one-way ANOVA test. (g) Correlation between Lawsonella relative abundance and TLR gene expression across the age quintiles. P values were calculated using the test of association with Pearson’s correlation coefficient and adjusted with Benjamini-Hochberg correction. (h) Percentages of cases with herpes simplex virus (HSV) or cytomegalovirus (CMV) transcript detection in the youngest versus oldest age quintiles. The number on top of each bar indicates the number of positive cases over the number of total samples. P-values were calculated by Fisher exact test.
Fig. 7:
Fig. 7:. Aging and COVID-19 severity.
(a, b) Dot plots highlighting a) select Reactome pathways in PBMC or nasal RNA-seq data, and b) serum proteins (Olink) that were upregulated in severe participants (baseline respiratory severity ordinal scale 5–6) compared to mild/moderate (ordinal scale 3–4) participants at Visit 1, stratified by age group (youngest or oldest). P values in (a, b) were calculated with linear modeling and Benjamini-Hochberg correction. (c) Box plot demonstrating association between age and presence of anti-IFN-α autoAbs in the 835 participants with available autoAb data at Visit 1. P value was calculated with the Wilcoxon rank-sum test. (d) Bar plot demonstrating the percentage of severe and mild/moderate participants who had anti-IFN-α antibodies (9/542 participants, 1.66% in mild/moderate; 20/293 participants, 6.83% in severe). P-value was calculated using the Chi-squared test.
Fig. 8:
Fig. 8:. Integrated network analysis of serum cytokine/chemokine and PBMC and nasal transcriptomic data.
(a) Network analysis of serum cytokines and PBMC genes significantly associated with age at Visit 1 using protein-protein interactions reported in Omnipath. (b) Analysis of ligand-receptor interactions from cytokine data, PBMC and nasal RNA-seq data. The inner most ring shows the significant cytokines from Visit 1 analysis and their magnitude of their average change per 1 year of age. The two outer rings illustrated genes that encode known receptors for each cytokine and their associated change per one year of age. P values for the cytokines were calculated using linear models and Benjamini-Hochberg correction. *P<0.05, **P<0.01, ***P<0.001.

Similar articles

References

    1. O’Driscoll M. et al. Age-specific mortality and immunity patterns of SARS-CoV-2. Nature 590, 140–145 (2021). - PubMed
    1. Ozonoff A. et al. Phenotypes of disease severity in a cohort of hospitalized COVID-19 patients: Results from the IMPACC study. EBioMedicine 83, 104208 (2022). - PMC - PubMed
    1. Wu C. et al. Risk Factors Associated With Acute Respiratory Distress Syndrome and Death in Patients With Coronavirus Disease 2019 Pneumonia in Wuhan, China. JAMA Intern. Med. (2020) doi:10.1001/jamainternmed.2020.0994. - DOI - PMC - PubMed
    1. United States Centers for Disease Control and Prevention. Risk for COVID-19 Infection, Hospitalization, and Death By Age Group. Risk for COVID-19 Infection, Hospitalization, and Death By Age Group https://www.cdc.gov/coronavirus/2019-ncov/covid-data/investigations-disc... (2022).
    1. NABEC/UKBEC Consortium et al. The transcriptional landscape of age in human peripheral blood. Nat. Commun. 6, 8570 (2015). - PMC - PubMed

Publication types