[Preprint]. 2024 Feb 18:2024.02.16.24302944.
doi: 10.1101/2024.02.16.24302944.

Adiposity and cancer: meta-analysis, mechanisms, and future perspectives

Affiliations

Adiposity and cancer: meta-analysis, mechanisms, and future perspectives

Eleanor L Watts et al. medRxiv. .

Abstract

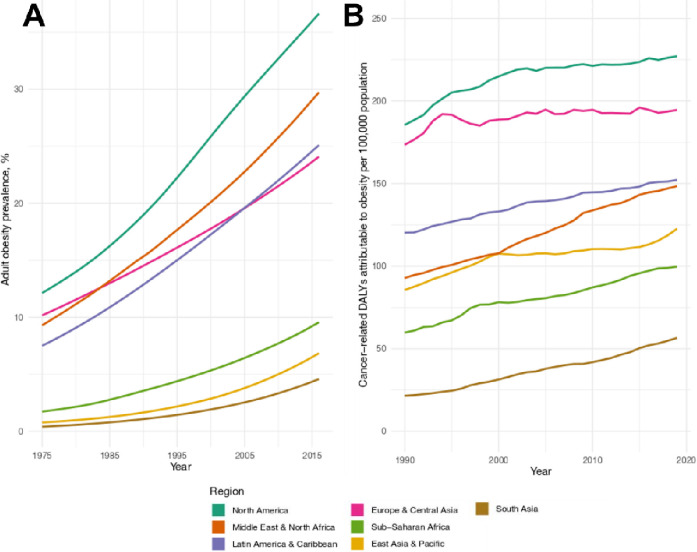
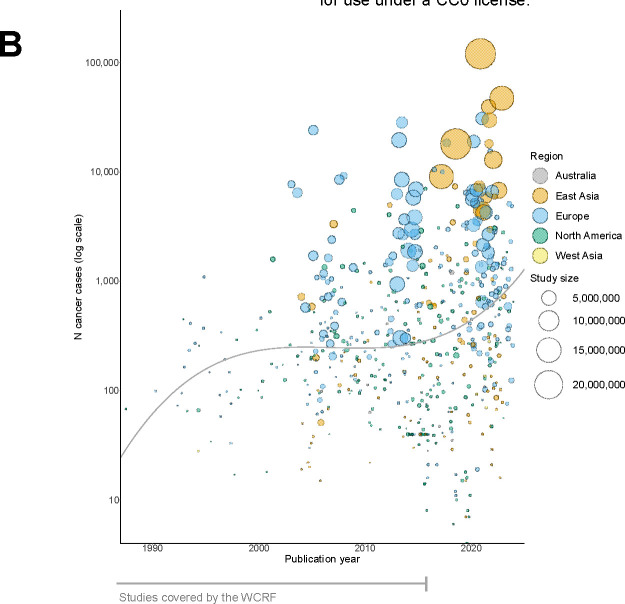
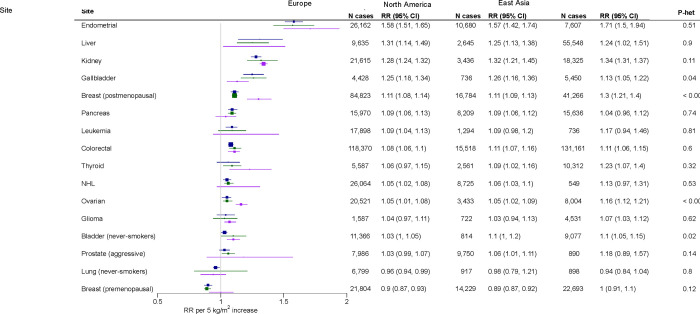
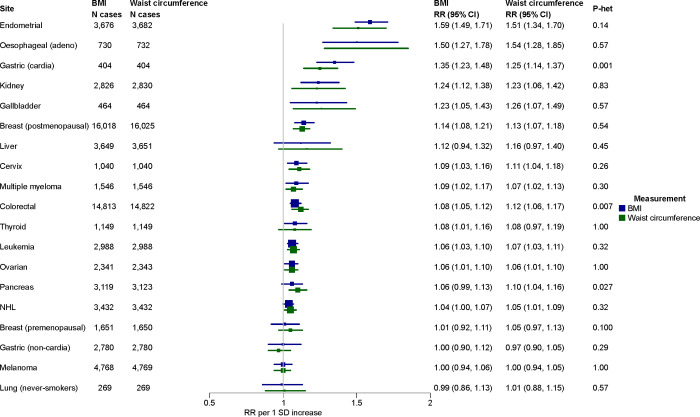
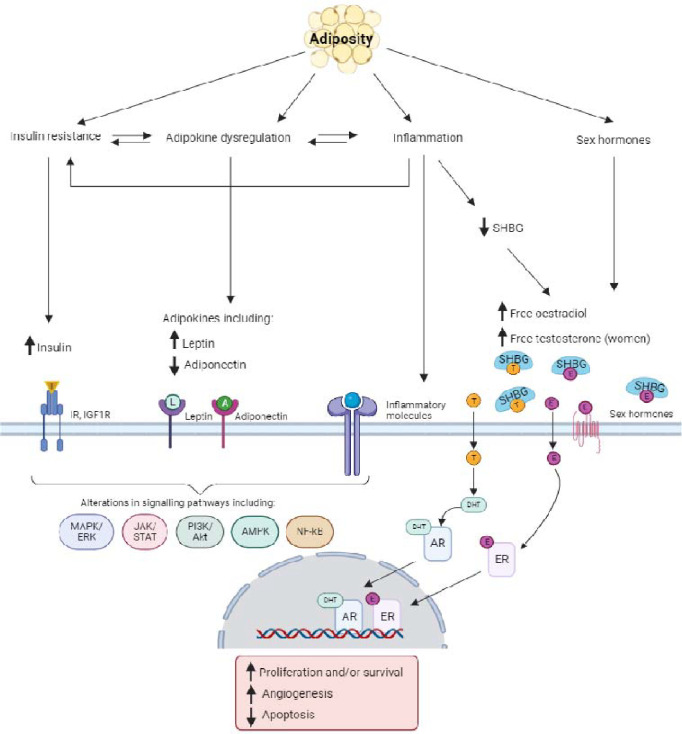
Obesity is a recognised risk factor for many cancers and with rising global prevalence, has become a leading cause of cancer. Here we summarise the current evidence from both population-based epidemiologic investigations and experimental studies on the role of obesity in cancer development. This review presents a new meta-analysis using data from 40 million individuals and reports positive associations with 19 cancer types. Utilising major new data from East Asia, the meta-analysis also shows that the strength of obesity and cancer associations varies regionally, with stronger relative risks for several cancers in East Asia. This review also presents current evidence on the mechanisms linking obesity and cancer and identifies promising future research directions. These include the use of new imaging data to circumvent the methodological issues involved with body mass index and the use of omics technologies to resolve biologic mechanisms with greater precision and clarity.


Conflict of interest statement

Ethics declarations Competing interests The authors declare no competing interests.

Figures

Figure 1:
Figure 1:. Recent transformative advances in epidemiological research
Figure 2
Figure 2
A. Distributions of adiposity storage B. Correlations of adiposity measures Partial Pearson correlations estimated in the UK Biobank population estimated by Christakoudi et al., 2021. Lean mass and fat mass were measured using DXA, abdominal SAT and VAT were measured using MRI. Correlations were adjusted for age, weight change during the preceding visit, alcohol, physical activity, socioeconomic status, region (except for VAT and abdominal SAT) and for women, menopausal status and use of hormone replacement therapy. Body composition measurements were scaled by height, and then computed into sex-specific z-scores. Correlations were estimated separately for men and women, the median value by sex is displayed here. The largest difference in the correlation coefficient between sexes=0.23 (waist-to-hip ratio and fat mass, r=0.61 and 0.38 for men and women, respectively). Median difference in r=0.04. Abbreviations: BMI=body mass index, DXA=dual-energy x-ray absorptiometry, MRI=magnetic resonance imaging, SAT=subcutaneous adipose tissue, VAT=visceral adipose tissue.
Figure 3
Figure 3
A: Global trends in obesity prevalence in adults 1975–2016. Based on obesity prevalence estimates (https://www.ncdrisc.org/) and the UN adult population estimates (https://population.un.org/). B: Age-adjusted rate of DALYs due to cancer attributable to high BMI, per 100,000 population. Based on the GBD Study data (https://www.healthdata.org/data-visualization/gbd-results). One DALY is equivalent to one lost year of full health. Abbreviations: BMI=body mass index; DALY=disability-adjusted life year; GBD=Global Burden of Disease; UN=United Nations
Figure 4A:
Figure 4A:. World map of included cohorts
Numbers show the number of prospective cohorts with cancer data in each country included in this meta-analysis. Study population is the sum of cohort participants within each country. For cohorts with different analytic cohort sizes in different publications, the largest analytic size was used. Text labels list prospective studies with >100,000 participants for each region. Abbreviations: 40-y=40-year cohort, 45 and Up=The Sax Institute’s 45 and Up Study, BCSC=Breast Cancer Surveillance Consortium, CKB=China Kadoorie Biobank, CONOR=Cohort of Norway, CPRD=UK Clinical Practice Research Datalink, CPS=Cancer Prevention Study, CTS=California Teachers Study, DMBR=Danish Medical Birth Registry, EPIC=European Prospective Study into Cancer and Nutrition, HEXA-G=Health Examinees-Gem, JPHC=Japan Public Health Center, KCPS=Korean Cancer Prevention Study, KNHIS=National Health Insurance Service of Korea, KPMCP=Kaiser Permanente Medical Care Program, MEC=Multiethnic Cohort Study, MWS=Million Women Study, NBHPC=Norwegian BMI/Height Prospective Cohort 1963–2001, NHIS-HEALS=National Health Insurance Service-National Health Screening Cohort, NHS=Nurses’ Health Study, NIH-AARP=National Institutes of Health-AARP, NLCS=Netherlands Cohort Study, NOWAC=Norwegian Women and Cancer Study, PLCO=Prostate, Lung, Colorectal and Ovarian Cancer Screening Trial, SCWC=Swedish Construction Workers Cohort, SIDIAP=Information System for Research in Primary Care, WHI=Women’s Health Initiative, VHM&PP=Vorarlberg Health Monitoring and Prevention Programme
Figure 4B:
Figure 4B:. Prospective cancer studies by N incident cancer cases and publication year
The size of each bubble is proportional to the size of the analytic cohort. Bubbles show the number of participants within each BMI-cancer study and represent the most recent data available for each BMI-cancer association (i.e., we excluded studies using duplicate cohorts with fewer site-specific cancers). Trend line represents the average number of cases per year, modelled by polynomial spline. The upward trend over time is driven primarily by the addition of large healthcare databases but also partly reflect our sample size criterion (n>50,000) for studies published after the WCRF reports. Abbreviations: WCRF=World Cancer Research Fund.
Figure 5:
Figure 5:. Associations between BMI with cancer risk, RR per 5 kg/m2 increase in BMI
RRs are represented by squares (with their 95% CIs as lines). Observational risk estimates were calculated using random effects meta-analysis. Heterogeneity is quantified using I2, an I2 close to 100% indicates substantial heterogeneity but can be affected by the number of studies and the precision of individual study estimates. Further details of model adjustments, follo time, analytic population for each study are available from Supplementary Data 1. For Mendelian randomisation studies, results were selected from single genetic ancestry populati reduce confounding by population structure and the I2 quantifies heterogeneity between studies rather than between individual SNPs. References for the Mendelian randomisation studies follows: oesophageal (adenocarcinoma), meningioma, breast (pre and postmenopausal), head and neck, prostate, glioma, gastric (non-cardia), and for other cancers. *Observational risk estimates based on never-smokers only. Abbreviations: Adeno=adenocarcinoma, BMI=body mass index, CI=confidence interval, NHL=non-Hodgkin lymphoma, RR=risk ratio, SNP=single nucleotide polymorphism.
Figure 6:
Figure 6:. Associations between BMI and cancer risk by region
Figure restricted to sites with >500 cases per region and estimates available for Europe, North America, and East Asia. Risk estimates were calculated using random effects meta-analysis. P-heterogeneity was estimated using the Q-statistic and includes the regions Australia, South Asia, and West Asia (not shown here due to the low number of cancers). Full results for each site and region are available from Supplementary Figures 28–52. Abbreviations: CI=confidence interval, NHL=non-Hodgkin lymphoma, RR=risk ratio, SD=standard deviation, SQ=squamous cell carcinoma
Figure 7:
Figure 7:. Associations of BMI, waist circumference and cancer risk, per 1 SD increase
Associations estimated from 6 studies,–, pooled using random effects meta-analysis. Heterogeneity in the associations with each cancer site by adiposity measure was estimated using the Wald statistic. Abbreviations: CI=confidence interval, NHL=non-Hodgkin lymphoma, RR=risk ratio, SD=standard deviation
Figure 8:
Figure 8:. Simplified schematic of the established biological mechanisms between obesity and cancer
Abbreviations: AMPK=AMP-activated protein kinase, AR=androgen receptor, DHT=dihydrotestosterone, E=oestradiol, ER=oestradiol receptor, ERK=extracellular signal-regulated kinase, IGF1R=insulin-like growth factor 1 receptor, IR=insulin receptor, JAK=Janus kinase, PI3K=phosphoinositide 3-kinase, MAPK=Mitogen activated protein kinase, NF-kB=Nuclear factor kappa B, SHBG=sex hormone-binding globulin, STAT=signal transducer and activator of transcription, T=testosterone. Created with BioRender.com

Similar articles

References

    1. Blitzer P. H., Blitzer E. C. & Rimm A. A. Association between teen-age obesity and cancer in 56,111 women: all cancers and endometrial carcinoma. Prev. Med. 5, 20–31 (1976). - PubMed
    1. de Waard F. & Baanders-van Halewijn E. A. A prospective study in general practice on breast-cancer risk in postmenopausal women. Int. J. Cancer 14, 153–160 (1974). - PubMed
    1. Wynder E. L., Escher G. C. & Mantel N. An epidemiological investigation of cancer of the endometrium. Cancer 19, 489–520 (1966). - PubMed
    1. Hooper L. et al. Public awareness and healthcare professional advice for obesity as a risk factor for cancer in the UK: a cross-sectional survey. J. Public Health Oxf. Engl. 40, 797–805 (2018). - PMC - PubMed
    1. AICR. The AICR 2015 Cancer Risk Awareness Survey Report. (2015).

Publication types