[Preprint]. 2024 Jun 7:2024.02.16.580712.
doi: 10.1101/2024.02.16.580712.

The budding yeast Fkh1 Forkhead associated (FHA) domain promoted a G1-chromatin state and the activity of chromosomal DNA replication origins

Affiliations

The budding yeast Fkh1 Forkhead associated (FHA) domain promoted a G1-chromatin state and the activity of chromosomal DNA replication origins

Timothy Hoggard et al. bioRxiv. .

Update in

Abstract

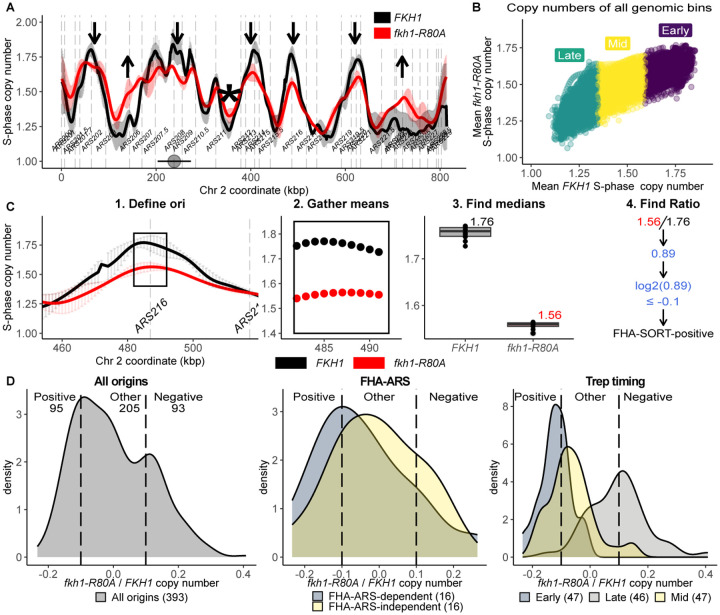
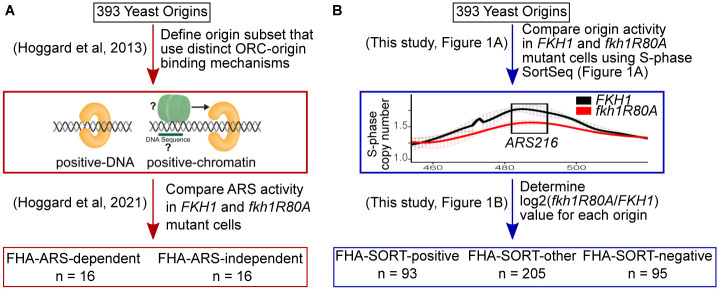
In Saccharomyces cerevisiae, the forkhead (Fkh) transcription factor Fkh1 (forkhead homolog) enhances the activity of many DNA replication origins that act in early S-phase (early origins). Current models posit that Fkh1 acts directly to promote these origins' activity by binding to origin-adjacent Fkh1 binding sites (FKH sites). However, the post-DNA binding functions that Fkh1 uses to promote early origin activity are poorly understood. Fkh1 contains a conserved FHA (forkhead associated) domain, a protein-binding module with specificity for phosphothreonine (pT)-containing partner proteins. At a small subset of yeast origins, the Fkh1-FHA domain enhances the ORC (origin recognition complex)-origin binding step, the G1-phase event that initiates the origin cycle. However, the importance of the Fkh1-FHA domain to either chromosomal replication or ORC-origin interactions at genome scale is unclear. Here, S-phase SortSeq experiments were used to compare genome replication in proliferating FKH1 and fkh1-R80A mutant cells. The Fkh1-FHA domain promoted the activity of 100 origins that act in early to mid- S-phase, including the majority of centromere-associated origins, while simultaneously inhibiting 100 late origins. Thus, in the absence of a functional Fkh1-FHA domain, the temporal landscape of the yeast genome was flattened. Origins are associated with a positioned nucleosome array that frames a nucleosome depleted region (NDR) over the origin, and ORC-origin binding is necessary but not sufficient for this chromatin organization. To ask whether the Fkh1-FHA domain had an impact on this chromatin architecture at origins, ORC ChIPSeq data generated from proliferating cells and MNaseSeq data generated from G1-arrested and proliferating cell populations were assessed. Origin groups that were differentially regulated by the Fkh1-FHA domain were characterized by distinct effects of this domain on ORC-origin binding and G1-phase chromatin. Thus, the Fkh1-FHA domain controlled the distinct chromatin architecture at early origins in G1-phase and regulated origin activity in S-phase.


Conflict of interest statement

Conflict of interest statement None declared.

Figures

Figure 1:
Figure 1:. The Fkh1-FHA domain contributed to normal replication of the yeast genome during an unperturbed cell cycle.
(A) Normalized S-phase copy numbers across chromosome II for two independent fkh1-R80A mutant cell populations (red) and three independent FKH1 populations (black). The solid lines are the mean obtained for each 1 kb region assessed from each experiment, and the shaded vertical lines indicate the 95% confidence interval for that mean. Downward arrows mark origins whose activity is reduced in fkh1-R80A cells, while upward pointing arrows mark origins whose activity is enhanced. The * marks a termination zone whose replication has been altered substantially by the fkh1-R80A allele. (B) The approach used to quantify the impact of the fkh1-R80A allele on each origin across the yeast genome is depicted for FHA-positive origin ARS216. First a 10 kb fragment centered on the T-rich start of the defined ORC site was selected (1, boxed region). Next, the mean S-phase value for each 1 kb region across this 10 kb origin fragment for FKH1, (black) or fkh1-R80A (red) cells was determined (2, each dot represents a distinct 1 kb region within the 10 kb origin locus). Next, the median value of the 10 means was determined for each origin and assigned as a distinct S-phase value in either FKH1 or fkh1-R80A cells (3). Finally, the log2 of each origin’s fkh1-R80A/FKH1 S-phase copy number ratio was determined (4) and used in subsequent graphs. (C) The distribution log2(fkh1-R80A/FKH1) values for each origin was summarized by smoothed kernel density estimates (KDE) for the indicated origin groups. KDE plots of origin number (density, y-axis) versus log2(fkh1-R80A/FKH1) ratios (x-axis) are displayed. ‘All origins’ refers to the 393 confirmed origins from the 410 origins defined in [48] for which we could assign a high-confidence ORC site [12]. ‘FHA-ARS’ refers to the 32 origins characterized in a previous study as described in [12]. ‘Trep timing’ refers to the 238 origins assigned a replication time (Trep) as measured for a synchronous S-phase as in [29]. Origins with log2(fkh1-R80A/FKH1) values −0.1 were considered positively regulated by the Fkh1-FHA domain (FHA-SORT-positive), while those with log2(fkh1-R80A/FKH1) values +0.1 were considered negatively regulated (FHA-SORT-negative). These cut-offs are indicated on the KDE plots with vertical lines. All origins that failed to meet these cut-offs were placed in the ‘Other’ category. (D) Quantitative analysis of the effect of the fkh1-R80A allele on duplication of the entire yeast genome. The genome was parsed into 11,800 1 kb regions. The mean S-phase copy number for each region in fkh1-R80A cells (y-axis) was plotted against the mean of its S-phase copy number in FKH1 cells (x-axis). The colors indicate the regions that replicate in the first (early, purple), middle (mid, yellow) or last (late, green) third of S-phase.
Figure 2:
Figure 2:. Summary of the functionally defined Fkh1-FHA-regulated origin groups relevant to this study.
(A) The Fkh1-FHA-ARS regulated origins were defined over the course of previous studies [12,23,30]. First, a collection of two origin groups that used distinct mechanisms for ORC-origin binding were defined. At positive-DNA origins the in vivo ORC-origin interaction can be explained by the strength of the intrinsic ORC-origin DNA binding interaction in vitro. In contrast, positive-chromatin origins display weak ORC-origin DNA binding interactions in vitro. Therefore, a model for ORC binding to positive-chromatin origins is that they are associated with a feature(s) extrinsic to the ORC site that promote ORC binding in vivo. In the simplest direct scenario, an origin-adjacent DNA sequence binds a factor that interacts with ORC to aid in its binding to origin DNA. These origin collections were then assessed using an ARS assay in fkh1-R80A and FKH1 cells. Out of 32 origins assessed, 16 showed reduced activity in fkh1-R80A cells (FHA-ARS-dependent) and 16 were relatively unaffected or showed enhanced activity (FHA-ARS-independent). An origin producing a 2-fold reduction in ARS activity in fkh1-R80A cells is defined as an FHA-ARS-dependent origin. The majority (75%) of FHA-ARS-dependent origins are also positive-chromatin origins, while the majority (75%) of FHA-ARS-independent origins are positive-DNA origins. This division was potentially a slight underestimate of the linkage between ORC-origin binding mechanism and FHA-dependent ARS activity. Specifically, ARS516 is assigned to the FHA-ARS-independent group, while based on the analyses in Figure S3, it was better aligned with the FHA-ARS-dependent group. Thus, 76.5% of FHA-ARS-dependent origins are also positive-chromatin and 73.3% of FHA-ARS-independent origins are positive-DNA origins. Regardless, FHA-ARS-activity was linked to ORC-origin binding mechanisms within these origin subgroups. (B) FHA-SORT-regulated origins were defined solely based on the effect the fkh1-R80A allele had on their normalized S-phase copy number, as described in Figure 1.
Figure 3:
Figure 3:. The FHA-SORT-positive and Fkh1/2-activated origin groups overlapped significantly, but the FHA-SORT-positive group included centromere-associated origins.
(A) Overlap between the FHA-SORT-positive origins and the FHA-SORT-negative origins. The Fkh1/2-activated and Fkh1/2-repressed origins were defined previously by BrdU incorporation followed by IP [10]. (B) SortSeq scans over two centromeres that had FHA-positive origins. For scans of all centromeres see Figure S4. The centromeres are indicated by gray circles, and the horizontal line indicates the 10 kbp region that was used to identify Cen-associated origins. The positions of confirmed origins are indicated with gray, dashed vertical lines. (C) The KDE graph includes 17 Cen-associated origins as a separate category. (D) The overlap among the 17 centromere-associated origins as defined in this study, and FHA-SORT-positive and Fkh1/2-activated origins. (E) An Fkh1 ChIP-chip dataset published in [12] was used to assess Fkh1-ChIP signals at Cen-associated origins that were either called as FHA-SORT-positive (light blue, n=12) or not (blue, n=5). The IP/input ratio for each nucleotide across the 10 kb span was determined, and the mean IP/input values for all nucleotides across all origins in the group are shown as a line, while the 95% confidence interval for each mean value is indicated by shading, as described previously [12].
Figure 4:
Figure 4:. FHA-SORT-defined and FHA-ARS-defined origins were associated with distinct FKH motif organizations.
(A) Sequence logos of the FKH motifs in both orientations were mapped at FHA-SORT-positive and FHA-SORT-negative origins (Figure 1) as purple (FKH1-T) or pink dashes (FKH1-A). The origins in each group are aligned with respect to their ORC sites (T-rich strand), the start (nucleotide 0) and final (nucleotide +32), indicated by the black box. (B) The fraction (y-axis) of origins within the indicated group (x-axis) containing at least one match to the indicated motif within the indicated origin regions for the relevant FHA-regulated origin groups classified by SortSeq in this study or by ARS assays previously [12] (see Figure 2). “5’FKH1-T” queried nucleotides −150 through −11 for FKH1-T motif matches, while “3’FKH1-A” queried nucleotides +41 through +150 for FKH1-A matches. The “ORC-overlapping” region encompassed nucleotides −10 through +40 and was queried for FKH1-T motifs. The black bars refer to origin groups classified by Sortseq in this study (Figure 2B). Gray bars refer to the smaller subsets of origins classified previously (Figure 2A) [12]. The horizontal line indicates the fraction of all confirmed origins (n=393) that contained a match to the queried FKH1 motif in the origin region under assessment. The enrichment or depletion of a given motif in any given origin group was challenged against the fraction of that motif in all confirmed origins using the hypergeometric distribution function. Significant P-values are denoted by asterisks (*, P < 0.05; **, P < 0.001; ***, P < 0.0001). In these analyses, 150 bp regions 5’ and 3’ of the ORC site were queried. In the previous study [12], 250 bp were queried for these regions. This difference explained why only 10 FHA-ARS-dependent origins contained a 5’FKH-T in this study versus 12 in the previous study. (C) The cumulative fraction of origins (y-axis) in the indicated groups containing a 5’FKH-T (left) or a 3’FKH-A (right) after traversing the indicated number of nucleotides from the ORC site (x-axis). Thus 50% of all FHA-ARS-dependent origins contained an FKH-T site within the first 116 nucleotides 5’ of the ORC site, while 50% of all confirmed origins did not reach this level of FKH-T site accumulation until 284 base pairs. Nucleotide positions that reached P-value significance values of 0.01 are indicated by gray cross marks derived from hypergeometric distributions where at each position, the fraction of origins in the queried collection that contained a match by that nucleotide position was reached is compared to the fraction of all confirmed origins (n=393) that contained a match by the same position. (D) Summary of the 50% accumulation point for the analyses in (C).
Figure 5:
Figure 5:. The Fkh1-FHA domain promoted normal ORC ChIPSeq signals at positively-regulated origin groups.
ORC ChIPSeq data [12] was assessed at the indicated origin groups by plotting the per-nucleotide mean signal for the internally normalized ORC ChIPSeq signals (95% confidence intervals are included in Figure S5) across the spans of the indicated origin groups, aligned based on the T-rich strand of their ORC sites, with ‘0’ marking the first nucleotide of the site. (A) FHA-ARS-dependent and -independent origins in FKH1 (black) and fkh1-R80A (red) cells (see Figure 2A). (B) The same data as in panel (A) except with both FHA-ARS-dependent (dark blue) and independent (light blue) signals plotted on the same graph for either FKH1 or fkh1-R80A cells. Panels (C) and (D) as in (A) and (B), respectively, except for FHA-SORT-defined origins (see Figure 2B). Panels (E) and (F) as in (A) and (B), respectively, except for FKH1/2-BrdU-defined origins as in [10].
Figure 6:
Figure 6:. The Fkh1-FHA domain altered origin- and promoter-adjacent nucleosome behavior.
(A) Plot2DO-generated heat map for the MNaseSeq data for the 393 confirmed origins [36]. The fragments consistent with nucleosome protection (142–162 bp fragments, teal) and those consistent with subnucleosome protection (121–141 bp, designated, black) are indicated. To convert these signals into graphs, the summed signals for each nucleotide on the x-axis were determined within the indicated fragment-size ranges and plotted on the y-axis for FKH1 and fkh1-R80A experiments (middle panel). To quantify nucleosome stability, the per-nucleotide nucleosome:subnucleosome ratio for fkh1-R80A samples was divided by the same ratio determined for FKH1 samples. (B) Plot2DO-generated heat maps and summed frequency graphs generated for the MNaseSeq data for the 393 confirmed origins in the indicated cell types under G1-arrested and Proliferating conditions at the 8U MNase experiment (C) As in (B) for the 16U MNase experiment. (D) As in (B) except for gene promoters. (E) As in (C) except for gene promoters.
Figure 7:
Figure 7:. The Fkh1-FHA domain promoted a broad NDR at FHA-ARS-dependent origins in G1-arrested cells.
Scaled nucleosome signals (generated from 8U MNase experiment) for (A) The FHA-ARS-dependent origin cohort in the FKH1 sample under G1-arrested and Proliferating conditions. (B) The FHA-ARS-dependent origin cohort in FKH1 and fkh1-R80A samples under G1-arrested conditions. (C) The FHA-ARS-dependent origin cohort in FKH1 and fkh1-R80A samples under Proliferating conditions. (D-F) As in (A-C), respectively, except for scaled ORC/Cdc6 signals. (G-I) As in (A-C), respectively, and (J-L), as in (D-F), respectively, except for the FHA-ARS-independent cohort.
Figure 8:
Figure 8:. The Fkh1-FHA domain promoted a 5’ extended ORC signal at the FHA-SORT-positive origin group in G1-arrested cells.
Scaled nucleosome signals (generated from 8U MNase experiment) for (A) The FHA-SORT-positive origin cohort in the FKH1 sample under G1-arrested and Proliferating conditions. (B) The FHA-SORT-positive origin cohort in FKH1 and fkh1-R80A samples under G1-arrested conditions. (C) The FHA-SORT-positive origin cohort in FKH1 and fkh1-R80A samples under Proliferating conditions. (D-F) As in (A-C), respectively, except for scaled ORC/Cdc6 signals. (G-I) As in (A-C), respectively, and (J-L), as in (D-F), respectively, except for the FHA-SORT-negative origin cohort.

Similar articles

References

    1. Costa A, Diffley JFX. The Initiation of Eukaryotic DNA Replication. Annu Rev Biochem. 2022;91: 107–131. - PubMed
    1. Bell SP, Labib K. Chromosome Duplication in Saccharomyces cerevisiae. Genetics. 2016;203: 1027–1067. - PMC - PubMed
    1. Rhind N. DNA replication timing: Biochemical mechanisms and biological significance. Bioessays. 2022;44: e2200097. - PMC - PubMed
    1. Marks AB, Fu H, Aladjem MI. Regulation of Replication Origins. Adv Exp Med Biol. 2017;1042: 43–59. - PMC - PubMed
    1. Aparicio OM. Location, location, location: it’s all in the timing for replication origins. Genes Dev. 2013;27: 117–128. - PMC - PubMed

Publication types