[Preprint]. 2024 Feb 5:rs.3.rs-3880128.
doi: 10.21203/rs.3.rs-3880128/v1.

Revealing the atomic and electronic mechanism of human manganese superoxide dismutase product inhibition

Affiliations

Revealing the atomic and electronic mechanism of human manganese superoxide dismutase product inhibition

Gloria Borgstahl et al. Res Sq. .

Update in

Abstract

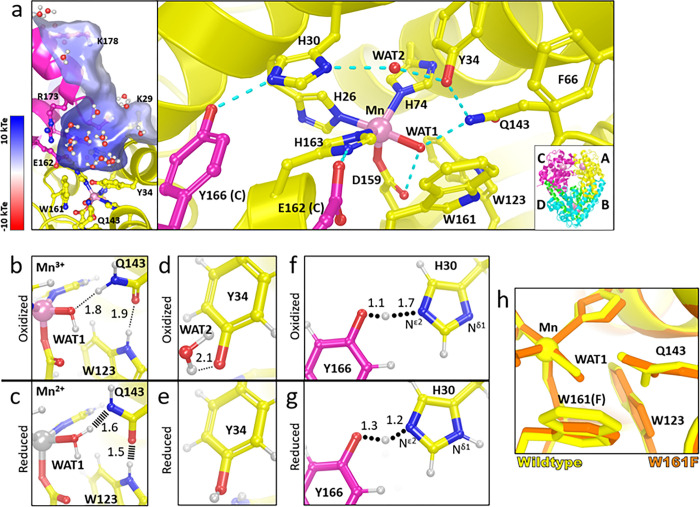
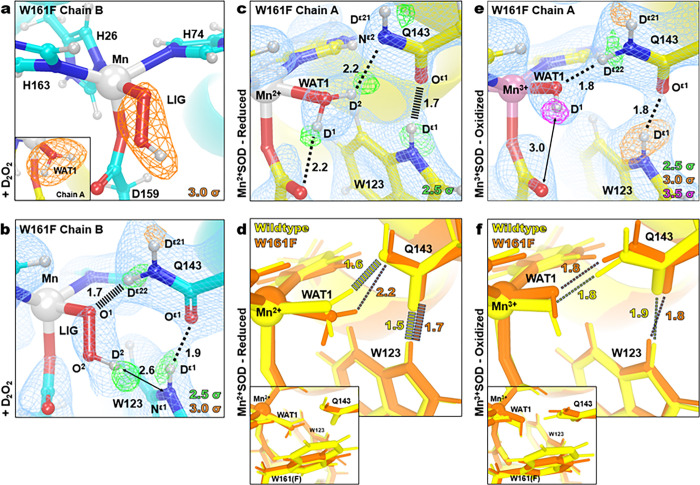
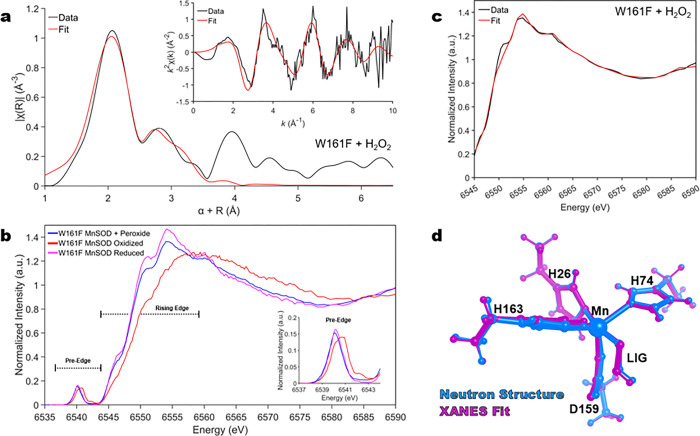
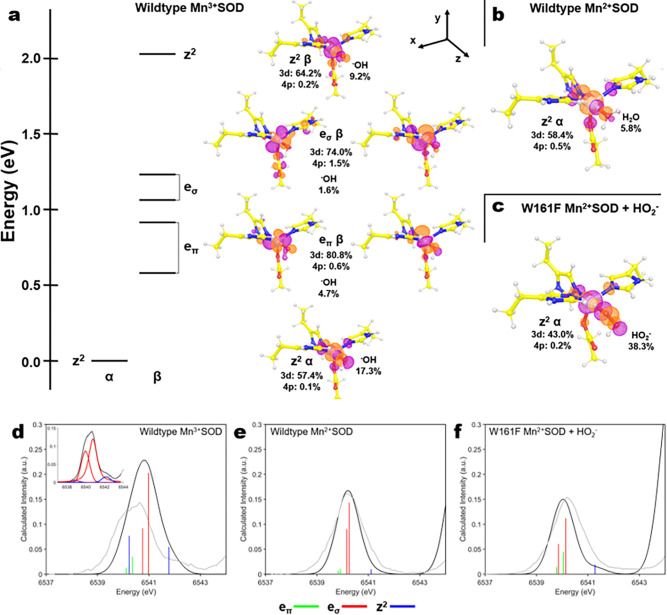
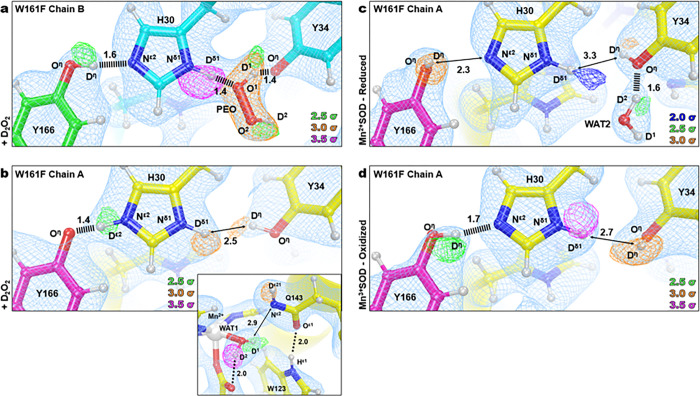
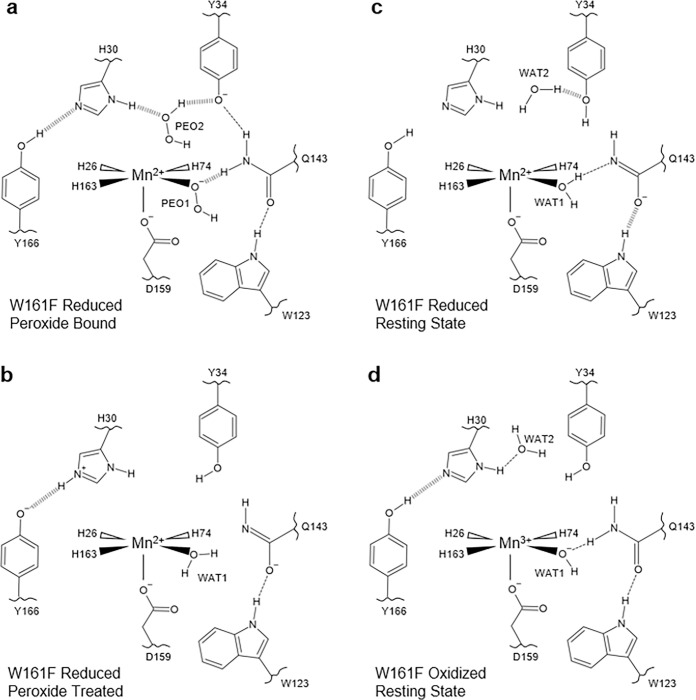
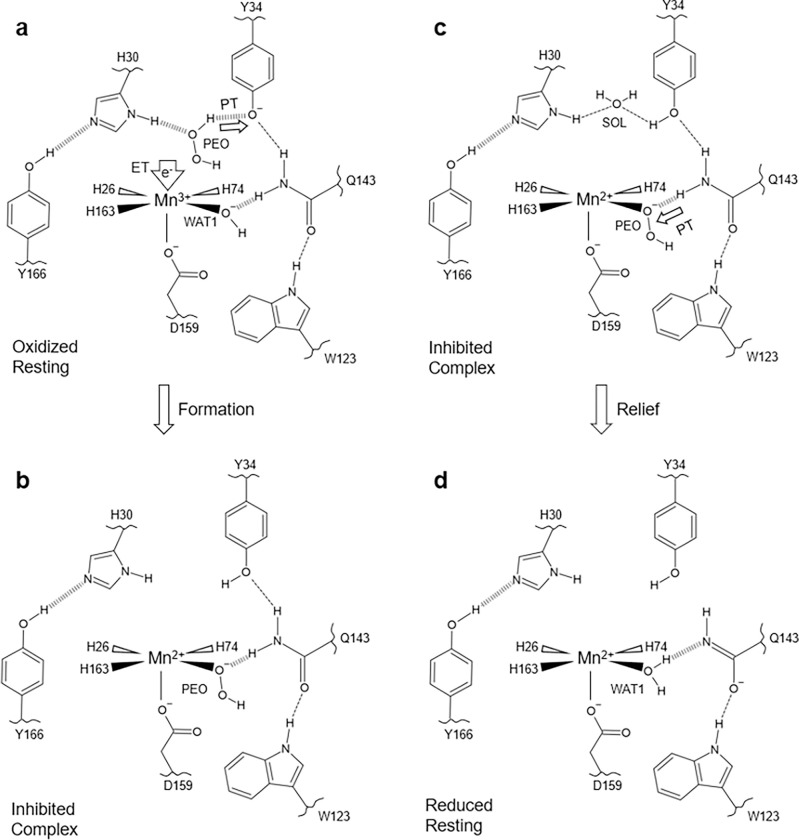
Human manganese superoxide dismutase (MnSOD) is a crucial oxidoreductase that maintains the vitality of mitochondria by converting O2- to O2 and H2O2 with proton-coupled electron transfers (PCETs). Since changes in mitochondrial H2O2 concentrations are capable of stimulating apoptotic signaling pathways, human MnSOD has evolutionarily gained the ability to be highly inhibited by its own product, H2O2. A separate set of PCETs is thought to regulate product inhibition, though mechanisms of PCETs are typically unknown due to difficulties in detecting the protonation states of specific residues that coincide with the electronic state of the redox center. To shed light on the underlying mechanism, we combined neutron diffraction and X-ray absorption spectroscopy of the product-bound, trivalent, and divalent states to reveal the all-atom structures and electronic configuration of the metal. The data identifies the product-inhibited complex for the first time and a PCET mechanism of inhibition is constructed.


Conflict of interest statement

Additional Declarations: There is NO Competing Interest.

Figures

Figure 1
Figure 1. Structure of human wildtype MnSOD and protonation changes coupled to oxidation states.
a The active sites of tetrameric MnSOD are in a positively charged cavity between two subunits. Blue dashes indicate hydrogen bonds. The inset indicates chain identity where the dimeric crystallographic asymmetric unit is composed of chains A and B while C and D are generated by symmetry. b, c Room temperature neutron structures of Mn3+SOD and Mn2+SOD show changes in protonation and hydrogen-bond distances for WAT1, Gln143, and Trp123. Dotted lines indicate hydrogen bonding and hashed lines indicate SSHBs. d, e Tyr34 is observed deprotonated in Mn3+SOD and protonated in Mn2+SOD. f, g A LBHB is seen between His30 and Tyr166, where a proton is transiently shared and is indicated by round dots. The Nδ1 of His30 is deprotonated when the Mn ion is oxidized and protonated when the Mn ion is reduced. Panel a was created from MnSOD X-ray structure (PDB ID 5VF9), panels b, d, and f are from the Mn3+SOD neutron structure (PDB ID 7KKS), and panels c, e, and g are from the Mn2+SOD neutron structure (PDB ID 7KKW). All hydrogen positions were experimentally determined with the exception of solvent molecules in panel a that were randomly generated to accentuate the solvent in the active site funnel. h Active site overlay of wildtype MnSOD (yellow) and Trp161Phe MnSOD (orange). All distances are in Å.
Figure 2
Figure 2. Neutron structures and protonation states at the active site of D2O2-soaked, reduced, and oxidized Trp161Phe MnSOD.
a D2O2-soaked Trp161Phe MnSOD for chain B with a singly-protonated dioxygen ligand, denoted LIG. Chain A is displayed as an inset to highlight differences in the difference density shapes that led to the identification of LIG in chain B. b D2O2-soaked Trp161Phe MnSOD for chain B. c Trp161Phe Mn2+SOD for chain A. d Active site overlay of wildtype Mn2+SOD and Trp161Phe Mn2+SOD demonstrating differences in hydrogen bond strength of the Gln143 amide anion and movement of WAT1. Inset highlights the position of the residue 161 mutation. e Trp161Phe Mn3+SOD for chain A. f Active site overlay of wildtype Mn3+SOD and Trp161Phe Mn3+SOD. Inset highlights the position of the residue 161 mutation. Green, orange, and magenta omit F0Fc difference neutron scattering length density of protons displayed at 2.5σ, 3.0σ, and 3.5σ. respectively. Light blue 2FoFc density is displayed at 1.0σ. Distances are in Å. Dashed lines indicate typical hydrogen bonds and hashed lines indicate SSHBs that are hydrogen bonds < 1.8 Å.
Figure 3
Figure 3. X-ray Absorption Spectroscopy of Trp161Phe MnSOD.
a Fourier transform of Mn K-edge EXAFS data [k2χ(k)] from hydrogen peroxide-soaked Trp161Phe MnSOD with the raw EXAFS spectrum seen in the inset. Due to the scattering phase shift, the distance found by the Fourier Transformation (R) is ~0.5 Å shorter than the actual distance and a 0.5 Å correction (α) was implemented. The black line represents the experimental data, while the red line is simulated EXAFS spectra from the neutron structure fit to the experimental data. b Kα HERFD-XANES of Trp161Phe MnSOD treated with hydrogen peroxide, potassium dichromate, and sodium dithionite to isolate the product-inhibited, Mn3+SOD resting, and Mn2+SOD resting states, respectively. The inset corresponds to a zoom-in of the pre-edge. c Fit of HERFD-XANES spectra of Trp161Phe MnSOD treated with hydrogen peroxide. The black line represents the experimental data, while the red line is simulated XANES spectra from the neutron structure fit to the experimental data. d Overlay of the neutron and XANES fit structures that are colored magenta and cyan, respectively.
Figure 4
Figure 4. DFT simulations of wildtype Mn3+SOD,Mn2+SOD, and Trp161Phe Mn2+SOD bound to HO2.
a Energy diagram of the unoccupied valence orbitals of Mn3+SOD. The energy axis is shifted to set the z2 α orbital at zero. The isosurface plots of the unoccupied orbitals are contoured at 0.05 au. Percentages of orbital character are derived from Löwdin population analysis where the C3v symmetry-related xz and yz orbitals were averaged for the eπ values, and the xy and x2-y2 orbitals were averaged for the eσ values. b The HOMO of Mn2+SOD. c The HOMO of Trp161Phe Mn2+SOD bound to HO2. d-f TDDFT simulated spectra where the simulated spectrum is colored black, and the corresponding experimental HERFD-XANES spectrum is colored gray. The green, red, and blue vertical lines correspond to eπ, eσ, and z2 transitions, respectively. Simulated intensities were uniformly scaled to experimental intensities, and the energy axis was shifted. Due to a misestimation of the Mn3+SOD pre-edge spectra from the TDDFT simulation (see text), a pseudo-Voight peak fit was performed with identical color-coding of the transitions and is included as an inset for panel d. Unclear peak identities are colored purple.
Figure 5
Figure 5. Neutron structures and protonation states of second sphere active site residues in D2O2-soaked, reduced, and oxidized Trp161Phe MnSOD.
a D2O2-soaked Trp161Phe MnSOD at the active site of chain B. b D2O2-spaked Trp161Phe MnSOD at the active site of chain A. Inset highlights the structure near the divalent Mn ion. Chain B is more accessible to solvent than chain A and helps explain differences in ligand binding. c Divalent resting state of Trp161Phe MnSOD at the active site of chain A. d Trivalent resting state of Trp161Phe MnSOD at the active site of chain A. Blue, green, orange, and magenta omit FoFc difference neutron scattering length density of protons are displayed at 2.0 σ, 2.5σ, 3.0σ, and 3.5σ, respectively. Light blue 2FoFc density is displayed at 1.0σ. Distances are in Å. Dashed lines indicate typical hydrogen bonds, and hashed lines indicate SSHBs, hydrogen bonds < 1.8 Å. For the resting state structures, only one active site is shown due to high structural similarities, see Supplementary Fig. 4 for the other active site.
Figure 6
Figure 6. Summary of active site configurations observed for D2O2-soaked, reduced, and oxidized Trp161Phe MnSOD.
a Dioxygen-bound Trp161Phe MnSOD. The singly-protonated dioxygen species bound to the metal is probably hydroperoxyl anion as supported by DFT calculations. b Active site of Trp161Phe MnSOD treated with D2O2, though cryocooling did not capture a dioxygen species. c Reduced resting state of Trp161Phe MnSOD. d Oxidized resting state of Trp161Phe MnSOD. Dashed lines represent normal hydrogen bonds and wide dashed lines are SSHBs. The portrayal of structures and bond lengths in 2D are not representative of those seen experimentally in 3D.
Figure 7
Figure 7. A suggested mechanism for MnSOD product inhibition and relief.
a Product inhibition is dependent on the presence of H2O2 (denoted as PEO) coordinated between His30 and Tyr34 during the Mn3+Mn2+ redox transition. Due to the lack of experimental evidence for O2 binding and uncertainty in whether it requires coordination with the Mn ion for redox catalysis, the redox reaction is instead represented by a gain of an electron. For the formation of the inhibited complex to proceed, the gain of an electron by Mn3+ coincides with the deprotonation of H2O2 by Tyr34. Note that His30 has been shown to change protonation states on both of its nitrogen atoms and could potentially extract a proton from H2O2 instead of Tyr34. b After the PCET, HO2 replaces the WAT1 solvent molecule to form the inhibited complex characterized by the elimination of a Gln143-WAT1 interaction while the Mn ion is in the divalent redox state. c The relief of the inhibited complex involves protonation of HO2 by Gln143 to form H2O2 and an ionized Gln143 and subsequent replacement of the original WAT1 position by a water molecule. d After H2O2 leaves the active site, the Mn2+SOD is formed that is characterized by an ionized Gln143 forming a SSHB with WAT1, and Tyr34, His30, and Tyr166 in the neutral states. Dashed lines represent normal hydrogen bond and wide dashed lines are SSHBs. The portrayal of the displayed structures and bond lengths in 2D are not representative of those seen experimentally in 3D.

Similar articles

References

    1. McDonald A. G., Boyce S. & Tipton K. F. ExplorEnz: the primary source of the IUBMB enzyme list. Nucleic Acids Res 37, D593–597, doi:10.1093/nar/gkn582 (2009). - DOI - PMC - PubMed
    1. Albers D. S. & Beal M. F. Mitochondrial dysfunction and oxidative stress in aging and neurodegenerative disease. J. Neural Transm. Suppl. 59, 133–154 (2000). - PubMed
    1. Gao L., Laude K. & Cai H. Mitochondrial pathophysiology, reactive oxygen species, and cardiovascular diseases. Vet. Clin. North Am. Small Anim. Pract. 38, 137–155, vi, doi:10.1016/j.cvsm.2007.10.004 (2008). - DOI - PMC - PubMed
    1. Lipinski B. Hydroxyl radical and its scavengers in health and disease. Oxid. Med. Cell. Longev. 2011, 809696, doi:10.1155/2011/809696 (2011). - DOI - PMC - PubMed
    1. Reece S. Y. & Seyedsayamdost M. R. Long-range proton-coupled electron transfer in the Escherichia coli class Ia ribonucleotide reductase. Essays Biochem. 61, 281–292, doi:10.1042/EBC20160072 (2017). - DOI - PubMed

Publication types

LinkOut - more resources