[Preprint]. 2024 Feb 6:rs.3.rs-3878807.
doi: 10.21203/rs.3.rs-3878807/v1.

Partitioned polygenic risk scores identify distinct types of metabolic dysfunction-associated steatotic liver disease

Affiliations

Partitioned polygenic risk scores identify distinct types of metabolic dysfunction-associated steatotic liver disease

Stefano Romeo et al. Res Sq. .

Update in

Abstract

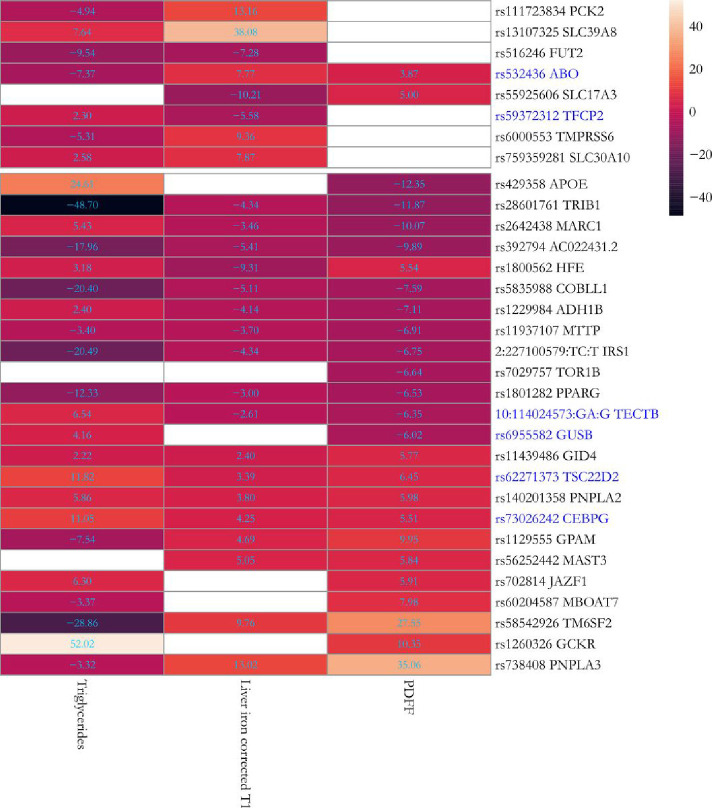
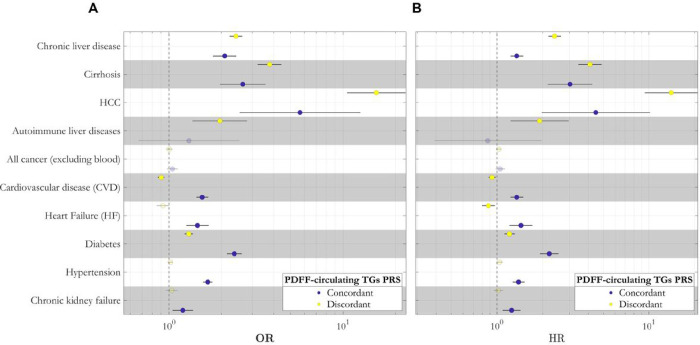
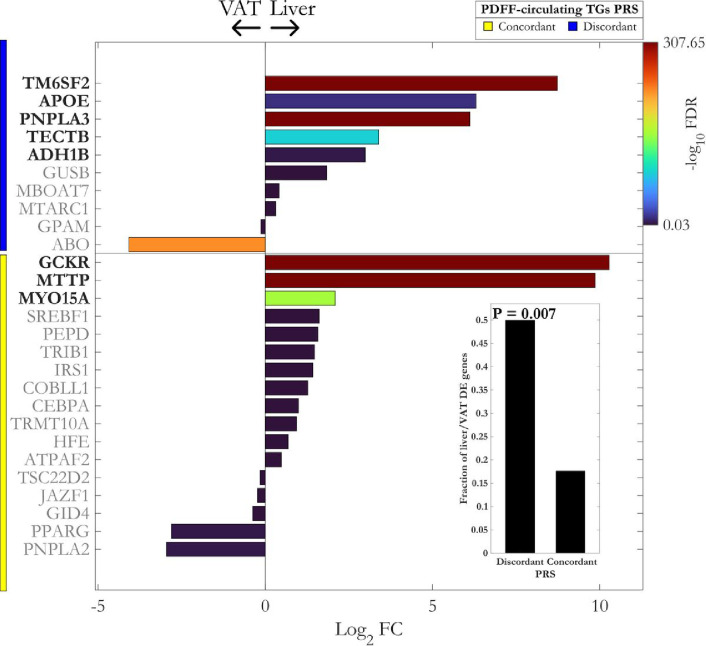
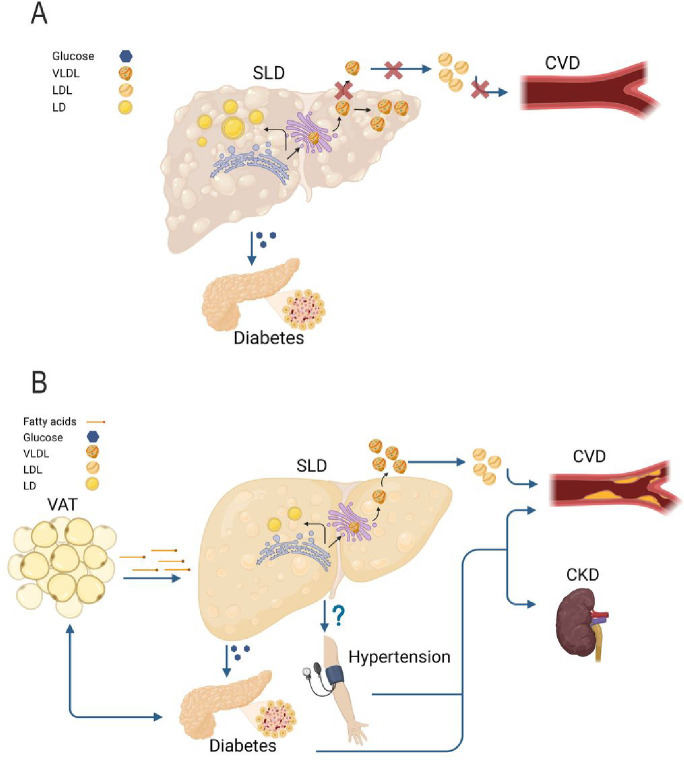
Metabolic dysfunction-associated steatotic liver disease (MASLD) encompasses an excess of triglycerides in the liver, which can lead to cirrhosis and liver cancer. While there is solid epidemiological evidence of MASLD coexisting with cardiometabolic disease, several leading genetic risk factors for MASLD do not increase the risk of cardiovascular disease, suggesting no causal relationship between MASLD and cardiometabolic derangement. In this work, we leveraged measurements of visceral adiposity and identified 27 novel genetic loci associated with MASLD. Among these loci, we replicated 6 in several independent cohorts. Next, we generated two partitioned polygenic risk scores (PRS) based on the mechanism of genetic association with MASLD encompassing intra-hepatic lipoprotein retention. The two PRS suggest the presence of at least two distinct types of MASLD, one confined to the liver resulting in a more aggressive liver disease and one that is systemic and results in a higher risk of cardiometabolic disease.


Conflict of interest statement

Conflicts of Interest: S.R. has been consulting for AstraZeneca, GSK, Celgene Corporation, Ribo-cure AB and Pfizer in the last 5 years and received the research grant from AstraZeneca. The funders had no role in the design of the study; in the collection, analyses, or interpretation of data; in the writing of the manuscript, or in the decision to publish the results. L.V. has received speaking fees from MSD, Gilead, AlfaSigma and AbbVie, served as a consultant for Gilead, Pfizer, AstraZeneca, Novo Nordisk, Intercept, Diatech Pharmacogenetics, Ionis Pharmaceuticals, Boehringer Ingelheim, Resalis Therapeutics, and received unrestricted research grants from Gilead. R.L.G is a part-time contractor of Metabolon Inc. All other authors have none to declare.

Figures

Figure 1:
Figure 1:. (A) Measures of adiposity are highly correlated with liver triglycerides and inflammation, and (B) among these measures, visceral adipose tissue (VAT), whole-body fat mass (WFM), and body mass index (BMI) are independent predictors of the liver outcomes (B).
In (A), the phenotypic correlation between different measures of adiposity, liver triglyceride content measured by proton density fat fraction (PDFF), and inflammation measured by liver iron corrected T1 (cT1); pairwise Spearman’s correlation coefficients have been shown on the heatmap. All correlations had a Benjamini-Hochberg False Discovery Rate (FDR) < 0.05. (B) penalized Ridge regression analysis of different adiposity indices in predicting PDFF and liver iron corrected T1. Each dot represents standardized coefficients, and dashed line represents the lack of contribution of each trait to the liver outcomes. Both target variables were rank-based inverse normal transformed before the regression analysis. IWB: impedance of whole body, WHR: waist-to-hip ratio.
Figure 2:
Figure 2:. (A) BMI and whole-body fat mass (WFM) have the highest genetic correlation with liver triglycerides content (PDFF) and inflammation (cT1), and (B) 37 for liver triglycerides and 18 for liver inflammation independent loci were found by the multi-adiposity-adjustment GWAS.
(A) Genetic correlation among different multi-adiposity-adjusted PDFF and liver iron corrected T1 was estimated using LD score regression analysis. The asterisks denote Benjamini-Hochberg False Discovery Rate (FDR) < 0.05. The colour bar represents the genetic correlation values. Detailed summary statistics for genetic correlations have been reported in Supplementary Table 2. (B) Circular Manhattan plot of PDFF and liver iron corrected T1 for different adiposity adjustments. Each dot represents an independent genetic locus. The yellow represents lociassociated with liver PDFF and purple those associated with liver cT1. Large dots represent pleiotropic loci, namely loci where the association with either PDFF or liver cT1 was shared among two or more adiposity adjustments. Small dots show adiposity-trait specific associations. Locin bold are shared among both traits irrespective of the adiposity adjustment. Only loci with a genome-wide significant p-value < 5E-8 calculated by whole-genome regression model (see methods) are shown. P-values were not corrected for multiple testing among 4 different models (unadjusted, adjusted for BMI, WFM and VAT). VAT: Visceral adipose tissue; WFM: Whole body fat mass (kg/m2).
Figure 3:
Figure 3:. (A) A consistent reciprocal trait association between novel loci and liver triglycerides (PDFF, yellow dot) and inflammation (purple dot, cT1) and (B) novel genetic loci were associated with liver disease and metabolic traits.
(A) Association was calculated by a whole-genome regression analysis and the colour of squares represent: no adjustment (red square) adjusted for BMI (black square), for whole-fat mass (WFM, green square) and visceral adipose tissue (VAT, orange square). The edge colours denote the direction of the association with the effect (risk) allele, and their thickness correspond to the strength of the association (−logl 0 P-value). (B) Heatmap of the Z-score of associations for the effect (risk) allele between novel genetic loci and liver or metabolic-related traits (columns) in n=397,780 UKBB participants after excluding individuals with available PDFF or liver iron corrected T1 (n=36,748). Upper and lower boxes correspond to liver iron corrected T1 and PDFF genetic loci, respectively. Full summary statistics have been reported in Supplementary Table 10. P-values were not corrected for multiple hypothesis testing. VAT: Visceral adipose tissue; WFM: Whole-body fat mass (kg/m2); cT1: liver iron corrected T1; PDFF: proton density fat fraction; CLD: chronic liver disease.
Figure 4:
Figure 4:. The association between 6 novel loci and hepatic triglyceride content was replicated in independent cohorts.
Meta-analysis of the associations between independent novel genetic loci and hepatic triglyceride content in four independent European cohorts. Proxy variants were used for variants not available in the replication cohorts (r2 > 0.4 within a window of 1.5 Mb around each lead variant in the UK Biobank) as marked with an asterisk. Pooled effect estimates were calculated using inverse-variance-weighted fixed-effect meta-analysis. Genomic loci in bold are those with a P-value < 0.05 in the fixed-effect model. Full summary statistics have been reported in the Supplementary Table 12. P-values are two-sided and not adjusted for multiple testing.
Figure 5:
Figure 5:. Association between 26 previously known and 6 novel replicated genetic loci and circulating triglycerides in the UK Biobank.
The heatmap shows the Z-score of associations for the effect (risk) allele in Europeans (n=397,780) after excluding individuals with available PDFF or liver iron corrected T1 (n=36,748). Upper and lower boxes correspond to liver iron corrected T1 and PDFF genetic loci, respectively. Novel replicated genetic loci have been marked in blue. Full summary statistics have been reported in Supplementary Table 13. P-values were not corrected for multiple hypothesis testing.
Figure 6:
Figure 6:. Polygenic risk scores (PRS) dissect a liver specific (discordant) and a cardiometabolic (concordant) subtypes of steatotic liver disease.
The case-control (A) and prospective (B) association between 2 clustered PDFF-circulating TGs PRS and liver-related, cardiometabolic, and chronic kidney failure traits in the UK Biobank. Effect plot of the association between concordant and discordant PDFF-circulating TGs PRS with each disease was tested using either logistic (A) or Cox proportional hazard (B) regression analysis adjusted for BMI, age, sex, agexsex, age2 and age2xsex, first 10 genomic principal components and array batch. X-axis shows either the odds ratio (OR) or hazard ratio (HR). All association analyses have been performed after excluding individuals with available PDFF. Full summary statistics have been reported in Supplementary Table 15. P-values were not corrected for multiple hypothesis testing. TG: triglyceride; PDFF: proton density fat fraction; HCC: hepatocellular carcinoma; PRS: polygenic risk scores.
Figure 7:
Figure 7:. mRNA expression of loci from the liver specific (discordant) polygenic risk score is more abundant in the liver compared to the visceral adipose tissue (VAT).
Differential expression analysis of paired liver and VAT bulk RNA-Seq data for mapped gene sets of concordant and discordant PRS. The lower right bar plot shows the fraction of upregulated differentially expressed (DE) genes in the liver compared to VAT. The enrichment of PRS clusters with upregulated DE genes in the liver was calculated using one-sided Fisher’s exact test. VAT: visceral adipose tissue; FC: fold change; FDR: false discovery rate.
Figure 8:
Figure 8:. Putative model of the two different types of MASLD.
A) In the liver specific MASLD, the primary increase in the liver triglyceride content is due to the hepatic retention of very low-density lipoproteins (VLDL). This retention is causally related to liver inflammation, fibrosis, and hepatocellular carcinoma. In this type of MASLD, the higher risk of diabetes is due to the degree of liver fibrosis, while the lower risk of cardiovascular disease (CVD) to lipoprotein retention. B) In the cardiometabolic MASLD, the liver is entwined in the crosstalk among metabolic organs. In this type of MASLD, a dysfunctional visceral adipose tissue may increase the diabetes risk and may release free fatty acids that are incorporated into triglycerides in the hepatocytes causing liver steatosis. In turn, liver steatosis causes an overproduction of VLDL with a subsequent increase in circulating low-density lipoproteins (LDL) resulting in a higher risk of CVD. Additionally, the cardiometabolic MASLD associates with an increased blood pressure resulting in kidney failure and further increasing the CVD risk. This figure was created with BioRender.com. CKD: chronic kidney disease (failure); VAT: visceral adipose tissue; LD: lipid droplets.

References

    1. Sanyal A.J., et al. Prospective Study of Outcomes in Adults with Nonalcoholic Fatty Liver Disease. NEngl JMed 385, 1559–1569 (2021). - PMC - PubMed
    1. Pais R., Redheuil A., Cluzel P., Ratziu V. & Giral P Relationship Among Fatty Liver, Specific and Multiple-Site Atherosclerosis, and 10-Year Framingham Score. Hepatology 69, 1453–1463 (2019). - PubMed
    1. Anstee Q.M., Targher G. & Day C. P Progression of NAFLD to diabetes mellitus, cardiovascular disease or cirrhosis. Nat Rev Gastroenterol Hepatol 10, 330–344 (2013). - PubMed
    1. Toh J.Z.K., et al. A Meta-Analysis on the Global Prevalence, Risk factors and Screening of Coronary Heart Disease in Nonalcoholic Fatty Liver Disease. Clin Gastroenterol Hepatol 20, 2462–2473.e2410 (2022). - PubMed
    1. Romeo S., Sanyal A. & Valenti L. Leveraging Human Genetics to Identify Potential New Treatments for Fatty Liver Disease. Cell Metab 31, 35–45 (2020). - PubMed

Publication types

LinkOut - more resources