

This is a preprint.
Controlling for polygenic genetic confounding in epidemiologic association studies
- PMID: 38405812
- PMCID: PMC10888957
- DOI: 10.1101/2024.02.12.579913
Controlling for polygenic genetic confounding in epidemiologic association studies
Update in
-
Controlling for polygenic genetic confounding in epidemiologic association studies.Proc Natl Acad Sci U S A. 2024 Oct 29;121(44):e2408715121. doi: 10.1073/pnas.2408715121. Epub 2024 Oct 21. Proc Natl Acad Sci U S A. 2024. PMID: 39432782 Free PMC article.
Abstract
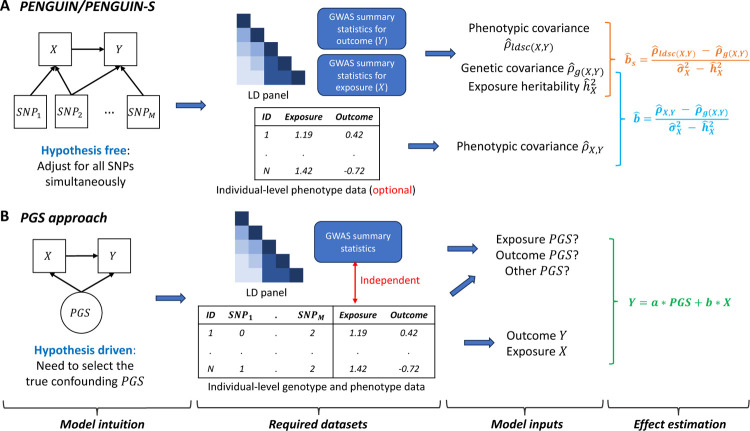
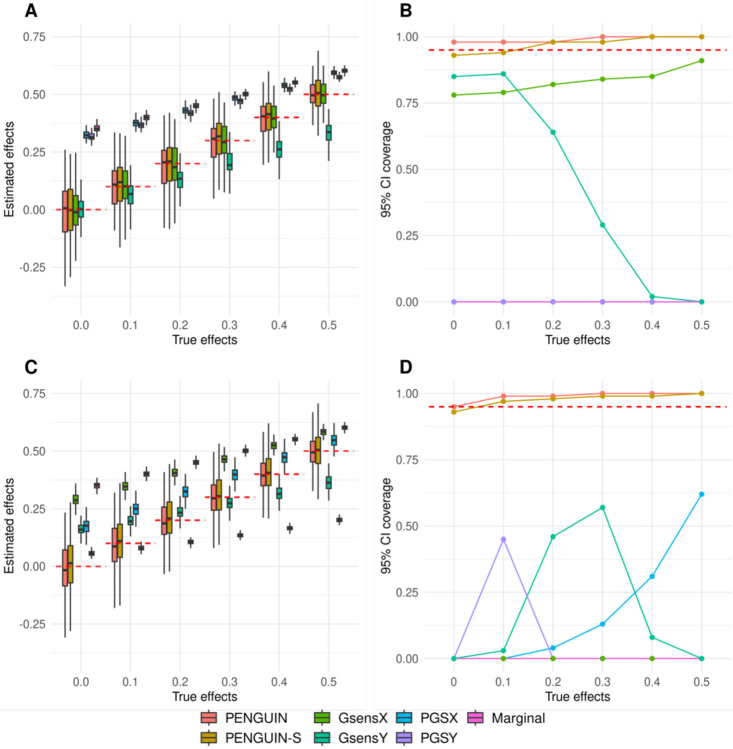
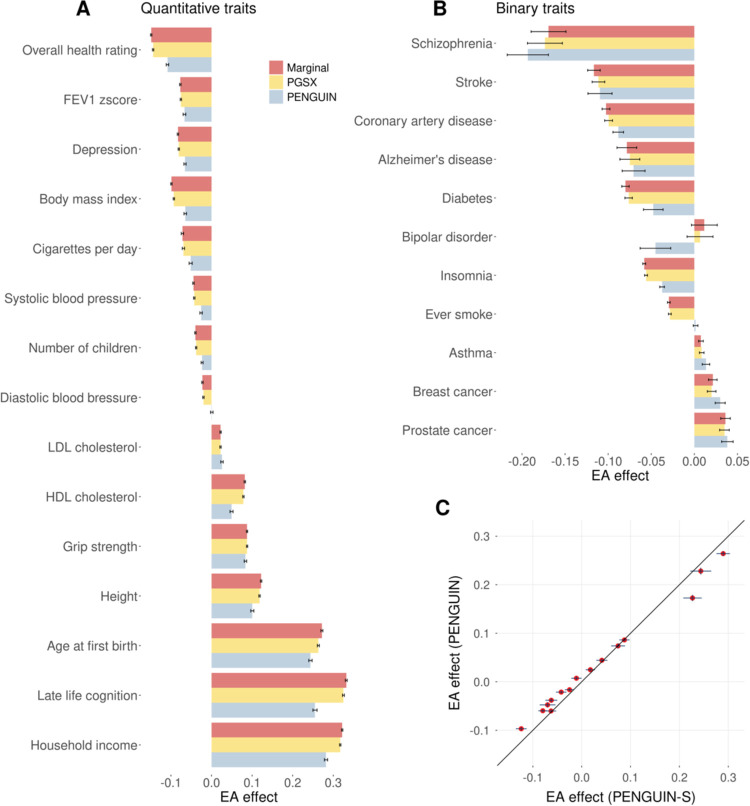
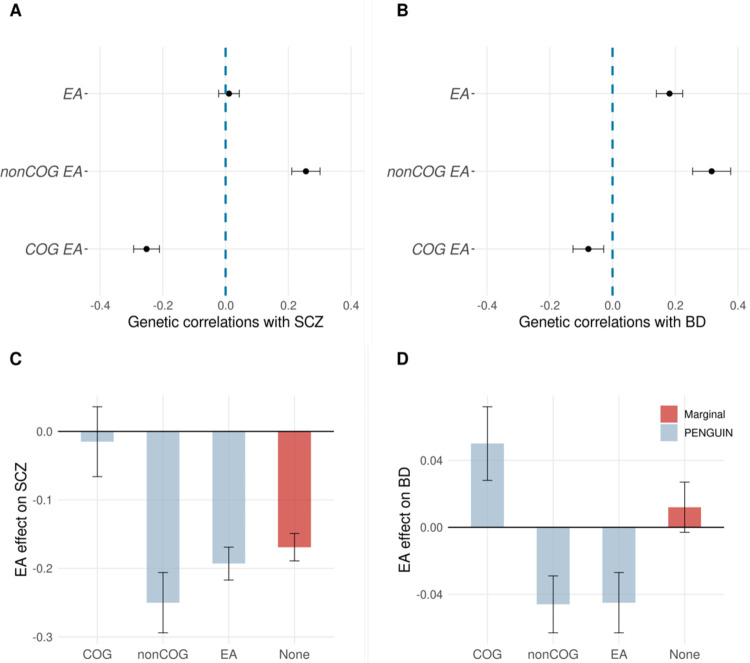
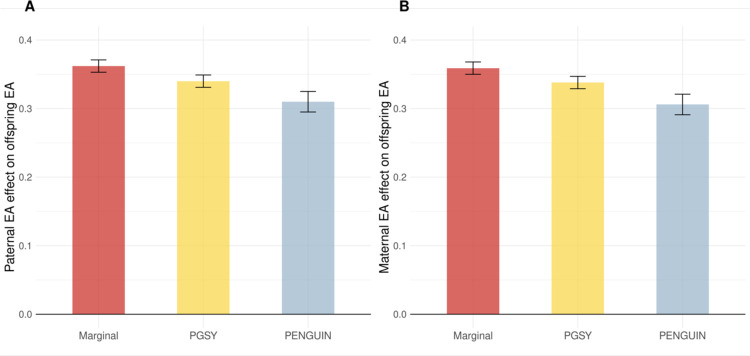
Epidemiologic associations estimated from observational data are often confounded by genetics due to pervasive pleiotropy among complex traits. Many studies either neglect genetic confounding altogether or rely on adjusting for polygenic scores (PGS) in regression analysis. In this study, we unveil that the commonly employed PGS approach is inadequate for removing genetic confounding due to measurement error and model misspecification. To tackle this challenge, we introduce PENGUIN, a principled framework for polygenic genetic confounding control based on variance component estimation. In addition, we present extensions of this approach that can estimate genetically-unconfounded associations using GWAS summary statistics alone as input and between multiple generations of study samples. Through simulations, we demonstrate superior statistical properties of PENGUIN compared to the existing approaches. Applying our method to multiple population cohorts, we reveal and remove substantial genetic confounding in the associations of educational attainment with various complex traits and between parental and offspring education. Our results show that PENGUIN is an effective solution for genetic confounding control in observational data analysis with broad applications in future epidemiologic association studies.
Conflict of interest statement
Competing interests The authors declare no competing interests.
Figures
Similar articles
-
Controlling for polygenic genetic confounding in epidemiologic association studies.Proc Natl Acad Sci U S A. 2024 Oct 29;121(44):e2408715121. doi: 10.1073/pnas.2408715121. Epub 2024 Oct 21. Proc Natl Acad Sci U S A. 2024. PMID: 39432782 Free PMC article.
-
Disentangling the influences of parental genetics on offspring's cognition, education, and psychopathology via genetic and phenotypic pathways.J Child Psychol Psychiatry. 2023 Mar;64(3):408-416. doi: 10.1111/jcpp.13708. Epub 2022 Sep 26. J Child Psychol Psychiatry. 2023. PMID: 36162806
-
Multi-polygenic prediction of frailty highlights chronic pain and educational attainment as key risk and protective factors.medRxiv [Preprint]. 2024 May 31:2024.05.31.24308260. doi: 10.1101/2024.05.31.24308260. medRxiv. 2024. PMID: 38853841 Free PMC article. Preprint.
-
Genetic prediction of complex traits with polygenic scores: a statistical review.Trends Genet. 2021 Nov;37(11):995-1011. doi: 10.1016/j.tig.2021.06.004. Epub 2021 Jul 6. Trends Genet. 2021. PMID: 34243982 Free PMC article. Review.
-
The omnigenic model and polygenic prediction of complex traits.Am J Hum Genet. 2021 Sep 2;108(9):1558-1563. doi: 10.1016/j.ajhg.2021.07.003. Epub 2021 Jul 30. Am J Hum Genet. 2021. PMID: 34331855 Free PMC article. Review.
References
-
- Wong N.D. Epidemiological studies of CHD and the evolution of preventive cardiology. Nature Reviews Cardiology 11, 276–289 (2014). - PubMed
-
- Britt K.L., Cuzick J. & Phillips K.-A. Key steps for effective breast cancer prevention. 20, 417–436 (2020). - PubMed
-
- Talmor-Barkan Y. et al. Metabolomic and microbiome profiling reveals personalized risk factors for coronary artery disease. 28, 295–302 (2022). - PubMed
-
- Barnes J.C., Boutwell B.B., Beaver K.M., Gibson C.L. & Wright J.P. On the consequences of ignoring genetic influences in criminological research. Journal of Criminal Justice 42, 471–482 (2014).
-
- D’Onofrio B.M., Sjölander A., Lahey B.B., Lichtenstein P. & Öberg A.S. Accounting for Confounding in Observational Studies. Annual Review of Clinical Psychology 16, 25–48 (2016). - PubMed
Publication types
Grants and funding
LinkOut - more resources
Full Text Sources