[Preprint]. 2024 Feb 6:rs.3.rs-3874821.
doi: 10.21203/rs.3.rs-3874821/v1.

Metformin reduces the clonal fitness of Dnmt3a R878H hematopoietic stem and progenitor cells by reversing their aberrant metabolic and epigenetic state

Affiliations

Metformin reduces the clonal fitness of Dnmt3a R878H hematopoietic stem and progenitor cells by reversing their aberrant metabolic and epigenetic state

Mohsen Hosseini et al. Res Sq. .

Update in

  • Metformin reduces the competitive advantage of Dnmt3aR878H HSPCs.
    Hosseini M, Voisin V, Chegini A, Varesi A, Cathelin S, Ayyathan DM, Liu ACH, Yang Y, Wang V, Maher A, Grignano E, Reisz JA, D'Alessandro A, Young K, Wu Y, Fiumara M, Ferrari S, Naldini L, Gaiti F, Pai S, Egan G, Schimmer AD, Bader GD, Dick JE, Xie SZ, Trowbridge JJ, Chan SM. Hosseini M, et al. Nature. 2025 Jun;642(8067):421-430. doi: 10.1038/s41586-025-08871-w. Epub 2025 Apr 16. Nature. 2025. PMID: 40240595

Abstract

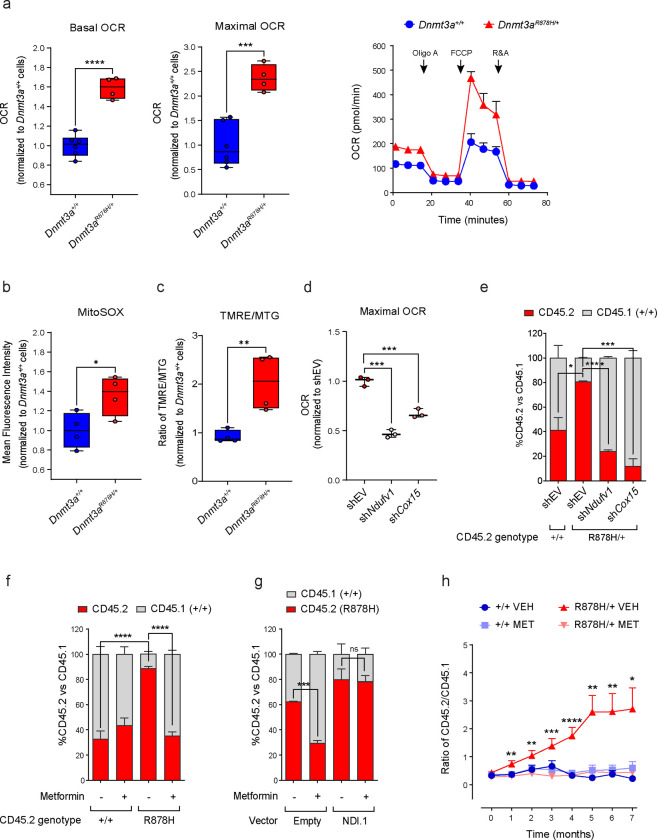
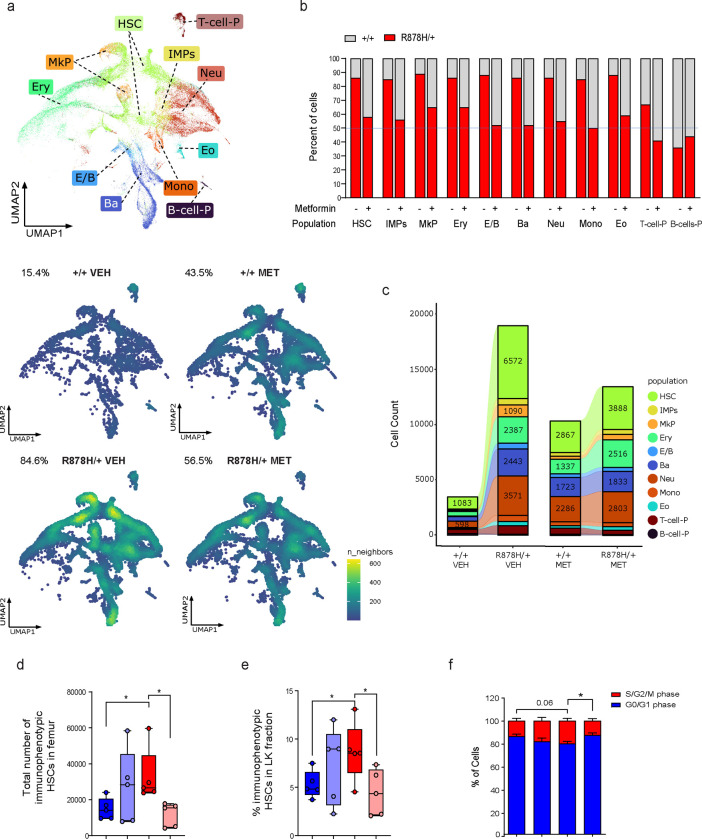
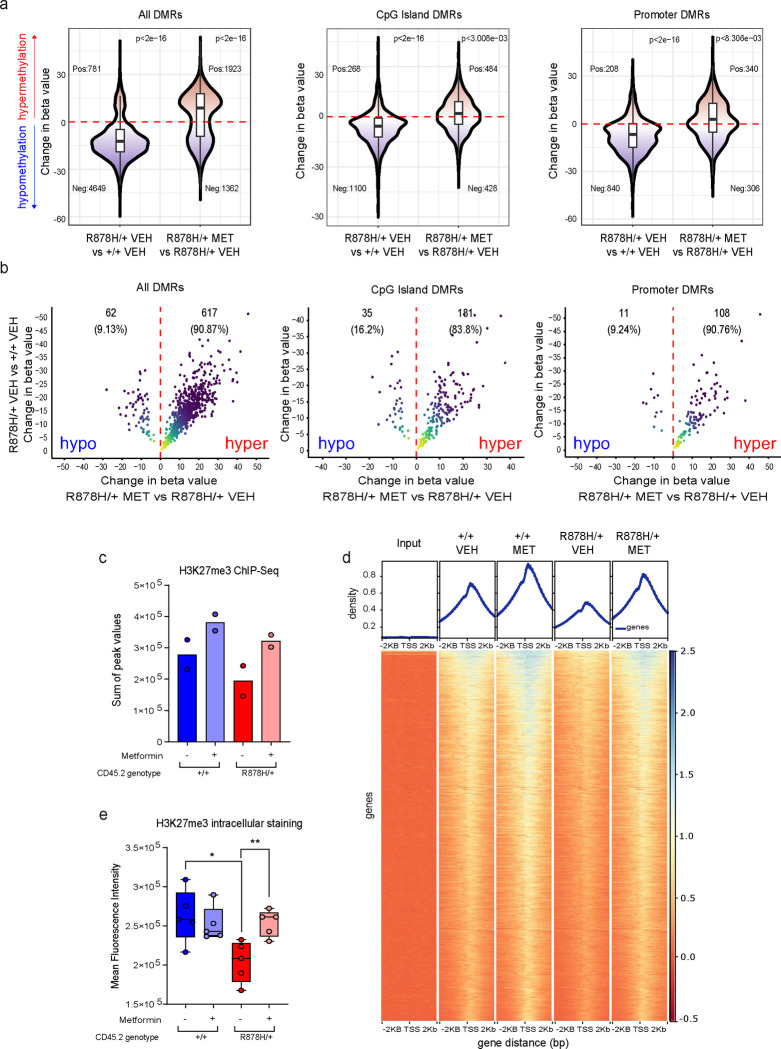
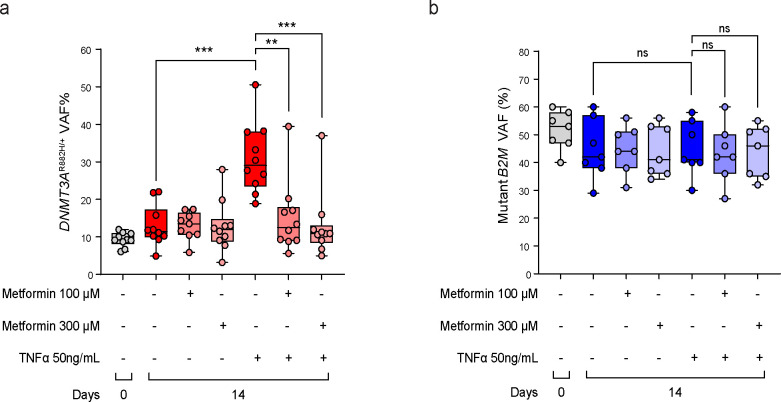
Clonal hematopoiesis (CH) arises when a hematopoietic stem cell (HSC) acquires a mutation that confers a competitive advantage over wild-type (WT) HSCs, resulting in its clonal expansion. Individuals with CH are at an increased risk of developing hematologic neoplasms and a range of age-related inflammatory illnesses1-3. Therapeutic interventions that suppress the expansion of mutant HSCs have the potential to prevent these CH-related illnesses; however, such interventions have not yet been identified. The most common CH driver mutations are in the DNA methyltransferase 3 alpha (DNMT3A) gene with arginine 882 (R882) being a mutation hotspot. Here we show that murine hematopoietic stem and progenitor cells (HSPCs) carrying the Dnmt3a R878H/+ mutation, which is equivalent to human DNMT3A R882H/+, have increased mitochondrial respiration compared with WT cells and are dependent on this metabolic reprogramming for their competitive advantage. Importantly, treatment with metformin, an oral anti-diabetic drug with inhibitory activity against complex I in the electron transport chain (ETC), reduced the fitness of Dnmt3a R878H/+ HSCs. Through a multi-omics approach, we discovered that metformin acts by enhancing the methylation potential in Dnmt3a R878H/+ HSPCs and reversing their aberrant DNA CpG methylation and histone H3K27 trimethylation (H3K27me3) profiles. Metformin also reduced the fitness of human DNMT3A R882H HSPCs generated by prime editing. Our findings provide preclinical rationale for investigating metformin as a preventive intervention against illnesses associated with DNMT3A R882 mutation-driven CH in humans.


Conflict of interest statement

Conflicts of Interest S.M.C. has received research funding from the Centre for Oncology and Immunology in Hong Kong, Celgene/BMS, AbbVie Pharmaceuticals, Agios Pharmaceuticals, and Servier Laboratories. F.G. serves as a consultant for S2 Genomics Inc. A.D.S. has received research funding from Takeda Pharmaceuticals, BMS and Medivir AB, and consulting fees/honorarium from Takeda, Novartis, Jazz, and Otsuka Pharmaceuticals. A.D.S. is named on a patent application for the use of DNT cells to treat AML. A.D.S. is a member of the Medical and Scientific Advisory Board of the Leukemia and Lymphoma Society of Canada. A.D.S. holds the Ronald N. Buick Chair in Oncology Research. J.E.D. has received research funding from Celgene/BMS, and has patents licensed to Trillium Therapeutics/Pfizer.

Figures

Fig. 1 |
Fig. 1 |. Dnmt3aR878H/+ HSPCs have increased mitochondrial respiration compared with Dnmt3a+/+ cells and are dependent on this metabolic reprogramming for their competitive advantage.
a, Left panels, basal and maximal oxygen consumption rates (OCRs) in Dnmt3a+/+ and Dnmt3aR878H/+ LK HSPCs. Dots represent technical replicates. Right panel, OCRs of LK cells of the indicated genotype at baseline and at different time points following treatment with oligomycin A (Oligo A), FCCP, and rotenone plus antimycin A (R&A). n=4–6 technical replicates for each data point. Representative data of three independent experiments are shown. b, Mean fluorescence intensity of MitoSOX staining in Dnmt3a+/+ and Dnmt3aR878H/+ LK HSPCs. Dots represent samples from individual mice. c, Ratio of TMRE to MitoTracker Green (MTG) staining in Dnmt3a+/+ and Dnmt3aR878H/+ LK HSPCs. Dots represent samples from individual mice. d, Maximal OCR in Dnmt3aR878H/+ LK HSPCs transduced with an empty shRNA vector control (shEV) or a shRNA vector expressing shNdufv1 or shCox15. Dots represent technical replicates. e, Proportion of CD45.2+ and CD45.1+ cells in a competition assay between CD45.2+ LK cells of the indicated genotype and CD45.1+ Dnmt3a+/+ LK cells. Both populations were transduced with the indicated shRNA vectors. n=3 technical replicates. f, Proportion of CD45.2+ and CD45.1+ cells in a competition assay between CD45.2+ LK cells of the indicated genotype and CD45.1+ Dnmt3a+/+ LK cells in the absence or presence of metformin at 50μM. n=3 technical replicates. Representative data of three independent experiments are shown. g, Proportion of CD45.2+ and CD45.1+ cells in a competition assay between CD45.2+ Dnmt3aR878H/+ LK cells and CD45.1+ Dnmt3a+/+ LK cells in the presence or absence of metformin at 50μM. The CD45.2+ Dnmt3aR878H/+ LK cells were transduced with an empty or NDI.1 overexpressing lentiviral vector. n=3 technical replicates. h, Ratio of CD45.2+ to CD45.1+ in peripheral blood cells collected from recipient mice at the indicated time points after starting treatment with metformin in the drinking water at 5g/L (MET) or no treatment (VEH). The mice were transplanted with CD45.1+ Dnmt3a+/+ bone marrow cells and CD45.2+ bone marrow cells of the indicated genotype 5 weeks prior to starting drug treatment. For months 0–4, data are from 3 independent experiments consisting of a total of 21–23 animals per condition. For months 5–7, data are from 1 experiment consisting of 6–7 animals per condition. Statistical significance was calculated in comparison with the untreated (VEH) arm of each genotype. In a (left panels), b, c, d, the box represents the interquartile range with the median indicated by the line inside the box. Whiskers extend to the minimum and maximum values. In a (right panel), e, f, g, h, data shown are mean ± SEM. Statistical significance (P values) was calculated using two-sided Student’s t-test with * P<0.05, ** P<0.01, *** P< 0.001, and *** P<0.0001. ns, not significant.
Fig. 2 |
Fig. 2 |. Metformin suppresses the competitive advantage of Dnmt3aR878H/+ HSCs.
a, Top, dimensionality reduction using Uniform Manifold Approximation and Projection (UMAP) on all sequenced cells (n=46,225 cells). HSC = Hematopoietic stem cell; IMP = Immature myeloid progenitor; Mono = Monocyte progenitor, Neu = Neutrophil/granulocyte progenitor; E/B = Erythroid/basophil progenitor; Ery = Erythroid progenitor; MkP = Megakaryocyte progenitor; Ba = Basophil progenitor; Eo = Eosinophil progenitor; B-cell-P = B cell progenitor; T-cell-P = T cell progenitor. Bottom, UMAP cell density plots of CD45.1+ Dnmt3a+/+ cells vs. CD45.2+ Dnmt3aR878H/+ cells in LK-enriched BM samples collected from mice treated with vehicle (VEH) or metformin (MET). b, Proportion of CD45.1+ Dnmt3a+/+ cells vs. CD45.2+ Dnmt3aR878H/+ cells in each HSPC subset from untreated and metformin-treated LK samples. c, Sankey diagrams showing the absolute number of sequenced cells in each HSPC subset among CD45.1+ Dnmt3a+/+ vs. CD45.2+ Dnmt3aR878H/+ fractions in LK-enriched BM samples collected from mice treated with vehicle (VEH) or metformin (MET). d, Number of immunophenotypic HSCs (Lin, c-Kit+, Sca-1+, CD150+, CD48) in the right femur from mice transplanted with WBM cells of the indicated genotype and treated with or without metformin for 1 month. Dots represent samples from individual mice. e, Proportion of immunophenotypic HSCs in the LK fraction collected from mice transplanted with WBM cells of the indicated genotype and treated with or without metformin for 1 month. Dots represent samples from individual mice. f, Proportion of immunophenotypic HSCs in S/G2/M phase versus G0/G1 phase. Cells were collected from mice transplanted with WBM cells of the indicated genotype and treated with or without metformin for 1 month. n=5 mice per condition. In d, e, the box represents the interquartile range with the median indicated by the line inside the box. Whiskers extend to the minimum and maximum values. In f, data shown are mean ± SEM. Statistical significance (P values) was calculated using two-sided Student’s t-test with * P<0.05, ** P<0.01, *** P< 0.001, and *** P<0.0001.
Fig. 3 |
Fig. 3 |. Metformin suppresses the fitness of Dnmt3aR878H/+ HSPCs by enhancing their methylation potential.
a, Schematic diagram of the metabolic pathways involved in 1C metabolism. b, Levels of the indicated metabolites in LK cells isolated from mice transplanted with BM cells of the indicated genotype. The animals were either left untreated or treated with metformin for 1 month. Dots represent samples from individual mice. c, Levels of SAM and SAH and the ratio of [SAM]:[SAH] in LK cells isolated from mice transplanted with BM cells of the indicated genotype. The animals were either left untreated or treated with metformin for 1 month. Dots represent samples from individual mice. d, Gene set enrichment plot of bulk RNA-seq data comparing metformin-treated Dnmt3aR878H/+ LK cells (n=2 biological replicates) versus vehicle-treated Dnmt3aR878H/+ LK cells (n=2 biological replicates) using the indicated gene set (GO:0006730). e, Expression level of the indicated genes by RT-qPCR in LK cells isolated from mice transplanted with BM cells of the indicated genotype. The animals were either left untreated or treated with metformin for 1 month. Dots represent samples from individual mice. f, Proportion of CD45.2+ and CD45.1+ cells in a competition assay between CD45.2+ Dnmt3aR878H/+ LK cells and CD45.1+ Dnmt3a+/+ LK cells in the presence or absence of the indicated compounds. n=4 technical replicates. Representation data of 4 independent experiments are shown. g, Proportion of CD45.2+ and CD45.1+ cells in a competition assay between CD45.2+ Dnmt3aR878H/+ LK cells and CD45.1+ Dnmt3a+/+ LK cells in the presence or absence of the indicated compounds. n=4 technical replicates. Representation data from 3 independent experiments. h, Proportion of CD45.2+ and CD45.1+ cells in a competition assay between CD45.2+ Dnmt3aR878H/+ LK cells and CD45.1+ Dnmt3a+/+ LK cells in the presence or absence of metformin. Both populations were transduced with the indicated shRNA vectors. n=3 technical replicates. Representation data of 3 independent experiments are shown. In b, c, e, the box represents the interquartile range with the median indicated by the line inside the box. Whiskers extend to the minimum and maximum values. In f, g, h, data shown are mean ± SEM. Statistical significance (P values) was calculated using two-sided Student’s t-test for all comparisons except for b where one-sided Student’s t-test was used. * P<0.05, ** P<0.01, *** P< 0.001, and *** P<0.0001. ns, not significant.
Fig. 4 |
Fig. 4 |. Metformin reverses the aberrant DNA CpG methylation and H3K27me3 profiles in Dnmt3aR878H/+ HSPCs.
a, Violin plots of the difference in beta values at all differentially-methylated regions (DMRs), CpG island-associated DMRs, or promoter-associated DMRs in the comparison between untreated Dnmt3aR878H/+ LK samples versus untreated Dnmt3a+/+ LK samples (left) and between metformin-treated Dnmt3aR878H/+ LK samples versus untreated Dnmt3aR878H/+ LK samples (right). n=3 biological replicates for untreated Dnmt3a+/+ and metformin-treated Dnmt3aR878H/+ samples. n=4 biological replicates for metformin-treated Dnmt3a+/+ and untreated Dnmt3aR878H/+ samples. The P values adjacent to the plots were calculated using the one-sample Wilcoxon signed rank test determine if the median difference in beta values was significantly different from 0. b, Plot showing the change in beta values at overlapping DMRs between metformin-treated Dnmt3aR878H/+ samples versus untreated Dnmt3aR878H/+ samples on the X-axis and between untreated Dnmt3aR878H/+ samples versus untreated Dnmt3a+/+ samples on the Y-axis. c, Sum of peak values from H3K27me3 ChIP-seq analysis of LK HSPC samples collected from mice transplanted with bone marrow cells of the indicated genotype and treated with or without metformin for 1 month. Dots represent samples from individual mice. The means of the 2 biological replicates are shown. d, Distribution of H3K27me3 signals surrounding (±2KB) the transcription start site (TSS) regions with the highest signals (n=10,622) in the indicated samples. e, Mean fluorescent intensity of H3K27me3 staining by intracellular flow cytometry of LK HSPCs collected from mice transplanted with bone marrow cells of the indicated genotype and treated with or without metformin for 1 month. Dots represent samples from individual mice. In e, the box represents the interquartile range with the median indicated by the line inside the box. Whiskers extend to the minimum and maximum values. Statistical significance (P values) was calculated using two-sided Student’s t-test with * P<0.05, ** P<0.01, *** P< 0.001, and *** P<0.0001.
Fig. 5 |
Fig. 5 |. Metformin decreases the competitive advantage of human DNMT3AR882H HSPCs.
a, DNMT3AR882H variant allele frequencies (VAFs) of prime edited human HSPCs at baseline (day 0) and after 14 days in culture in the presence or absence of TNFα or metformin. b, Mutant B2M VAFs of prime edited human HSPCs at baseline (day 0) and after 14 days in culture in the presence or absence of TNFα or metformin. Dots represent samples from individual cord blood donors. The box represents the interquartile range with the median indicated by the line inside the box. Whiskers extend to the minimum and maximum values. Statistical significance (P values) was calculated using two-sided Student’s t-test with * P<0.05, ** P<0.01, *** P< 0.001, and *** P<0.0001. ns, not significant.

References

    1. Jaiswal S. et al. Clonal Hematopoiesis and Risk of Atherosclerotic Cardiovascular Disease. N Engl J Med 377, 111–121, doi:10.1056/NEJMoa1701719 (2017). - DOI - PMC - PubMed
    1. Jaiswal S. et al. Age-related clonal hematopoiesis associated with adverse outcomes. N Engl J Med 371, 2488–2498, doi:10.1056/NEJMoa1408617 (2014). - DOI - PMC - PubMed
    1. Genovese G. et al. Clonal hematopoiesis and blood-cancer risk inferred from blood DNA sequence. N Engl J Med 371, 2477–2487, doi:10.1056/NEJMoa1409405 (2014). - DOI - PMC - PubMed
    1. Bick A. G. et al. Inherited causes of clonal haematopoiesis in 97,691 whole genomes. Nature 586, 763–768, doi:10.1038/s41586-020-2819-2 (2020). - DOI - PMC - PubMed
    1. Buscarlet M. et al. DNMT3A and TET2 dominate clonal hematopoiesis and demonstrate benign phenotypes and different genetic predispositions. Blood 130, 753–762, doi:10.1182/blood-2017-04-777029 (2017). - DOI - PubMed

Publication types