[Preprint]. 2024 Feb 17:2024.02.16.580760.
doi: 10.1101/2024.02.16.580760.

Deciphering the History of ERK Activity from Fixed-Cell Immunofluorescence Measurements

Affiliations

Deciphering the History of ERK Activity from Fixed-Cell Immunofluorescence Measurements

Abhineet Ram et al. bioRxiv. .

Update in

Abstract

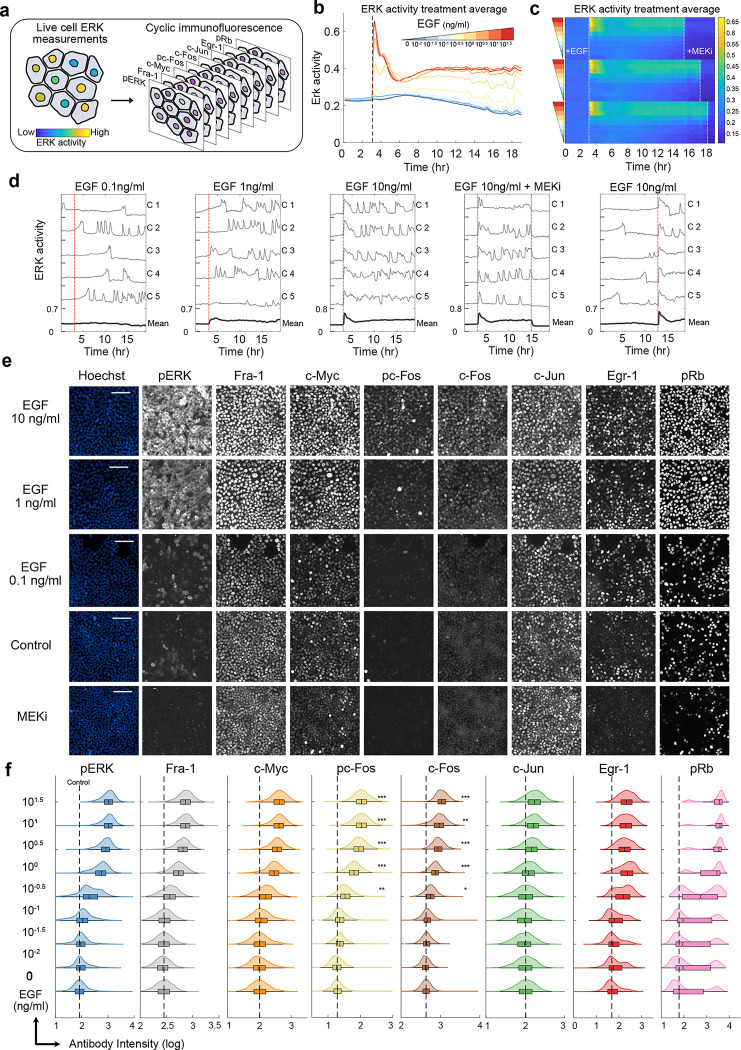
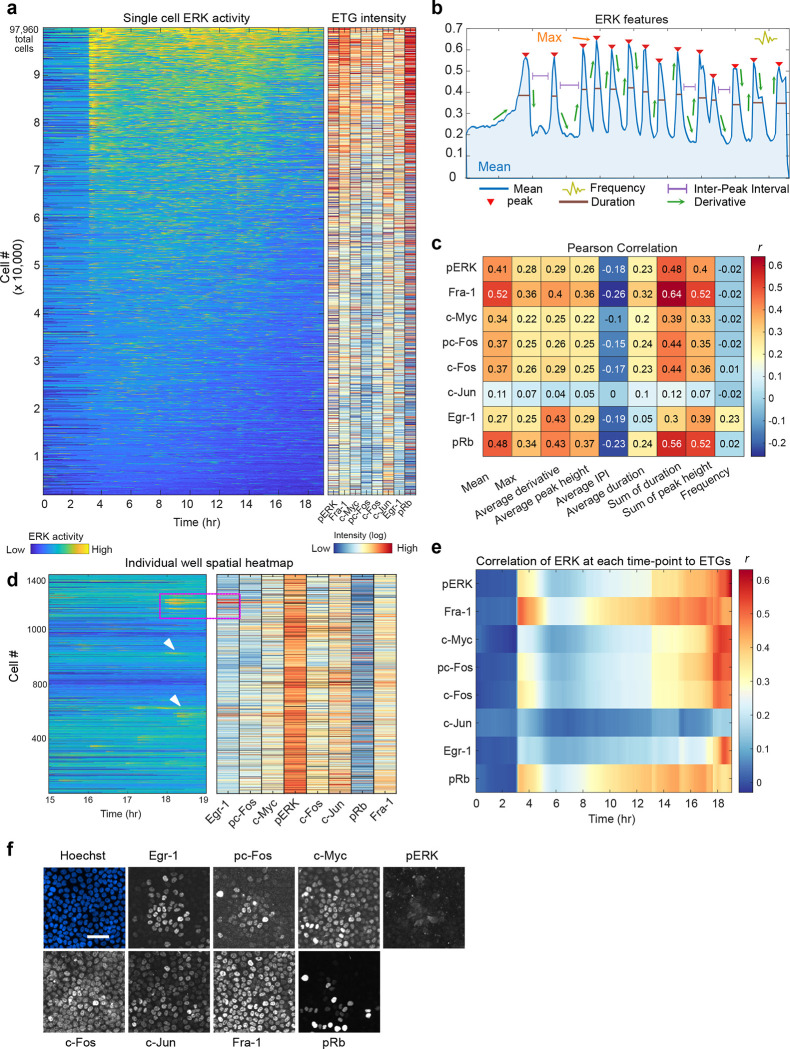
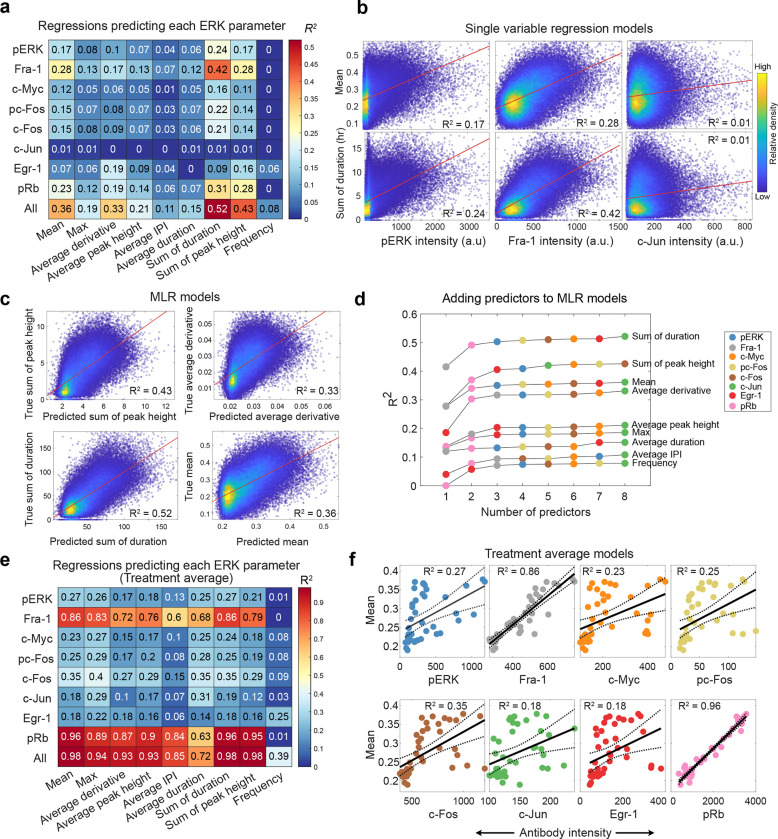
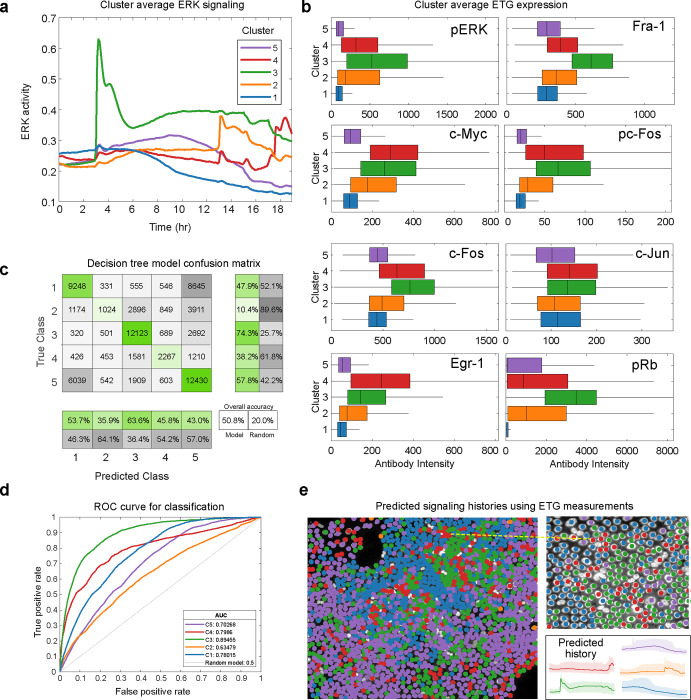
The Ras/ERK pathway drives cell proliferation and other oncogenic behaviors, and quantifying its activity in situ is of high interest in cancer diagnosis and therapy. Pathway activation is often assayed by measuring phosphorylated ERK. However, this form of measurement overlooks dynamic aspects of signaling that can only be observed over time. In this study, we combine a live, single-cell ERK biosensor approach with multiplexed immunofluorescence staining of downstream target proteins to ask how well immunostaining captures the dynamic history of ERK activity. Combining linear regression, machine learning, and differential equation models, we develop an interpretive framework for immunostains, in which Fra-1 and pRb levels imply long term activation of ERK signaling, while Egr-1 and c-Myc indicate recent activation. We show that this framework can distinguish different classes of ERK dynamics within a heterogeneous population, providing a tool for annotating ERK dynamics within fixed tissues.


Conflict of interest statement

Conflict of Interest John Albeck has received research grants from Kirin Corporation.

Figures

Figure 1:
Figure 1:. ERK activity and target genes are dose-responsive to Epidermal Growth Factor.
a Schematic of the experimental method. Live cells were imaged in 96-well plates for 19 hours and immediately fixed. Plates were subsequently stained for antibody-based measurements. b Treatment average response measurements for live-cell ERK biosensor (EKAR) with increasing concentrations of EGF. Data are presented as the mean of each treatment (nwell replicates = 9–11 for each dose of EGF, 21 for control). c Treatment average response measurements depicted as a heatmap. Each row is the treatment average EKAR measurement (FRET measurements are indicated by color). EGF concentration indicated by colored triangles from Fig. 1b. MEKi = MEK inhibitor PD0325901 (100nM) (nwell replicates = 2–4 for each treatment). d Single-cell response plots to indicated treatment. Bold line indicates the average of all cells in one well of the treatment. e MCF10A cells immuno-stained with cyclic immunofluorescence. Each row depicts the same group of cells. Scale bar = 100 um. f Quantification of cyclic immunofluorescence measurements from listed EGF treatment. Dashed line indicates median of vehicle control condition (0 ng/ml EGF). Variance corrected t-tests were conducted by comparing each EGF treated condition to vehicle control nreplicates = 3. * p-val < 0.05, ** p-val < 0.005, *** p-val < 0.0005.
Figure 2:
Figure 2:. ERK target gene expression moderately correlates with features of ERK dynamics.
a Single-cell heatmap for EKAR FRET measurements and corresponding ETG intensity, each row represents one cell (ncells = 97,960, nreplicates = 3). ETG expression colored by log of antibody intensity from immunofluorescence measurements. b Features of ERK dynamics analyzed. Frequency was also calculated by estimating the mean normalized frequency of the power spectrum of the EKAR FRET measurement time series for each cell. c Pearson correlation (r) between each ERK feature and each cyclic immunofluorescence measurement, where single-cell values were used. d Spatial heatmap of EKAR (left) and ETG (right) measurements from a single well (control condition). Heatmap is organized by proximity of cells to each other so that neighboring cells in the well are plotted closer to each other in the heatmap. ETG colormap indicates relative log intensity of data within each column; outliers in pERK column skew colormap towards red. (black = NA). Magenta box indicates cells in Fig. 2f. White arrows indicate cells that recently activated ERK which resulted in higher Egr-1 expression (right). e Pearson correlation (r) between single-cell ETG measurements and the EKAR FRET measurement at each timepoint from the live-cell experiment. f Corresponding cells from magenta box in Fig. 2d. Scale bar = 50um.
Figure 3:
Figure 3:. ERK target gene expression predicts history of ERK activation
a Single-cell regression showing the coefficient of determination (R2) of linear regression models which use ETGs to predict each ERK feature. 10-fold cross-validation was conducted to retrieve the best test-set model. This model was then fitted on the full dataset. b Scatter plots of single-cell regression models showing line of best fit. Color indicates relative density of the data. c Scatter plot showing each cell’s predicted (x-axis) vs true (y-axis) value in the multiple linear regression (MLR) models. d Results of adding predictors to MLR models. Color of each point indicates which predictor was added at each step. e Average values were calculated for all cells with the same treatment. These values were then used to fit regression models that predict each ERK feature using ETGs. f Scatter plots showing line of best fit and confidence intervals for treatment average regression models.
Figure 4:
Figure 4:. Convolutional neural network identifies non-linear signal transmission.
a For each ETG, three types of prediction models were separately trained. Top: Simplified schematic of convolutional neural network architecture containing two convolutional layers and three fully connected layers. Bottom left: Multiple variable regression where ERK activity at each time point is considered as a predictor variable (TS linear). Bottom right: Multiple variable linear regression where nine features of ERK activity are considered as predictor variables (Featurized linear). b Top: Bar plot indicating R2 for three models used to predict ETG levels. Bottom: Bar plot indicating mean square error for three models used to predict ETG levels. Error bars represent standard error calculated using values from each fold of the 5-fold cross-validation partitions. c Scatter plot of the predicted and observed values of the CNN trained on all 190 timepoints (19 hr). The data represent standardized (z-scored) values. d Feature attribution heatmap showing the importance of each timepoint in the CNN model trained on 150 timepoints (15 hr). Color map represents relative values within each row.
Figure 5:
Figure 5:. Annotating spatiotemporal ERK patterns in images using Decision Tree model.
a Average ERK activity in each cluster identified by k-means clustering of EKAR time series data. Cells per cluster: C119325, C29989, C316325, C46244, C521523. b Box plot showing median, quartiles, and range of ETG intensity in each cluster. c Confusion matrix showing the amount of accurate (green) and mis-classified (gray) cells in each class. Decision tree leaf size was optimized by cross-validation and collecting the leaf size with the minimum test-set error (129). d Receiver operating characteristic curves for each class in the decision tree model. e MCF10A cell stained with Hoechst (gray) overlayed with predicted signaling histories. Dark lines indicate the mean ERK activity for each cluster (as in Fig. 5a), and shaded regions indicate 25th and 75th percentiles.
Figure 6:
Figure 6:. Mathematical model identifies limits of ERK activity prediction method.
a Ordinary differential equation model representing ERK-dependent modification of a transcription factor (TF), expression of mRNA, and expression of a protein (P) product. Superscript P denotes phosphorylation of a molecule. Lowercase k’s indicate rate parameters, uppercase K indicates a dissociation constant for feedback effects. Clock icons indicate a time delay (τ). b 10,000 cells were randomly picked from our main dataset. We simulated the gene response of 1000 genes for each cell using our experimentally collected EKAR measurements. c 1000 simulated genes (sim-ETGs) were randomly assigned the listed rate parameters while other rate parameters in the model remained constant. d Coefficient of determination (R2) of single variable linear regression models using each sim-ETG to predict the average ERK activity in each cell. e Pearson correlation (r) between each sim-ETG (rows) measurement and the EKAR values at each timepoint from the live-cell experiment. f Top: one ERK activity trace from one cell in the dataset. Rest: gene expression response of the top 5 predictors of the mean ERK activity. g Multiple regression models fit to predict each ERK feature. For each ERK feature prediction model, a single sim-ETG was added as a predictor at each step. To determine the order of sim-ETGs to add, we performed single regression and ranked sim-ETG by their ability to individually predict each feature.

References

    1. Aikin T. J., Peterson A. F., Pokrass M. J., Clark H. R., & Regot S. (2020). MAPK activity dynamics regulate non-cell autonomous effects of oncogene expression. eLife, 9. 10.7554/eLife.60541 - DOI - PMC - PubMed
    1. Albeck J. G., Mills G. B., & Brugge J. S. (2013). Frequency-modulated pulses of ERK activity transmit quantitative proliferation signals. Molecular Cell, 49(2), 249–261. - PMC - PubMed
    1. Bollag G., Hirth P., Tsai J., Zhang J., Ibrahim P. N., Cho H., Spevak W., Zhang C., Zhang Y., Habets G., Burton E. A., Wong B., Tsang G., West B. L., Powell B., Shellooe R., Marimuthu A., Nguyen H., Zhang K. Y. J., … Nolop K. (2010). Clinical efficacy of a RAF inhibitor needs broad target blockade in BRAF-mutant melanoma. Nature, 467(7315), 596–599. - PMC - PubMed
    1. Bugaj L. J., Sabnis A. J., Mitchell A., Garbarino J. E., Toettcher J. E., Bivona T. G., & Lim W. A. (2018). Cancer mutations and targeted drugs can disrupt dynamic signal encoding by the Ras-Erk pathway. Science, 361(6405). 10.1126/science.aao3048 - DOI - PMC - PubMed
    1. Comandante-Lou N., Baumann D. G., & Fallahi-Sichani M. (2022). AP-1 transcription factor network explains diverse patterns of cellular plasticity in melanoma cells. Cell Reports, 40(5), 111147. - PMC - PubMed

Publication types