[Preprint]. 2024 Feb 17:2024.02.16.580247.
doi: 10.1101/2024.02.16.580247.

Functional Characterisation of the ATOH1 Molecular Subtype Indicates a Pro-Metastatic Role in Small Cell Lung Cancer

Affiliations

Functional Characterisation of the ATOH1 Molecular Subtype Indicates a Pro-Metastatic Role in Small Cell Lung Cancer

Alessia Catozzi et al. bioRxiv. .

Update in

Abstract

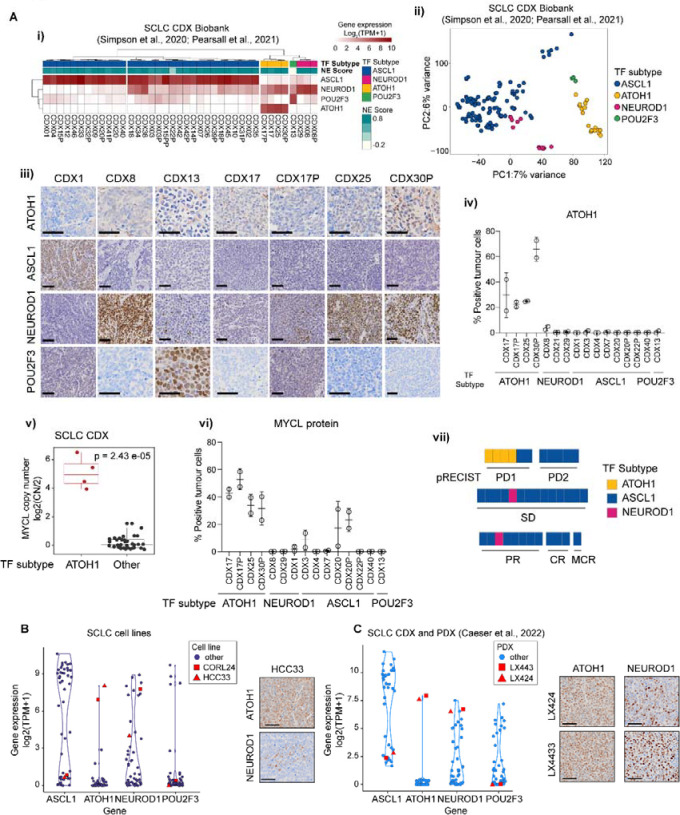
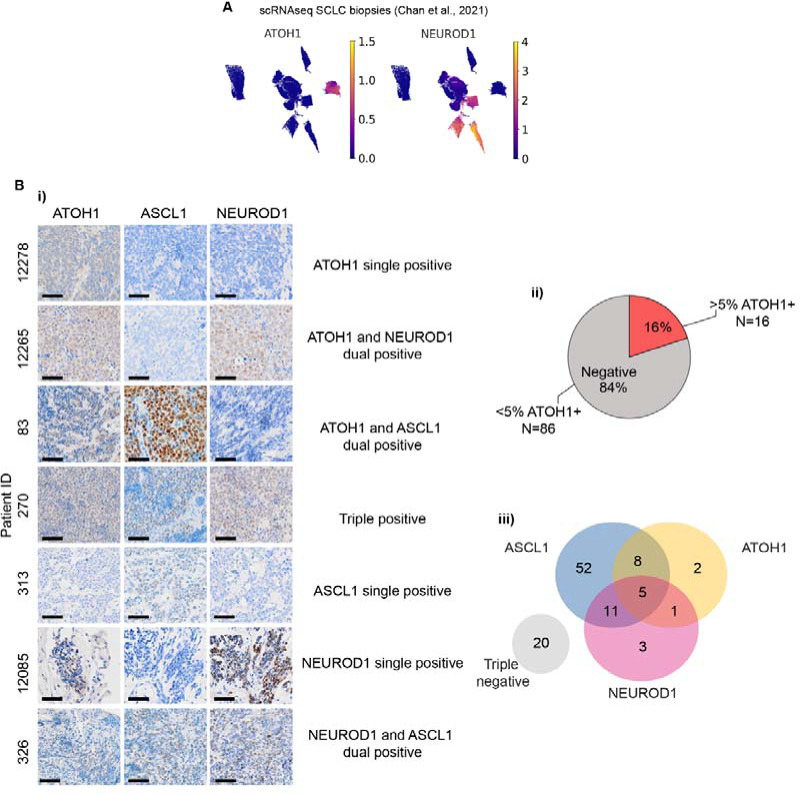
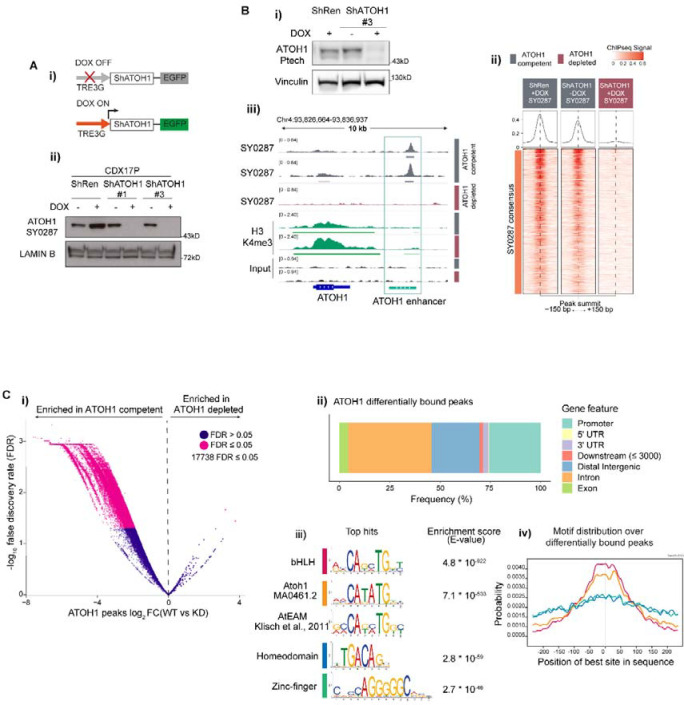
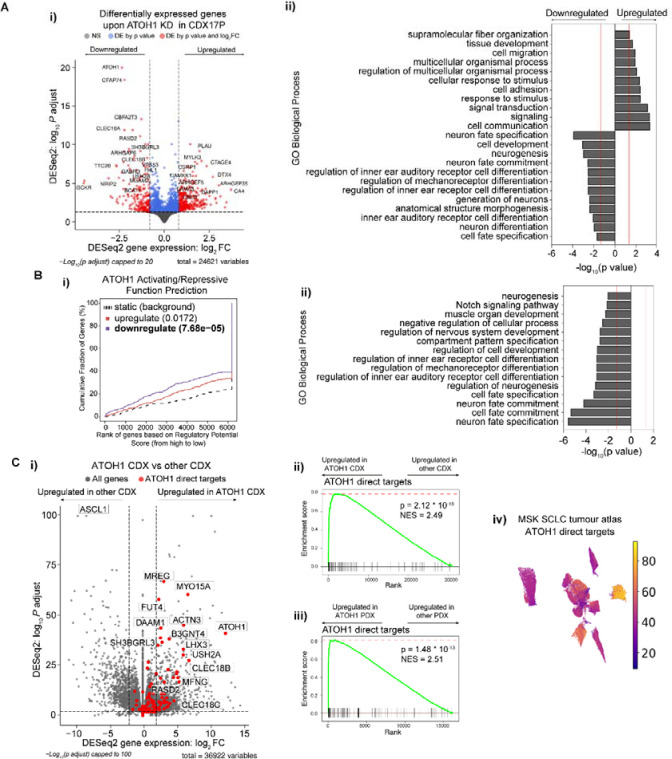
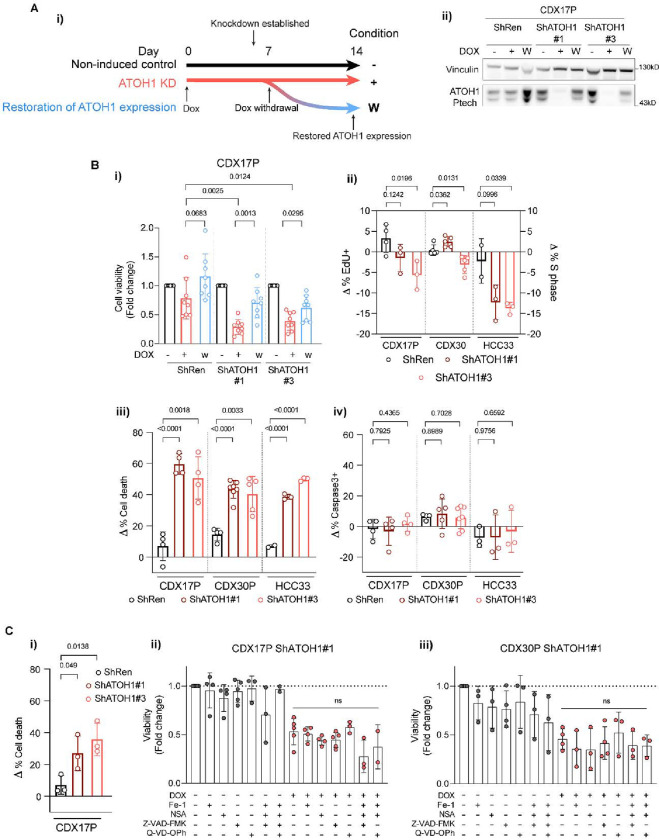
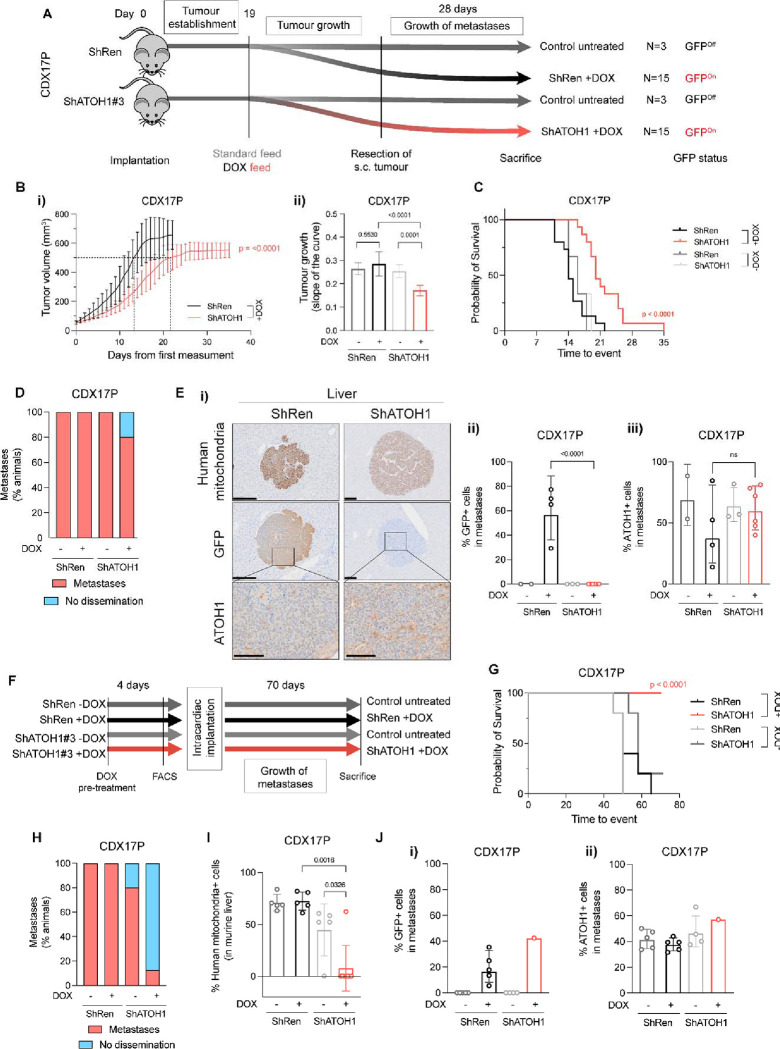
Molecular subtypes of Small Cell Lung Cancer (SCLC) have been described based on differential expression of transcription factors (TFs) ASCL1, NEUROD1, POU2F3 and immune-related genes. We previously reported an additional subtype based on expression of the neurogenic TF ATOH1 within our SCLC Circulating tumour cell-Derived eXplant (CDX) model biobank. Here we show that ATOH1 protein was detected in 7/81 preclinical models and 16/102 clinical samples of SCLC. In CDX models, ATOH1 directly regulated neurogenesis and differentiation programs consistent with roles in normal tissues. In ex vivo cultures of ATOH1-positive CDX, ATOH1 was required for cell survival. In vivo, ATOH1 depletion slowed tumour growth and suppressed liver metastasis. Our data validate ATOH1 as a bona fide oncogenic driver of SCLC with tumour cell survival and pro-metastatic functions. Further investigation to explore ATOH1 driven vulnerabilities for targeted treatment with predictive biomarkers is warranted.


Figures

Figure 1.
Figure 1.. ATOH1 is expressed in a transcriptionally distinct subset of SCLC CDX, PDX and established cell lines.
(A-i) Heatmap illustrating expression levels of ASCL1, NEUROD1, ATOH1 and POU2F3 in the SCLC CDX biobank, annotated by SCLC subtype and NE score,. Gene expression is shown as log2(TPM+1). (A-ii) Unbiased principal component analysis (PCA) of SCLC CDX in the biobank annotated by SCLC molecular subtypes. Key: blue, ASCL1; pink, NEUROD1; yellow, ATOH1; green, POU2F3. (A-iii) Representative IHC images for ATOH1, ASCL1, NEUROD1 and POU2F3 in a panel of CDX models belonging to different SCLC molecular subtypes. Scale bars: 50 μm. (A-iv) Quantification of ATOH1 expression in N=2 CDX tumours in a panel of CDX models. (A-v) Boxplot of MYCL copy number (CN), reported as CN ratio (Log2(CN/2)), in CDX grouped by molecular subtype (ATOH1 or other). Statistics reported as per Wilcoxon rank sum exact test. (A-vi) Quantification of MYCL expression by IHC in N=2 CDX tumours in a panel of CDX models belonging to different SCLC molecular subtypes (annotated below). (A-vii) Chemosensitivity scores of the SCLC CDX biobank according to pRECIST criteria, coloured by SCLC molecular subtypes. Key: yellow, ATOH1; blue, ASCL1; pink, NEUROD1. Data are reported after 1 cycle of cisplatin/etoposide treatment and as average of N>3 mice for N=29 CDX (see methods). Statistical analysis was performed with a Fisher’s exact test between ATOH1 CDX and the remaining CDX; p = 0.0049. (B-C) Violin plot representing expression of indicated NE and Non-NE TFs in SCLC established cell lines (B) and the SCLC CDX and PDX biobank (C); ATOH1-expressing HCC33, CORL24 (B) and LX424, LX443 (C) are highlighted in red. Gene expression is reported as Log2(TPM+1). Inserts are representative images of ATOH1 and NEUROD1 IHC staining for HCC33 (B) and LX424, LX443 (C).
Figure 2.
Figure 2.. ATOH1 protein is expressed in SCLC clinical samples.
(A) UMAP plots of single cell RNA-Seq (scRNA-Seq) from SCLC biopsies from the publicly available MSK SCLC Atlas reporting expression of ATOH1 (left panel) and NEUROD1 (right panel). Gene expression reported in units of log2(X + 1) where X = normalized counts. (B-i) Representative IHC images for ATOH1, ASCL1 and NEUROD1 in SCLC tissue biopsies presenting with single, dual or triple positivity (annotated). (B-ii) Pie chart illustrating the prevalence of ATOH1-positive (>5% positive tumour cells) clinical specimens (N=16/102). (B-iii) Venn diagram illustrating overlap of ASCL1, ATOH1 and NEUROD1 expression in N=102 clinical specimens as detected by IHC. Positivity determined as >1.5% positive tumour cells for ASCL1 and NEUROD1; positivity for ATOH1 determined as in B-ii.
Figure 3.
Figure 3.. High confidence ATOH1 binding sites are located at promoter and enhancer regions and are enriched for E-box motifs.
(A-i) Schematic of DOX-inducible knock-down (KD) system: without DOX, eGFP and shRNAs targeting ATOH1 (ShATOH1) or Renilla Luciferase (ShRen) are not expressed; upon induction with DOX, both eGFP and ShATOH1 or ShRen are expressed. (A-ii) (F) Nuclear fractionation validating ATOH1 KD with the in-house ATOH1 antibody SY0287 in CDX17P ShRen, ShATOH1#1 and ShATOH1#3 upon treatment with DOX for 7 days. (B-i) Western blot showing ATOH1 expression (detected with the Ptech antibody) in the samples processed for ChIP-Seq. (B-ii) Heatmap of ChIP-Seq signal for consensus peak sets SY0287 in ATOH1 competent (grey) and depleted (red) CDX17P, generated with the generateEnrichedHeatmap function within profileplyr v1.8.1. (B-iii) ATOH1 binding peaks at ATOH1 locus highlighting ATOH1 binding peaks at ATOH1 downstream enhancer (light green), which are lost upon ATOH1 depletion. In dark green, ChIP-Seq tracks for H3K4me3 at the ATOH1 locus. The peaks were visualized with the Integrated Genomics Viewer genome browser. (C-i) Volcano plot of ATOH1 differentially bound regions (by false discovery rate, FDR < 0.05) in ATOH1 competent vs ATOH1 depleted CDX17P. Significant peaks highlighted in pink (17,738). (C-ii) Relative frequency of ATOH1 differentially bound peaks in regulatory genetic regions. (C-iii) Motif enrichment analysis of ATOH1 differentially bound peaks with MEME ChIP. Mouse Atoh1 E-box-associated motif (AtEAM) reported for comparison with Atoh1 DNA binding motif and bHLH motif. (C-iv) Centrimo analysis of the location of enriched motifs in ATOH1 differentially bound peaks.
Figure 4.
Figure 4.. Identification of ATOH1 targetome and gene signature.
(A-i) Volcano plot illustrating differentially expressed (DE) genes upon ATOH1 depletion (DOX treatment for 6 days) in CDX17P. Key: grey, not significant; blue, significant by p value; red, significant by p value <0.01 and log2(fold change) >0.8 or <−0.8. Dotted lines represent the thresholds for determining significant gene expression changes (p value <0.01 and log2(fold change) >0.8 or <−0.8). The most significant DE genes are labelled. (A-ii) Bar plot illustrating the top 20 biological processes up- and downregulated upon ATOH1 KD in CDX17P. Analysis was performed with gProfiler2. (B-i) Prediction of ATOH1 transcriptional function after integration of ChIP-Seq and RNA-Seq with BETA. ATOH1 KD results in downregulation of genes with ATOH1 binding sites identified in ChIP-Seq (p = 7.68 * 10−5) and is predicted to have a function in promoting transcription. (B-ii) Bar plot illustrating biological processes (performed with gProfiler2) associated with ATOH1 target genes identified in B-i. (C-i) Volcano plot illustrating genes enriched in ATOH1 CDX (N=4) compared to the whole CDX biobank (N=35). ATOH1 gene signature (i.e. ATOH1 target genes) highlighted in red. Dotted lines represent the thresholds for determining significant gene expression changes (p value <0.01 and log2(fold change) >2 or <−2). (C-ii) Gene set enrichment analysis (GSEA) for ATOH1 direct targets in ATOH1 CDX (N=4) vs the rest of the biobank (N=35). NES: normalised enrichment score. (C-iii) GSEA for ATOH1 direct targets in ATOH1 PDX (N=2) vs the rest of the MSK PDX biobank (N=40). GSEA analysis was performed with Fgsea. (C-iv) UMAP of cumulative expression of ATOH1 direct targets in scRNA-Seq of SCLC tumour biopsies. Expression of ATOH1 target genes is highest in the only ATOH1-expressing tumour (identified in Figure 2A).
Figure 5.
Figure 5.. ATOH1 is necessary for SCLC cell survival in vitro.
(A-i) Schematic of induction of ATOH1 KD. ATOH1 KD was established after 7 days induction with 1 μg/ml doxycycline (DOX). Cells were cultured for a total of 14 days with DOX (red line, +) or without DOX as controls; after the initial 7 days induction with DOX, a part of cells was plated without DOX to restore ATOH1 expression (blue line, W). Untreated parental cells served as additional control (black line, −). (A-ii) Western blot validation of ATOH1 depletion and restoration in the conditions specified in A-i. ShRen treated with DOX for 14 days and untreated ShRen, ShATOH1#1, ShATOH1#3 and were used as control. (B-i) Relative cell viability measured with CellTiter-Glo® (Promega) upon ATOH1 KD (red) and restoration (blue) compared to un-induced controls (black). N=8 independent experiments. (B-ii) Flow cytometry quantification of cell cycle progression by EdU (CDX17P, HCC33) and PI incorporation (CDX30P). Data was normalised to DOX-untreated parental controls by subtracting the proportion of cells in S phase in untreated cells to that of DOX-treated cells (Δ % S phase = % S phaseDOX-treated − % S phaseuntreated); ShATOH1 conditions were then compared to ShRen controls. CDX17P, N=4 ShRen, N=3 ShATOH1#1 and #3; CDX30P, N=5; HCC33, N=2 ShRen, N=3 ShATOH1#1 and #3 independent experiments. (B-iii) Flow cytometry quantification of cell death after 14 days induction with DOX of ATOH1 KD, normalised as in B-ii. Total cell death is reported as sum of apoptotic and necrotic cells. CDX17P: N=4; CDX30P: N=4 ShRen, N=7 ShATOH1#1, N=5 ShATOH1#3; HCC33: N=2 ShRen, N=3 ShATOH1#1 and #3 independent experiments. (B-iv) Same as B-iii, reporting total Caspase-3 positive cells. All statistics in panel B are reported as two-tailed unpaired t tests across indicated conditions. C-i) Flow cytometry quantification of cell death (as defined in B-iii) after 7 days DOX-induction of ATOH1 KD in CDX17P. N=3 independent experiments. P values are reported in panel B and C-i as per two-tailed unpaired t test. (C-ii, C-iii) ShATOH1#1 CDX17P (C-ii) and CDX30P (C-iii) cells were treated with (red) or without (black) DOX and with or without ferrostatin-1 (1μM), necrosulfonamide (NSA, 100 nM) or Z-VAD-FMK/Q-VD-OPh (20μM) and indicated combinations for 7 days. Cell viability was measured with CellTiter-Glo®, normalized to vehicle treated, DOX-untreated cells and reported as fold change. Statistics in C-ii and C-iii are reported as per one-way ANOVA test with Dunnett’s test correction for multiple comparisons between DOX-treated conditions with and without programmed cell death inhibitors. Data are shown as mean ± SD.
Figure 6.
Figure 6.. ATOH1 depletion decreases tumour growth kinetics and metastasis in vivo.
(A) In vivo study design to investigate subcutaneous (s.c.) tumour growth and metastasis after s.c. tumour resection. CDX17P ShRen and ShATOH1#3 (ShATOH1) were injected s.c. in NSG mice and left for 19 days to allow for tumour establishment. After 19 days, mice were fed either standard diet (control arms, N=3) or DOX-supplemented feed (experimental arms, N=15) and s.c. tumour growth was assessed. S.c. tumours were surgically resected when at 500–800 mm3 to allow for metastatic dissemination and mice were kept on study for 28 days or until s.c. tumour reached maximum size, whichever came first. (B-i) S.c. tumour growth curves, from day of first tumour measurement to s.c. tumour resection (see methods), of mice implanted with ShRen and ShATOH1 and fed DOX-supplemented diet. Key: black, ShRen fed DOX-diet; red, ShATOH1#3 fed DOX-diet. N=15 mice per cohort; data reported as mean ± SD. Dotted lines indicate when tumours from each cohort reached 500 mm3: ShRen, 14 ± 3 days; ShATOH1, 21 ± 5 days. (B-ii) Quantification of the slope of tumour growth curves in B. Key: same as in B; shades of grey for control cohort fed standard diet for the duration of the study. P values were calculated with ANCOVA test and slope of the curve was reported as mean ± SD for each cohort. (C) Kaplan-Meier curve of time to surgical resection of s.c. tumour or maximum 800 mm3 for inoperable tumours. Control arms, fed a standard diet, reported in scales of grey. P values were calculated with Log-rank Mantel-Cox test. (D) Quantification of metastatic dissemination to the liver in N=3 mice fed standard diet, N=5 ShRen- and N=15 ShATOH1-tumour bearing mice fed DOX-diet that underwent surgical resection of s.c. tumour and survived on study for at least 22 days after resection. Data is shown as percentage of animals displaying metastatic dissemination (disseminated tumour cells and micro/macro-metastases, in red) or no metastatic dissemination in the liver (blue). Metastases were identified based on human mitochondria staining. (E-i) Representative images of human mitochondria, GFP and ATOH1 IHC staining in liver from ShRen DOX-fed and ShATOH1#3 DOX-fed cohort. Scale bars: 200 μm for human mitochondria and GFP; 100 μm for ATOH1. (E-ii, E-iii) Quantification of GFP (E-ii) and ATOH1 (E-iii) IHC staining in metastases from N=2 DOX-untreated ShRen, N=3 DOX-untreated ShATOH1#3, N=4 ShRen DOX-fed, N=6 ShATOH1#3 DOX-fed mice. Data are shown as geometric mean ± geometric SD. P values are reported as per two-tailed unpaired Mann Whitney U test. (F) In vivo study design to investigate development of metastasis following intracardiac implantation. Prior to cell implantation, ATOH1 depletion was induced by DOX treatment for 4 days in vitro, followed by sorting GFP-positive, viable cells by flow cytometry. Untreated control cells were sorted exclusively for viable cells. Animals in the DOX treatment cohorts were fed a DOX-supplemented diet 24 hours prior to implantation and they were kept on that diet until endpoint. Animals in the uninduced control groups were given a standard diet. Animals from all 4 cohorts (ShRen +/− DOX and ShATOH1 +/− DOX) were removed at the onset of symptoms (i.e., distended abdomen, detailed in methods) or after 70 days. (G) Kaplan-Meier curve of time to sacrifice. Control cohorts, fed a standard diet, reported in scales of grey. P values were calculated with Log-rank Mantel-Cox test. (H) Quantification of metastatic dissemination to the liver for each cohort. Data is shown as per Figure 6D. (I) Quantification of metastatic cells in the liver for each cohort. Metastatic cells were identified based on human mitochondria staining. Data shown as mean ± SD. P values were calculated with a two-tailed unpaired Mann Whitney U test. (J) Quantification of GFP (J-i) and ATOH1 (J-ii) IHC staining in metastases from N=5 DOX-untreated ShRen, N=5 DOX-untreated ShATOH1, N=5 ShRen DOX-fed, N=1 ShATOH1#3 DOX-fed mice. Data are shown as geometric mean ± geometric SD. No statistical test could be performed as ShATOH1 contained only one value.

References

    1. Gazdar A. F., Bunn P. A. & Minna J. D. Small-cell lung cancer: what we know, what we need to know and the path forward. Nat Rev Cancer 17, 725–737, doi:10.1038/nrc.2017.87 (2017). - DOI - PubMed
    1. Forman D. Cancer incidence in five continents: volume X. (International Agency for Research on Cancer, 2014).
    1. American Cancer Society Cancer Facts & Figures 2022. (2022).
    1. Sabari J. K., Lok B. H., Laird J. H., Poirier J. T. & Rudin C. M. Unravelling the biology of SCLC: implications for therapy. Nat Rev Clin Oncol 14, 549–561, doi:10.1038/nrclinonc.2017.71 (2017). - DOI - PMC - PubMed
    1. Bunn P. A. Jr. et al. Small Cell Lung Cancer: Can Recent Advances in Biology and Molecular Biology Be Translated into Improved Outcomes? J Thorac Oncol 11, 453–474, doi:10.1016/j.jtho.2016.01.012 (2016). - DOI - PMC - PubMed

Publication types