[Preprint]. 2025 Jan 27:2024.02.11.579844.
doi: 10.1101/2024.02.11.579844.

Integrated transcriptomic analysis of human induced pluripotent stem cell-derived osteogenic differentiation reveals a regulatory role of KLF16

Affiliations

Integrated transcriptomic analysis of human induced pluripotent stem cell-derived osteogenic differentiation reveals a regulatory role of KLF16

Ying Ru et al. bioRxiv. .

Abstract

Osteogenic differentiation is essential for bone development, metabolism, and repair; however, the underlying regulatory relationships among genes remain poorly understood. To elucidate the transcriptomic changes and identify novel regulatory genes involved in osteogenic differentiation, we differentiated mesenchymal stem cells (MSCs) derived from 20 human iPSC lines into preosteoblasts (preOBs) and osteoblasts (OBs). We then performed transcriptome profiling of MSCs, preOBs and OBs. The iPSC-derived MSCs and OBs showed similar transcriptome profiles to those of primary human MSCs and OBs, respectively. Differential gene expression analysis revealed global changes in the transcriptomes from MSCs to preOBs, and then to OBs, including the differential expression of 840 genes encoding transcription factors (TFs). TF regulatory network analysis uncovered a network comprising 451 TFs, organized into five interactive modules. Multiscale embedded gene co-expression network analysis (MEGENA) identified gene co-expression modules and key network regulators (KNRs). From these analyses, KLF16 emerged as an important TF in osteogenic differentiation. We demonstrate that overexpression of Klf16 in vitro inhibited osteogenic differentiation and mineralization, while Klf16 +/- mice exhibited increased bone mineral density, trabecular number, and cortical bone area. Our study underscores the complexity of osteogenic differentiation and identifies novel regulatory genes such as KLF16, which plays an inhibitory role in osteogenic differentiation both in vitro and in vivo.

Keywords: RNA sequencing; bone; differential gene expression; induced pluripotent stem cell; mesenchymal stem cell; network analysis; osteoblast; single-cell RNA-seq; systems biology; transcription factor.


Figures

Figure 1.
Figure 1.. Generation of healthy human iPSCs and osteogenic differentiation transcriptomic data.
(A) Flowchart of iPSC establishment, iPSC-derived MSC generation, MSC to OB differentiation (preOBs, preosteoblasts; OBs, osteoblasts), and RNA-seq data generation and analyses. (B) In vitro osteogenic differentiation of MSCs (Day 0), preOBs (Day 7), and OBs (Day 21) stained with alkaline phosphatase (ALP), alizarin red, and von Kossa. (C) Expression level of known osteogenic genes at the three osteogenic stages. Data are shown as mean ± SEM. * MSC vs preOB, # preOB vs OB, or + MSC vs OB, adjusted p value < 0.0001. (D) Principal component analysis (PCA) of RNA-seq data from our iPSC-derived MSCs and differentiated OBs as well as previously published human primary MSCs and OBs, iPSCs, and other tissues in GTEx.
igure 2.
igure 2.. Gene expression profile during osteogenic differentiation.
(A) Gene expression during osteogenic differentiation with the total number of expressed genes and percentages of expressed coding and noncoding genes (middle). Number and percentages of differentially expressed (DE) and non-differentially expressed (non-DE) coding genes (left; TFs and non-TFs (white pie chart)) and of noncoding genes (right). (B) DEGs during osteogenic differentiation with total and percentages of coding and noncoding genes (left), and TFs and non-TFs (right). (C) Heatmap showing hierarchical clustering of 60 RNA-seq datasets from 20 iPSC-derived MSC, preOB, and OB lines (columns) and significant differentially expressed genes (DEGs) (rows), fold change ≥ 1.2 and adjusted p value < 0.05. Up-regulated and down-regulated gene expression is colored in red and blue, respectively. (D) and (E) Volcano plots illustrate the distribution of down- and up-regulated genes (blue and red, respectively) with adjusted p values and fold changes when comparing gene differential expression from MSC to preOB in (D) and preOB to OB stages in (E). Cutoffs of fold change ≥ 1.2 and adjusted p value <0.05 were applied to define DEGs. The total number of up-regulated and down-regulated genes are noted at the top (red and blue, respectively). The genes are labeled for the top five up-regulated (red, bottom right), downregulated (blue, bottom left), and statistically significant down-regulated (blue, top left) and up-regulated (red, top right).
Figure 3.
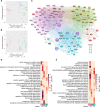
Figure 3.. TF regulatory network in osteogenic differentiation.
(A) Principal component analysis (PCA) of all 20 healthy cell lines at three stages of osteogenic differentiation using all differentially expressed genes (DEGs). (B) PCA using only differentially expressed TF genes. (C) TF regulatory network during osteogenic differentiation. Each node represents a TF, with known bone formation associated regulators underlined in red. Two nodes are connected by a line where ReMap data suggest regulation and our RNA-seq data suggest the association between them. Nodes labeled with the gene name represent the top 100 strongest TFs based on betweenness centrality. The size of the nodes reflects the regulation strength of the TF, with the top 5 strongest circled in pink. (D) and (E) Top significantly enriched GO BP terms in (D) and Reactome pathways in (E) of TFs in each network module.
Figure 4.
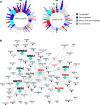
Figure 4.. Gene co-expression network in osteogenic differentiation.
(A) Sunburst plots represent the hierarchy structure of the MEGENA co-expression network constructed on gene expression during the osteogenic differentiation. The structure is shown as concentric rings where the center ring represents the parent modules, and outer rings represent smaller child modules. Subnetwork modules are colored according to the enrichment of differential gene expression between stages (FDR < 0.05; left, MSC to preOB; right, preOB to OB; blue, down-regulated; red, up-regulated; cyan, both up- and down-regulated). The subnetwork branch for Module M204 is outlined and labeled. (B) Co-expression network Module M204. Diamonds indicate KNR genes, and circles indicate non-KNR genes. Blue indicates DEGs from MSC to preOB stages, red indicates DEGs from preOB to OB stages, and cyan indicates shared DEGs for both comparisons. Genes known to be related to bone are in red.
Figure 5.
Figure 5.. Inhibitory role of Klf16 in osteogenic differentiation in vitro and in vivo.
(A) The expression of KLF16 at three human osteogenic differentiation stages. Data are shown as mean + SEM. * MSC vs. preOB, # preOB vs. OB, or + MSC vs. OB, adjusted p value < 0.001. (B) Analysis of Klf16 expression by RT-qPCR in MC3T3-E1 cells transduced vectors containing either stuffer sequence or Klf16 cDNA. Data are presented as the mean ± SEM (n=3, unpaired t-test p value < 0.01) (Supplementary Table 7). (C) Osteogenic differentiation of MC3T3-E1 cells without or with overexpression of Klf16, stained for ALP at Day 7 and alizarin red and von Kossa at Day 14 and Day 21. (D) Length, fat mass, and lean mass of wild type (WT) and Klf16+/− mice. (E) DEXA analysis of whole body (head excluded) bone mineral content (BMC), bone area (B-area), and bone mineral density (BMD) of WT and Klf16+/− mice. (F) and (G) Representative microCT images of distal femur trabecular bone in (F) (left, top view; right, side view) and cortical bone in (G) from WT and Klf16+/− mice. Scale bar: 1 mm. (H) and (I) Graphs show trabecular bone volume/tissue volume (BV/TV), trabecular thickness (Tb.Th), trabecular number (Tb.N), and trabecular separation (Tb.Sp) in (H); cortical bone area (Ct.Ar), cortical periosteal perimeter (Ct.Pe.Pm), and cortical endosteal perimeter (Ct.En.Pm) in (I). For (D), (E), (H), and (I), data are presented using BoxPlotR (Spitzer et al., 2014) as the mean ± SEM (WT n = 6, Klf16+/− n = 6, 3 males and 3 females for each group, aged 17 weeks, paired t-test, n.s, not significant, * p value < 0.05, ** p value < 0.01).

Similar articles

References

    1. Al-Rekabi Z., Wheeler M. M., Leonard A., Fura A. M., Juhlin I., Frazar C., Smith J. D., Park S. S., Gustafson J. A., Clarke C. M., et al. (2016). Activation of the IGF1 pathway mediates changes in cellular contractility and motility in single-suture craniosynostosis. Journal of Cell Science 129, 483–491. - PMC - PubMed
    1. Ardlie K. G., Deluca D. S., Segrè A. V., Sullivan T. J., Young T. R., Gelfand E. T., Trowbridge C. A., Maller J. B., Tukiainen T., Lek M., et al. (2015). The Genotype-Tissue Expression (GTEx) pilot analysis: multitissue gene regulation in humans. Science 348, 648–660. - PMC - PubMed
    1. Aza-Carmona M., Barca-Tierno V., Hisado-Oliva A., Belinchón A., Gorbenko-del Blanco D., Rodriguez J. I., Benito-Sanz S., Campos-Barros A. and Heath K. E. (2014). NPPB and ACAN, two novel SHOX2 transcription targets implicated in skeletal development. PLoS One 9, e83104. - PMC - PubMed
    1. Barberi T., Willis L. M., Socci N. D. and Studer L. (2005). Derivation of multipotent mesenchymal precursors from human embryonic stem cells. PLoS Medicine 2, e161. - PMC - PubMed
    1. Bastian M., Heymann S. and Jacomy M. (2009). Gephi: an open source software for exploring and manipulating networks. Proceedings of the International AAAI Conference on Web and Social Media 3, 361–362.

Publication types