[Preprint]. 2024 May 16:2024.01.05.574340.
doi: 10.1101/2024.01.05.574340.

Investigating the cis-Regulatory Basis of C3 and C4 Photosynthesis in Grasses at Single-Cell Resolution

Affiliations

Investigating the cis-Regulatory Basis of C3 and C4 Photosynthesis in Grasses at Single-Cell Resolution

John Pablo Mendieta et al. bioRxiv. .

Update in

Abstract

While considerable knowledge exists about the enzymes pivotal for C4 photosynthesis, much less is known about the cis-regulation important for specifying their expression in distinct cell types. Here, we use single-cell-indexed ATAC-seq to identify cell-type-specific accessible chromatin regions (ACRs) associated with C4 enzymes for five different grass species. This study spans four C4 species, covering three distinct photosynthetic subtypes: Zea mays and Sorghum bicolor (NADP-ME), Panicum miliaceum (NAD-ME), Urochloa fusca (PEPCK), along with the C3 outgroup Oryza sativa. We studied the cis-regulatory landscape of enzymes essential across all C4 species and those unique to C4 subtypes, measuring cell-type-specific biases for C4 enzymes using chromatin accessibility data. Integrating these data with phylogenetics revealed diverse co-option of gene family members between species, showcasing the various paths of C4 evolution. Besides promoter proximal ACRs, we found that, on average, C4 genes have two to three distal cell-type-specific ACRs, highlighting the complexity and divergent nature of C4 evolution. Examining the evolutionary history of these cell-type-specific ACRs revealed a spectrum of conserved and novel ACRs, even among closely related species, indicating ongoing evolution of cis-regulation at these C4 loci. This study illuminates the dynamic and complex nature of CRE evolution in C4 photosynthesis, particularly highlighting the intricate cis-regulatory evolution of key loci. Our findings offer a valuable resource for future investigations, potentially aiding in the optimization of C3 crop performance under changing climatic conditions.


Figures

Figure 1:
Figure 1:
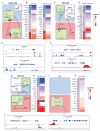
Annotation of cell types in diverse grass species at single-cell resolution A) A phylogeny indicating the relationship of various C3 and C4 photosynthesizers sampled. In this sample, two NADP-ME subtypes are represented, one NAD-ME subtype, a PEPCK subtype, as well as a C3 species. B) UMAP embedding showing the annotation for each species. A cell type legend is below. C) Dotplots for various marker genes used to annotate each species. The y-axis represents cell types, and the x-axis is a list marker genes used to annotate different cell types. The size of each circle is proportional to the number of cells within that cell type that showed chromatin accessibility of the marker. Color is z-score transformed values across clusters of gene chromatin accessibility across the clusters. D) Screenshots of the PEPC locus for all sampled species. For each screenshot, the top track shows the protein coding, the red track is chromatin accessibility of MS cells, and the blue track is the chromatin accessibility of the BS cells.
Figure 2:
Figure 2:
Cell-type chromatin-accessibility bias for core enzymes in C4 and C3 species. A) Schematic of the core C4 enzymatic pathway. Core C4 enzymes are defined as those which maintain their cell-type-specificity in all C4 subtypes sampled. The red and blue squares represent MS and BS cells, respectively. Enzymes are labeled in bold, and transporters are denoted by shapes. Intermediate molecules are indicated by non-bolded text. B) Screenshot of PEPCK in Z. mays. Blue tracks correspond to BS chromatin accessibility and red tracks show MS chromatin accessibility. Tracks are equally scaled to facilitate comparison. C) Heatmaps of chromatin accessibility bias of the core C4 enzymes. Values within each heatmap correspond to Log2(BS/MS). Blue indicates increased BS chromatin accessibility and red indicates increased MS chromatin accessibility. Each species column and subtype was clustered independently, and genes were assigned as being MS- or BS-specific (top/bottom of heatmap) based on literature. Enzyme copies were distinguished phylogenetically.
Figure 3:
Figure 3:
Cell-type chromatin accessibility bias for variable C4 genes associated with C4 subtypes. A/D/G/J) Schematic of C4 enzymatic pathways for various C4 subtypes. The red and blue squares represent MS and BS cells. Enzymes are labeled in bold, and transporters are denoted by shapes. Intermediate molecules are indicated by non-bolded text. For clarity, core enzymes have been removed. B/E/H/K) Heatmaps of chromatin accessibility bias in C4 subtype enzymes. Values within the heatmap correspond to Log2(BS/MS). Blue indicates increased BS-chromatin accessibility and red indicates increased MS-chromatin accessibility. Genes were labeled as being BS specific (blue) BS/MS specific (purple) or MS specific (red) based on previous literature. C/F/I) Screenshot of various C4 sub-type enzymes and their chromatin accessibility profiles around the TSS. Blue tracks correspond to BS chromatin accessibility and red tracks show MS chromatin accessibility. Tracks are equally scaled to facilitate comparison.
Figure 4:
Figure 4:
Investigating the number and distance of cell-type-specific ACRs around C4 enzymes across subtypes. A) Dot plots showing the number of cell-type-specific ACRs around each enzyme. The x-axis indicates which cell type these enzymes are found in. The y-axis is counts of ACRs. The graph is further subdivided with the top panel being broad ACRs, middle panel BS-specific ACRs, and the bottom being MS-specific ACRs. Enzymes are labeled. B) Dotplots showing the mean distance of cell-type-specific ACRs to their closest C4 enzyme. The x-axis indicates which cell type these enzymes are found in. The x-axis is the genomic distance to the C4 enzyme in question. If an enzyme had multiple cell-type-specific ACRs, the distance was averaged (mean). C) Screenshot of NADP-ME1 in Z. mays. Blue tracks correspond to BS chromatin accessibility and red tracks show MS chromatin accessibility. Tracks are equally scaled to facilitate comparison. All genes found within this window are shown. D) Screenshot of RBCS2 in Z. mays. Blue tracks correspond to BS chromatin accessibility and red tracks show MS chromatin accessibility. Tracks are equally scaled to facilitate comparison. All genes found within this window are shown. E) Screenshot of PEPC1 in P. miliaceum. The green fragment represents the cloned promoter from Gupta et al 2020, which was identified by minimap2 alignment. Blue tracks correspond to BS chromatin accessibility and red tracks show MS chromatin accessibility. Tracks are equally scaled to facilitate comparisons.
Figure 5:
Figure 5:
The evolutionary relationships of cis-regulatory regions around C4 genes is complex, being composed of both novel and conserved ACRs. A) The proportion of all ACRs that are conserved or novel for the following gene families PPDK, RCA, and NADP-ME. Purple bars represent ACRs that have any sequence aligned to them from a different species, and gray represents ACRs where sequences are not alignable. The number of ACRs in each locus is labeled at the top of each column. B) The proportion of cell-type-specific ACRs that are conserved and novel for the following gene families, PPDK, PEPC, and NADP-ME. Red bars only consider MS-specific ACRs, and blue bars only consider BS-specific ACRs. C) Screenshot of the conservation of BS-specific ACRs around NADP-ME across species. From top to bottom the species are Z. mays, S. bicolor, P. miliaceum, U. fusca, and O. sativa. NADP-ME is annotated in green for all species. Dashed bars between gene models represent the same gene model, and yellow bars are conserved ACRs. Browser tracks are blue for BS, and red for MS. Browser tracks are scaled within each species to allow for direct comparisons. D) The length of ACRs that are conserved in a cross species context. Rows represent gene families, and columns represent species. Each histogram is the number of ACRs within the loci of that gene family. The x-axis is the length of the ACR that is conserved and the y-axis is the count. ACRs are color coded according to the legend.
Figure 6:
Figure 6:
Identification of cell-type-specific TF motifs reveal a complex relationship between sequence conservation and motif prescnece. A subsample of MS- (A) and BS-specific (B) de novo TF motifs identified. Left) De novo motifs were clustered by the correlation of their PWMs and a correlation based tree was generated. Right) Representative PWMs from de novo discovery. C) Screenshot of the ZmCA3 locus. ACRs are color coded based on their cell-type specificity. MS- and BS-chromatin accessibility tracks are equally scaled for comparison. Sequence conservation is identified by the ACR having sequence homology to other CA ACRs from a different species. D) An example of the conservation and motif landscape of one MS-specific ACR at ZmCA3. Left, the location of the motifs in ACRs with MS- and BS-specific motifs labeled. Orange highlighted regions correspond to the region of sequence conservation seen above. Right, quantification of the motifs found in the ACR. X-axis is the motif count, and the y-axis is the motif. E) The counts of TF motifs in conserved and non-conserved ACRs for three different genes across all five species. Y-axis is the number of ACRs of a given type, and the x-axis indicates the type of ACR. F) Odds ratio of four motifs when comparing their enrichment in conserved versus non-conserved regions. A higher odds ratio indicates that the motif is more often found in non-conserved regions within ACRs, whereas a lower odds ratio means the motif is in conserved regions. The cell-type-specific motifs found in A/B are colored in red and blue, respectively.
Figure 7:
Figure 7:
A) Phylogenetic tree showing the evolutionary relationship of the DITs in the monocots. DITs for Z. mays and S. bicolor are colored by their observed cell-type specificity, with red being MS specific, and blue being BS specific. Additional species have been added to increase resolution B) A screenshot of the DIT1 between Z. mays (top) and S. bicolor (bottom). Yellow boxes indicate ACR sequences with conserved homology C/E/F) Motif location of BS and MS specific motifs in each ACR. The x-axis is the location within the ACR, and the y-axis is the motif count. Yellow bars indicate regions of sequence homology. Within each histogram, the x-axis is binned into 20bp regions for ease of graphing. Roman numerals in the top corner highlight the corresponding ACR found in the screenshot. (I-IX) top) X-axis the genomic coordinates of the given ACR. Yellow blocks denote the sequence homology as seen above. Y-axis, the motif score as calculated by motifmatchR, higher scores indicate a more confident motif. bottom) The count of each motif identified in the ACR. Note that BS and MS de-novo identified motifs are in blue and red respectively. D) A screenshot of the BS specific DITs loci between Z. mays (top) and S. bicolor (bottom). For the S. bicolor versions of the DITs, DIT4 is colored blue for its observed BS specificity and DIT2.1 and DIT2.2 are colored green. Yellow boxes indicate sequence homology.

Similar articles

References

    1. Bowes G, Ogren WL, Hageman RH. Phosphoglycolate production catalyzed by ribulose diphosphate carboxylase. Biochem Biophys Res Commun. 1971. Nov 5;45(3):716–22. - PubMed
    1. Wheeler T, von Braun J. Climate Change Impacts on Global Food Security. Science. 2013. Aug 2;341(6145):508–13. - PubMed
    1. Hatch MD. C4 photosynthesis: a unique elend of modified biochemistry, anatomy and ultrastructure. Biochim Biophys Acta BBA - Rev Bioenerg. 1987. Jan 1;895(2):81–106.
    1. Offermann S, Okita TW, Edwards GE. Resolving the Compartmentation and Function of C4 Photosynthesis in the Single-Cell C4 Species Bienertia sinuspersici. Plant Physiol. 2011. Apr 1;155(4):1612–28. - PMC - PubMed
    1. Akhani H, Barroca J, Koteeva N, Voznesenskaya E, Franceschi V, Edwards G, et al. Bienertia sinuspersici (Chenopodiaceae): A New Species from Southwest Asia and Discovery of a Third Terrestrial C4 Plant Without Kranz Anatomy. Syst Bot. 2005. Apr 1;30(2):290–301.

Publication types