[Preprint]. 2024 Feb 18:2024.02.15.580540.
doi: 10.1101/2024.02.15.580540.

The interplay between electron transport chain function and iron regulatory factors influences melanin formation in Cryptococcus neoformans

Affiliations

The interplay between electron transport chain function and iron regulatory factors influences melanin formation in Cryptococcus neoformans

Peng Xue et al. bioRxiv. .

Update in

Abstract

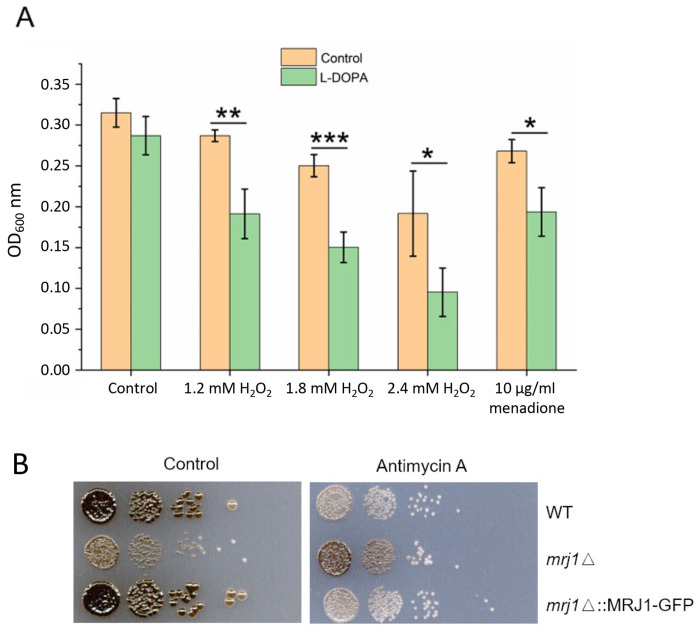
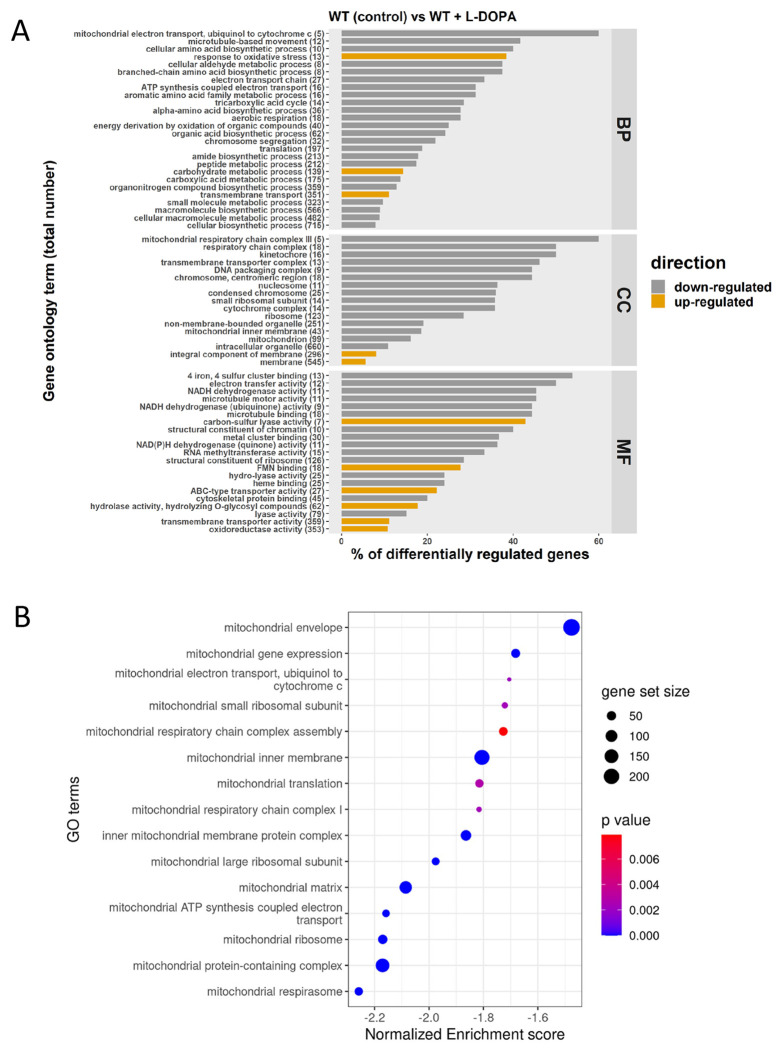
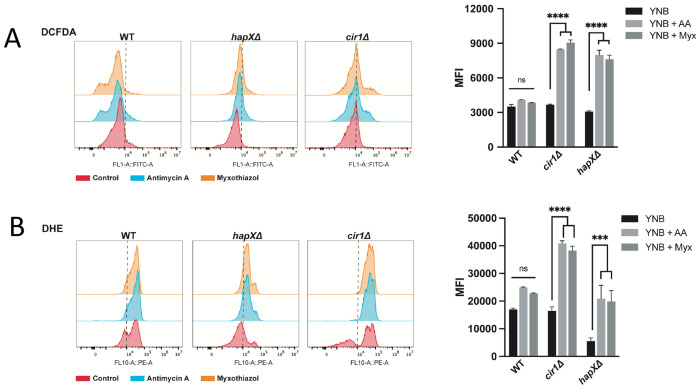
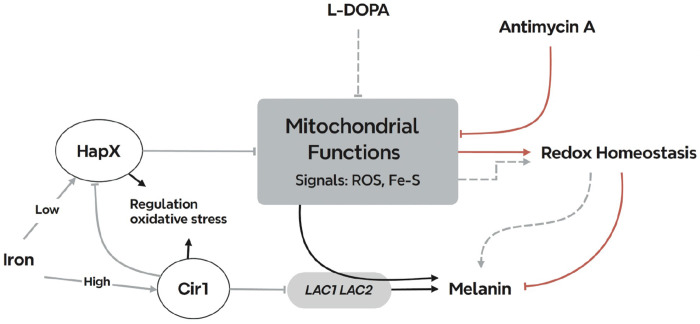
Mitochondrial functions are critical for the ability of the fungal pathogen Cryptococcus neoformans to cause disease. However, mechanistic connections between key functions such as the mitochondrial electron transport chain (ETC) and virulence factor elaboration have yet to be thoroughly characterized. Here, we observed that inhibition of ETC complex III suppressed melanin formation, a major virulence factor. This inhibition was partially blocked upon loss of Cir1 or HapX, two transcription factors that regulate iron acquisition and use. In this regard, loss of Cir1 derepresses the expression of laccase genes as a potential mechanism to restore melanin, while HapX may condition melanin formation by controlling oxidative stress. We hypothesize that ETC dysfunction alters redox homeostasis to influence melanin formation. Consistent with this idea, inhibition of growth by hydrogen peroxide was exacerbated in the presence of the melanin substrate L-DOPA. Additionally, loss of the mitochondrial chaperone Mrj1, which influences the activity of ETC complex III and reduces ROS accumulation, also partially blocked antimycin A inhibition of melanin. The phenotypic impact of mitochondrial dysfunction was consistent with RNA-Seq analyses of WT cells treated with antimycin A or L-DOPA, or cells lacking Cir1 that revealed influences on transcripts encoding mitochondrial functions (e.g., ETC components and proteins for Fe-S cluster assembly). Overall, these findings reveal mitochondria-nuclear communication via ROS and iron regulators to control virulence factor production in C. neoformans.

Keywords: RNA-Seq; electron transport chain; fungal pathogenesis; iron regulation; melanin formation; reactive oxygen species.


Conflict of interest statement

CONFLICT OF INTEREST The authors declare no competing interests.

Figures

FIG 1
FIG 1
ETC inhibition influences melanin formation and the transcription of genes for mitochondrial functions. (A) Spot assays of WT and mutant strains on L-DOPA agar plates with or without inhibitors of the ETC including 1.2 μg/ml rotenone, 100 μM malonic acid, 0.2 mM salicylhydroxamic acid (SHAM), 0.5 μg/ml antimycin A, 0.5 μM myxothiazol, and 100 μM KCN. Plates were incubated for 72 h at 30° C in the dark. (B) Gene ontology (GO) categories of the differentially expressed genes identified by RNA-seq analysis of WT cells with and without antimycin A (0.5 μg/ml) treatment. The total number of genes in each functional category is displayed in parentheses, and the percent of all differentially expressed genes is indicated. BP: biological process; CC: cell component; MF: molecular function. (C) Heatmap of the expression of genes encoding components of ETC in the WT versus WT with antimycin A treatment. Samples are clustered according to expression similarity and the differences in transcript levels were significant (P < 0.05). The corresponding genes are listed in Table S1.
FIG 2
FIG 2
Growth and melanin formation are influenced by L-DOPA, oxidative stress, and the mitochondrial regulator Mrj1. (A) The growth of WT cells was tested in liquid medium with and without 0.7 mM L-DOPA in the presence of hydrogen peroxide (H2O2) or menadione at the indicated concentrations for 18 h at 30° C and 180 rpm in the dark. The assays were performed using 96-well microplates with each well containing a final volume of 200 μl. The initial cell density was set at 1×10⁵ cells/ml. Mean values of three biological replicates are shown ± standard deviation (SD). Significant differences were determined by t tests and are indicated by * (P < 0.05), ** (P < 0.01), or *** (P < 0.005). (B) Spot assays of WT, mrj1Δ and mrj1ΔMRJ1-GFP strains showing that the absence of MRJ1 rescues melanin formation on L-DOPA plates in the presence of antimycin A (0.5 μg/ml). Plates were incubated for 72 h at 30° C in the dark.
FIG 3
FIG 3
L-DOPA provokes down-regulation of mitochondrial functions. (A) Gene ontology (GO) terms for genes with differential transcriptions upon treatment with L-DOPA (0.7 mM). The total number of genes in each functional category is displayed in parentheses, and the percent of all differentially expressed genes is indicated on the x axis. BP: biological process; CC: cell component; MF: molecular function. (B) Gene Set Enrichment Analysis demonstrating negative enrichment for pathways directly involved in mitochondrial function. Significantly regulated pathways were determined using a 0.05 cut-off p-value and a false discovery rate of 0.25. The list of regulated genes for components of the ETC and iron-sulfur cluster biogenesis is presented in Table S2.
FIG 4
FIG 4
Loss of Cir1 results in upregulation of mitochondrial functions. (A) Gene ontology (GO) terms for RNA-Seq analysis of the WT strain vs the cir1Δ mutant. The total number of genes in each functional category is displayed in parentheses, and the percent of all differentially expressed genes is indicated. BP: biological process; CC: cell component; MF: molecular function. (B) Heatmap of the expression of genes encoding components of electron transport chain (ETC) in the WT and cir1Δ mutant strains. The differences in transcript levels were significant (P < 0.05), and the corresponding genes are listed in Table S3.
FIG 5.
FIG 5.
Loss of Cir1 or HapX results in accumulation of ROS in response to complex III inhibition. (A) Flow cytometry analysis of WT and mutant cells stained for 1 hour with 2′,7′-Dichlorofluorescein Diacetate (DCFDA, 16 μM) to detect ROS accumulation in response to exposure to antimycin A (AA, 50 μM) or myxothiazol (Myx, 7 μM) for 24 h at 30°C. (B) Flow cytometry analysis of WT and mutant cells stained with Dihydroethidium (DHE, 2.5 μg/ml) to detect ROS accumulation in response to ETC-III inhibitors as in (A). The data represent the mean fluorescent intensity (MFI, geometric means) from three biological replicates ± standard errors of the means. The statistical comparisons employed a two-way ANOVA test, followed by post hoc šídák’s or Tukey’s multiple comparison tests (*, P < 0.05, **, P < 0.01 ***, P < 0.001; ****, P < 0.0001). ns: not significant. The gating strategy for the left panels is shown in Fig. S11.
FIG 6
FIG 6
Loss of Cir1 but not HapX causes sensitivity to oxidative stress. (A) Spot assays of the WT strain and the hapXΔ or cir1Δ mutants on the indicated media were performed with 10-fold serial dilutions from an initial concentration of 2 x 10⁷ cells per ml. Five microliters were spotted into solid YPD or YNB plates supplemented with different compounds and incubated at 30°C and 37°C for 2-3 days before being scanned. The media were supplemented at the indicated concentrations with the following compounds: hydrogen peroxide (H2O2), menadione, plumbagin, or paraquat. (B) Graph of the percentage of DCFDA positive cells upon exposure to H2O2 [5 mM] for 1 hour at 30°C for the WT strain and the hapXΔ and cir1Δ mutants as determined by flow cytometry using the gating strategy in Fig. S11. The data represent the average from at least three biological replicates ± standard errors of the means. Statistical comparisons employed a two-way ANOVA test, followed by post hoc šídák’s multiple comparison test (****, p < 0.0001). ns: not significant.
FIG 7.
FIG 7.
Summary model of the interplay between mitochondrial ETC function and the iron regulators that influence melanin formation in C. neoformans. Inhibitors of ETC complex III provoke ROS accumulation which inhibits melanin formation through an influence on laccase activity and/or localization. Cir1 directly represses transcription of the LAC1 and LAC2 genes encoding laccases, and loss of Cir1 may derepress the genes to a level sufficient partially restore melanin formation. Cir1 also represses the transcription of the HAPX gene (23, 31). HapX is a key regulator of iron-requiring functions in mitochondria, and loss of HapX derepresses genes for the response to oxidative stress. This de-repression may be sufficient to overcome ROS accumulation to partially restore melanin. Other signals including iron-sulfur clusters may be generated by ETC inhibition to include the activities of the iron regulators and the laccases.

Similar articles

References

    1. Ma H, Hagen F, Stekel DJ, Johnston SA, Sionov E, Falk R, Polacheck I, Boekhout T, May RC. 2009. The fatal fungal outbreak on Vancouver Island is characterized by enhanced intracellular parasitism driven by mitochondrial regulation. Proc Natl Acad Sci USA 106:12980–12985. - PMC - PubMed
    1. Calderone R, Li D, Traven A. 2015. System-level impact of mitochondria on fungal virulence: to metabolism and beyond. FEMS Yeast Res. 15(4):fov027. - PMC - PubMed
    1. Verma S, Shakya VPS, Idnurm A. 2018. Exploring and exploiting the connection between mitochondria and the virulence of human pathogenic fungi. Virulence. 9:426–446. - PMC - PubMed
    1. Black B, Lee C, Horianopoulos LC, Jung WH, Kronstad JW. 2021. Respiring to infect: Emerging links between mitochondria, the electron transport chain, and fungal pathogenesis. PLoS Pathog. 17:e1009661. - PMC - PubMed
    1. Kretschmer M, Damoo D, Sun S, Lee CW, Croll D, Brumer H, Kronstad J. 2022. Organic acids and glucose prime late-stage fungal biotrophy in maize. Science 376:1187–1191. - PubMed

Publication types