[Preprint]. 2024 Oct 24:2024.02.13.580214.
doi: 10.1101/2024.02.13.580214.

Cost-benefit Tradeoff Mediates the Rule- to Memory-based Processing Transition during Practice

Affiliations

Cost-benefit Tradeoff Mediates the Rule- to Memory-based Processing Transition during Practice

Guochun Yang et al. bioRxiv. .

Update in

Abstract

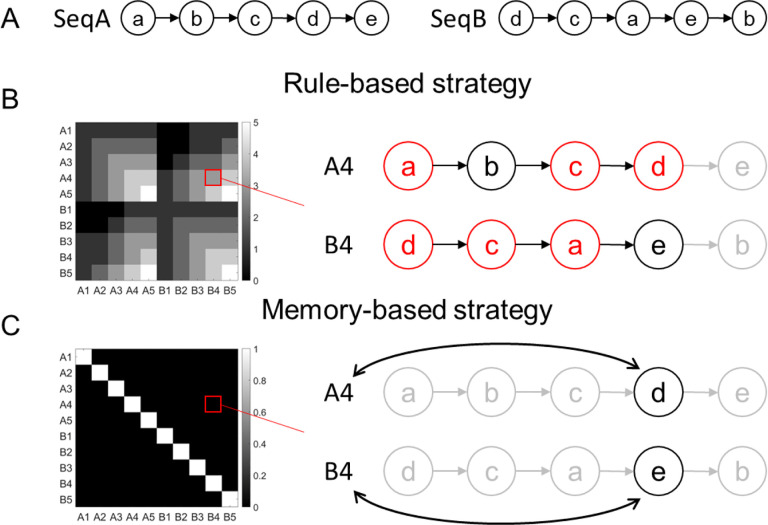
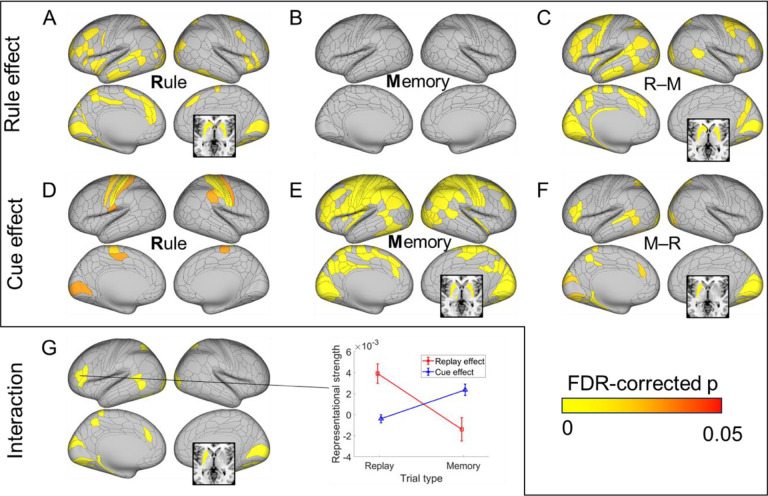
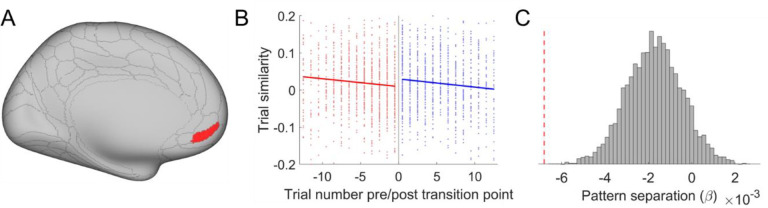
Practice not only improves task performance but also changes task execution from rule- to memory-based processing by incorporating experiences from practice. However, how and when this change occurs is unclear. We test the hypothesis that strategy transitions in task learning can result from decision-making guided by cost-benefit analysis. Participants learn two task sequences and are then queried about the task type at a cued sequence and position. Behavioral improvement with practice can be accounted for by a computational model implementing cost-benefit analysis, and the model-predicted strategy transition points align with the observed behavioral slowing. Model comparisons using behavioral data show that strategy transitions are better explained by a cost-benefit analysis across alternative strategies rather than solely on memory strength. Model-guided fMRI findings suggest that the brain encodes a decision variable reflecting the cost-benefit analysis and that different strategy representations are double-dissociated. Further analyses reveal that strategy transitions are associated with activation patterns in the dorsolateral prefrontal cortex and increased pattern separation in the ventromedial prefrontal cortex. Together, these findings support cost-benefit analysis as a mechanism of practice-induced strategy shift.

Keywords: cognitive control; cost-benefit tradeoff; decision-making; memory retrieval; pattern separation; practice; task representation.


Conflict of interest statement

Declaration of Interests The authors declare no competing interests.

Figures

Figure. 1.
Figure. 1.. Alternative models and the experimental design.
A) Three main alternative models and how improved memory from practice affects strategy application. In the decision-selection model, the memory-based strategy replaces the rule-based strategy when the former provides better value (i.e., cost-benefit tradeoff). In the both-active model, both strategies are always implemented. In the decision-memory-threshold model, the strategy switches to memory-based whenever the memory strength reaches a pre-defined threshold. B) Design of the training phase. Top panel: During the training phase, participants learn two sequences of tasks (one example sequence shown) with practice. Each sequence consists of five different tasks in a fixed order, indicated by a cue (A or B) presented before the first trial of the corresponding sequence. Each task requires the participant to equip an avatar with a specific type of gear (e.g., helmet). Bottom panel: A task starts with a goal image and then two option gears, one on each side of an avatar. Participants are required to choose the gear that matches the goal image. The goal image is randomized for each mini-block to ensure that the sequences are defined by equipment types (e.g., weapon) rather than by specific stimuli (e.g., dagger). C) Design of the test phase. Top panel: During the test phase, a cue denoting the position from a sequence (e.g., A4, denoting the 4th position in sequence A) is displayed in the center of the screen. Surrounding the cue are six equipment images denoting five task types plus a foil (MOUSTACHE), with their spatial locations fixed but the display images randomly selected within each equipment type. Participants are required to identify the task type at the cued position of the sequence by selecting the equipment representing the task type (e.g., nunchaku, representing the weapon task). Bottom panel: trial time course. D) Illustration of the two strategies. The rule-based strategy recalls the cued sequence (e.g., A) from the first position till the cued position (e.g., 4), whereas the memory strategy retrieves the association between the cue (e.g., A4) and the task (e.g., weapon) directly.
Figure 2.
Figure 2.. Behavioral and computational modeling results.
A) behavioral data (RT, left panel, and ER, right panel) and model predicted RT (middle panel) displayed as a function of cued position and block. Error bars denote standard errors of the mean (SEMs). B) The structure of the decision-selection model (M0). C) Model comparison based on the group-level ΔAIC (Akaike information criteria), i.e., increased AIC of alternative models (see Table 1 and Methods) compared to the winning model (M0, illustrated in panel B). D) Individual model-estimated parameters (α = learning rate, λ = cost-benefit tradeoff, γ = recency effect, see definitions in Materials and Methods) and beta coefficients for rule implementation cost (C) and memory strength (S) effects. E) Change of model predicted strategy over time. The Y axis shows the model-inferred proportion of participants using the rule-based strategy. Trials were counted for each cue separately. F) The RT as a function of trial number relative to the cue’s transition point. The inset highlights the increase of RT on the trial following the estimated strategy switch. Error bars denote SEMs. G) Post-strategy switch slowing of real data (dashed red line) and its null distribution (histogram) estimated using randomly selected transition points.
Figure 3.
Figure 3.. Coding schemes of representational similarity for rule- and memory-based effects.
A) The two task sequences. Letters a-e represent the five tasks. B) The hypothetical representational similarity for the rule effect is quantified as the number of shared recalled tasks between the two trials. For example, cues A4 and B4 share three tasks in rule implementation, namely a, c, and d (red nodes), resulting in a similarity level of 3. C) The hypothetical representational similarity for the cue effect (reflecting the memory strategy) is defined by the concordance of the cues and hence their associated tasks. For example, the cues A4 and B4 are different, thereby yielding a similarity value of 0. The light gray nodes and arrows in panels B and C indicate the tasks that are neither sequentially recalled nor retrieved by the cue.
Figure 4.
Figure 4.. Double dissociation of rule and memory representations on their respective trials revealed by multivariate activation patterns.
A significant representation of the rule effect is observed on rule (R) trials (panel A) but not on memory (M) trials (panel B). C) A stronger rule effect on rule trials than memory trials (R–M) is found in frontoparietal, temporal, occipital and subcortical regions. In contrast, the cue effect is observed in more regions on memory trials (panel E) than on rule trials (panel D). Regions showing a stronger memory effect on memory than on rule trials (M–R) include frontoparietal, temporal, occipital and subcortical regions (panel F). G) Regions showing double dissociation (i.e., the conjunction of C and F) with both stronger rule effect representations in rule trials and stronger cue effect representations in memory trials. The middle panel illustrates the double dissociation with an example region (left inferior prefrontal sulcus; IFSa). All subcortical regions are depicted in an axial slice at z = 0.
Figure 5.
Figure 5.. Multivariate encoding of rule-, memory-based strategies and the decision variable.
A) The left inferior prefrontal region encodes the cued position, reflecting the cost of rule implementation. B) The memory strength is encoded in the visual, sensorimotor and temporoparietal association regions. C) The decision variable is encoded in sensorimotor and dorsomedial prefrontal regions. D) The encoding strength of three representative regions (highlighted by black ovals in A-C) for the cued position (left), memory strength (middle) and decision variable (right). Each dot represents one subject. E) and F) show a negative correlation between the model prediction of the cost-benefit tradeoff factor (log-transformed λ) and the neural memory encoding strength from those brain regions identified in B) on average (E) and a single region left PF for example (F), respectively.
Figure 6.
Figure 6.. Dorsolateral PFC encodes the boundary effect across the transition point.
A) The right p9–46v shows a higher within-boundary than cross-boundary pattern similarity for trials around the transition points. B) Pattern similarity (group mean ± SEM) as a function of within/cross-boundary in the region right p9–46v. C) The significant boundary effect (i.e., the higher pattern similarity within-boundary than cross-boundary condition, indicated by the red dashed line), compared with a null distribution obtained by randomly shuffling the transition point 5,000 times.
Figure 7.
Figure 7.. Ventromedial PFC pattern-separates cue-task associations.
The left 10r area shows that pattern similarity among different cues decreases over time. A) The anatomical location. B) A scatter plot of trial similarity as a function of trial number relative to the transition point and the corresponding fitting lines. Red and blue colors indicate rule and memory trials, respectively. C) The significant pattern separation effect (i.e., the negative coefficient, indicated by the red dashed line) compared with a null distribution obtained by randomly shuffling the transition point 5,000 times.

Similar articles

References

    1. Fitts P.M., and Posner M.I. (1967). Human performance.
    1. Anderson J.R. (1982). Acquisition of cognitive skill. Psychological review 89, 369–406. 10.1037/0033-295x.89.4.369. - DOI
    1. Miller E.K., and Cohen J.D. (2001). An integrative theory of prefrontal cortex function. Annu Rev Neurosci 24, 167–202. 10.1146/annurev.neuro.24.1.167. - DOI - PubMed
    1. Schneider W., and Detweiler M. (1988). A connectionist/control architecture for working memory. In Psychology of learning and motivation, (Elsevier; ), pp. 53–119.
    1. Schuck N.W., Gaschler R., Wenke D., Heinzle J., Frensch P.A., Haynes J.D., and Reverberi C. (2015). Medial prefrontal cortex predicts internally driven strategy shifts. Neuron 86, 331–340. 10.1016/j.neuron.2015.03.015. - DOI - PMC - PubMed

Publication types