

This is a preprint.
Multimodal illumination platform for 3D single-molecule super-resolution imaging throughout mammalian cells
- PMID: 38405960
- PMCID: PMC10888752
- DOI: 10.1101/2024.02.08.579549
Multimodal illumination platform for 3D single-molecule super-resolution imaging throughout mammalian cells
Update in
-
Multimodal illumination platform for 3D single-molecule super-resolution imaging throughout mammalian cells.Biomed Opt Express. 2024 Apr 16;15(5):3050-3063. doi: 10.1364/BOE.521362. eCollection 2024 May 1. Biomed Opt Express. 2024. PMID: 38855669 Free PMC article.
Abstract
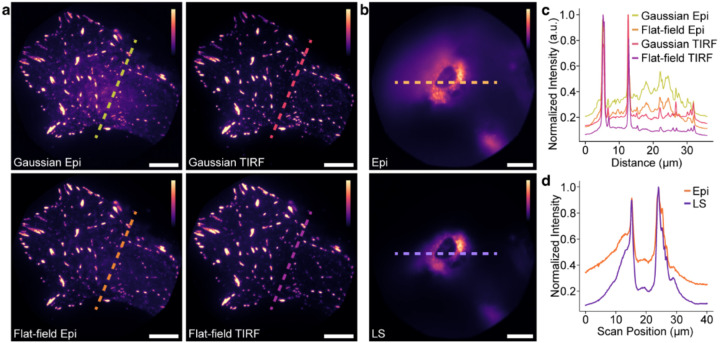
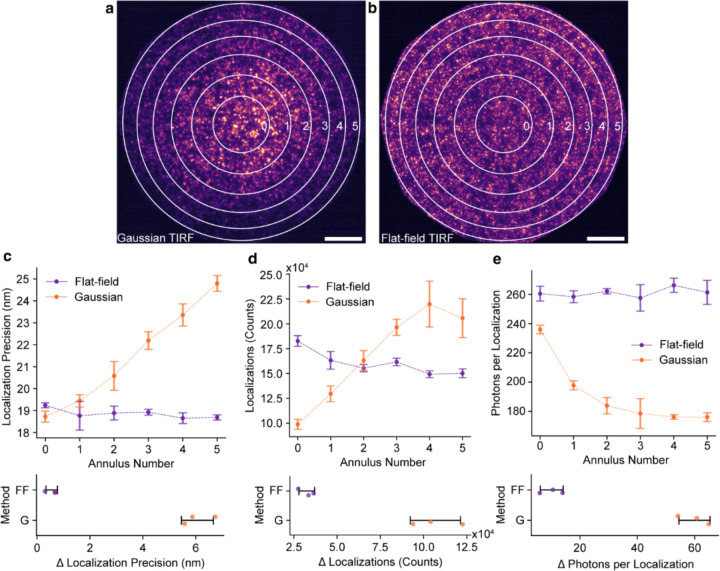
Single-molecule super-resolution imaging is instrumental for investigating cellular architecture and organization at the nanoscale. Achieving precise 3D nanometric localization when imaging structures throughout mammalian cells, which can be multiple microns thick, requires careful selection of the illumination scheme in order to optimize the fluorescence signal to background ratio (SBR). Thus, an optical platform that combines different wide-field illumination schemes for target-specific SBR optimization would facilitate more precise, 3D nanoscale studies of a wide range of cellular structures. Here we demonstrate a versatile multimodal illumination platform that integrates the sectioning and background reduction capabilities of light sheet illumination with homogeneous, flat-field epi-and TIRF illumination. Using primarily commercially available parts, we combine the fast and convenient switching between illumination modalities with point spread function engineering to enable 3D single-molecule super-resolution imaging throughout mammalian cells. For targets directly at the coverslip, the homogenous intensity profile and excellent sectioning of our flat-field TIRF illumination scheme improves single-molecule data quality by providing low fluorescence background and uniform fluorophore blinking kinetics, fluorescence signal, and localization precision across the entire field of view. The increased contrast achieved with LS illumination, when compared with epi-illumination, makes this illumination modality an excellent alternative when imaging targets that extend throughout the cell. We validate our microscopy platform for improved 3D super-resolution imaging by two-color imaging of paxillin - a protein located in the focal adhesion complex - and actin in human osteosarcoma cells.
Conflict of interest statement
Disclosures. The authors declare no conflicts of interest.
Figures


Similar articles
-
Multimodal illumination platform for 3D single-molecule super-resolution imaging throughout mammalian cells.Biomed Opt Express. 2024 Apr 16;15(5):3050-3063. doi: 10.1364/BOE.521362. eCollection 2024 May 1. Biomed Opt Express. 2024. PMID: 38855669 Free PMC article.
-
Tilted Light Sheet Microscopy with 3D Point Spread Functions for Single-Molecule Super-Resolution Imaging in Mammalian Cells.Proc SPIE Int Soc Opt Eng. 2018 Feb;10500:105000M. doi: 10.1117/12.2288443. Proc SPIE Int Soc Opt Eng. 2018. PMID: 29681676 Free PMC article.
-
Light Sheet Illumination for 3D Single-Molecule Super-Resolution Imaging of Neuronal Synapses.Front Synaptic Neurosci. 2021 Nov 24;13:761530. doi: 10.3389/fnsyn.2021.761530. eCollection 2021. Front Synaptic Neurosci. 2021. PMID: 34899261 Free PMC article. Review.
-
Whole-cell multi-target single-molecule super-resolution imaging in 3D with microfluidics and a single-objective tilted light sheet.Nat Commun. 2024 Nov 24;15(1):10187. doi: 10.1038/s41467-024-54609-z. Nat Commun. 2024. PMID: 39582043 Free PMC article.
-
Light sheet approaches for improved precision in 3D localization-based super-resolution imaging in mammalian cells [Invited].Opt Express. 2018 May 14;26(10):13122-13147. doi: 10.1364/OE.26.013122. Opt Express. 2018. PMID: 29801343 Free PMC article. Review.
References
-
- Betzig E., Patterson G. H., Sougrat R., Lindwasser O. W., Olenych S., Bonifacino J. S., Davidson M. W., Lippincott-Schwartz J., and Hess H. F., “Imaging Intracellular Fluorescent Proteins at Nanometer Resolution,” Science 313, 1642–1645 (2006). - PubMed
-
- Weiss L. E., Love J. F., Yoon J., Comerci C. J., Milenkovic L., Kanie T., Jackson P. K., Stearns T., and Gustavsson A.-K., “Chapter 4 - Single-molecule imaging in the primary cilium,” in Methods Cell Biol, Bravo-San Pedro J. M. and Galluzzi L., eds. (Academic Press, 2023), Vol. 176, pp. 59–83. - PMC - PubMed
Publication types
Grants and funding
LinkOut - more resources
Full Text Sources