[Preprint]. 2024 Feb 13:2024.02.12.579947.
doi: 10.1101/2024.02.12.579947.

A nociceptive amygdala-striatal pathway for chronic pain aversion

Affiliations

A nociceptive amygdala-striatal pathway for chronic pain aversion

Jessica A Wojick et al. bioRxiv. .

Update in

  • A nociceptive amygdala-striatal pathway modulating affective-motivational pain.
    Wojick JA, Paranjapye A, Chiu JK, Oswell CS, Mahmood M, Wooldridge LM, Kimmey BA, Sandoval Ortega RA, McCall NM, Han S, Wu JWK, Yung M, Ejoh LL, Chehimi SN, Crist RC, Reiner BC, Korb E, Corder G. Wojick JA, et al. Sci Adv. 2025 Jul 25;11(30):eado2837. doi: 10.1126/sciadv.ado2837. Epub 2025 Jul 23. Sci Adv. 2025. PMID: 40700496 Free PMC article.

Abstract

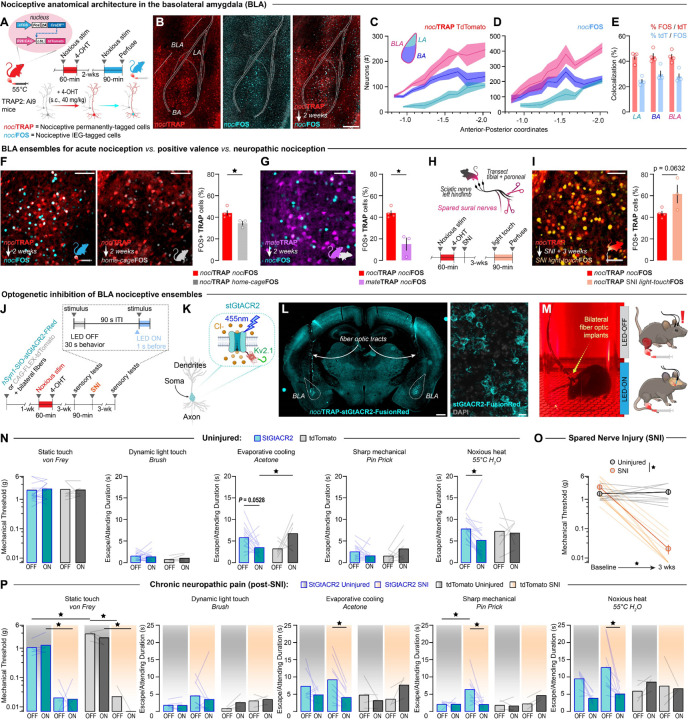
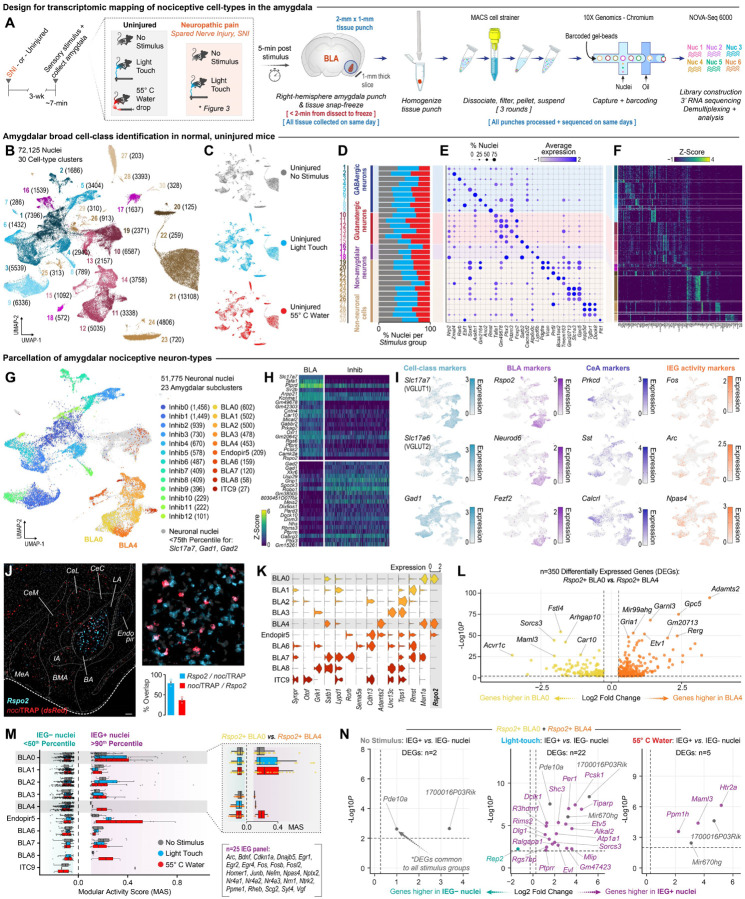
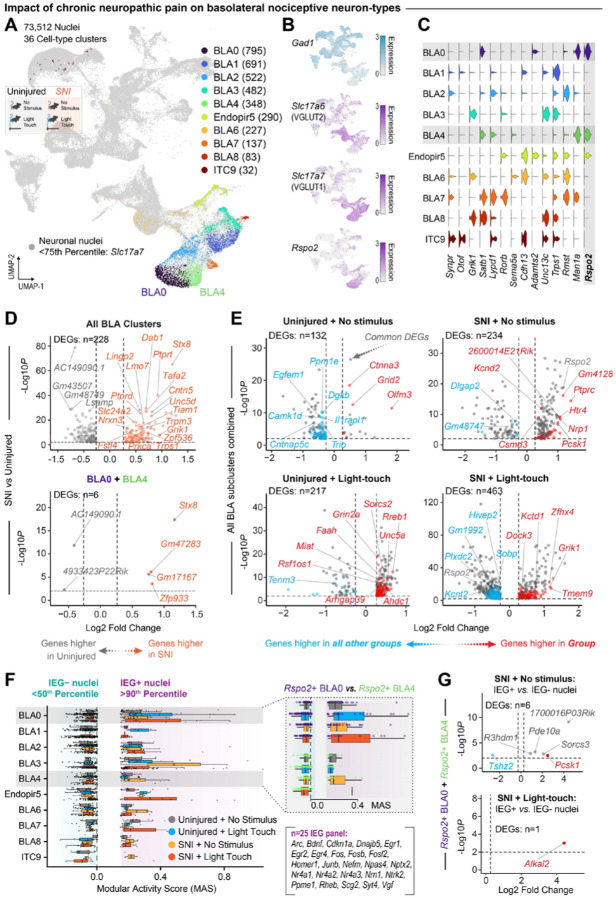
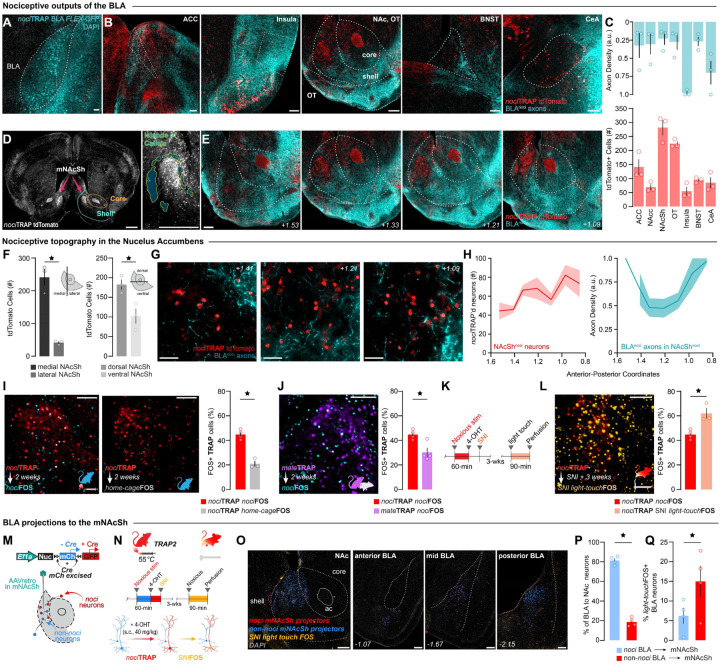
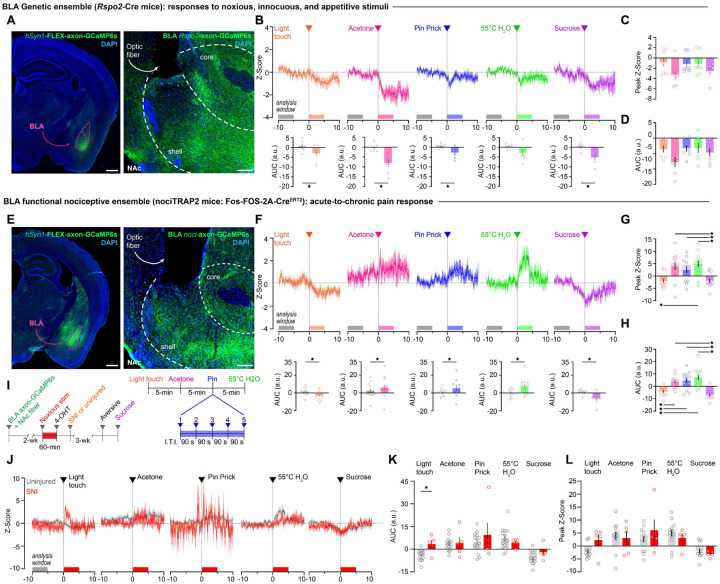
The basolateral amygdala (BLA) is essential for assigning positive or negative valence to sensory stimuli. Noxious stimuli that cause pain are encoded by an ensemble of nociceptive BLA projection neurons (BLA noci ensemble). However, the role of the BLA noci ensemble in mediating behavior changes and the molecular signatures and downstream targets distinguishing this ensemble remain poorly understood. Here, we show that the same BLA noci ensemble neurons are required for both acute and chronic neuropathic pain behavior. Using single nucleus RNA-sequencing, we characterized the effect of acute and chronic pain on the BLA and identified enrichment for genes with known functions in axonal and synaptic organization and pain perception. We thus examined the brain-wide targets of the BLA noci ensemble and uncovered a previously undescribed nociceptive hotspot of the nucleus accumbens shell (NAcSh) that mirrors the stability and specificity of the BLA noci ensemble and is recruited in chronic pain. Notably, BLA noci ensemble axons transmit acute and neuropathic nociceptive information to the NAcSh, highlighting this nociceptive amygdala-striatal circuit as a unique pathway for affective-motivational responses across pain states.


Conflict of interest statement

B.C.R. receives research funding from Novo Nordisk and Boehringer Ingelheim that was not used in support of these studies. The other authors declare no competing interests.

Figures

Figure 1.
Figure 1.. Inhibition of the BLAnoci ensemble reduces pain aversion in acute and chronic pain.
(A) Nociceptive TRAP (nociTRAP) protocol. (B) Representative images of neurons captured by nociTRAP tdTomato (red) and nociFOS (blue) with quantification of (C) nociTRAP (D) and nociFOS across the anterior-posterior axis of the basolateral amygdala (BLA), lateral amygdala (LA), and basal amygdala (BA). Scale: 250 μm. (E) Quantification of the colocalization of nociTRAP and nociFOS in neurons across the LA, BA, and BLA (n = 4). (F) Representative images of nociTRAP colocalization with nociFOS (blue) vs home-cageFOS (grey) and quantification (Two-tailed unpaired t test, p =0.0379, n = 4 nociFOS, n = 3 home-cageFOS). Scale: 100 μm. (G) Colocalization of mateTRAP (purple) and nociFOS (blue). Scale: 100 μm. Quantification of colocalization of nociFOS with neurons captured by mateTRAP relative to nociTRAP. (Two-tailed unpaired t test, p =0.0042, n = 4 nociTRAP, n = 3 mateTRAP). (H) Schematic and timeline of spared nerve injury (SNI) model of chronic neuropathic pain. (I) Colocalization of uninjured nociTRAP (red) and light-touch after SNI FOS (orange). Scale: 100 μm. Quantification of colocalization of light-touchFOS in animals than underwent SNI relative to a second acute nociceptive stimulus in uninjured mice. (Two-tailed unpaired t test, p =0.0632, n = 4 nociFOS, n = 3 SNI light-touchFOS). (J) Timeline of optogenetic inhibition experiment. (K) Schematic of inhibitory opsin. (L) Histological confirmation of bilateral expression of stGtACR2 in BLAnoci ensemble with bilateral fiber optics above. Scale: 500 μm (left image), 250 μm (right image). (M) Image of behavioral testing setup. (N) Optogenetic inhibition of the BLAnoci ensemble decreases behavioral responding to noxious stimuli compared to a pre-stimulus baseline. (One-way repeated-measure ANOVA with Bonferroni; acetone: main effect of interaction: p = 0.0032, light ON stGtACR2 vs tdTomato: p = 0.0134; 55°C water: main effect of mouse: p = 0.0161, stGtACR2 light OFF vs light ON: p = 0.0249; n = 16 StGtACR2 (8 male), n = 7 tdTomato (2 male)). (O) Mice that received a SNI to induce chronic neuropathic pain showed hypersensitivity three weeks post-SNI. (Two-Way repeated-measure ANOVA with Bonferroni, main effect of interaction: p = 0.0007, SNI group baseline vs. 3-weeks post-SNI: p <0.0001, 3-weeks post-SNI uninjured vs. SNI: p = 0.0029). (P) Increased responding to innocuous and noxious stimuli was reduced during inhibition of the BLAnoci ensemble compared to pre-stimulus baselines. (Three-way ANOVA with Tukey; von Frey: main effects of virus (p = 0.0099), injury (p <0.0001), interaction of virus and injury (p = 0.0095), LED OFF Uninjured StGtACR2 vs tdTomato: p = 0.0003, LED ON StGtACR2 uninjured vs SNI: p = 0.0101, LED OFF tdTomato uninjured vs SNI: p <0.0001, LED ON tdTomato uninjured vs SNI: p = 0.0012; acetone: main effect of interaction: p = 0.0483, SNI StGtACR2 LED ON vs LED OFF: p = 0.0346; 55°C water: main effects of LED (p =0.0341) and interaction of LED and virus (p = 0.0067), StGtACR2 SNI LED OFF vs LED ON: p = 0.0089). (Pin prick: Mixed effects analysis with Tukey, main effect of interaction: p = 0.0261, StGtACR2 LED OFF uninjured vs SNI: p = 0.0143, StGtACR2 SNI LED OFF vs LED ON: p = 0.0060). N = 7 StGtACR2 uninjured (4 male), n = 9 StGtACR2 SNI (4 male), n = 4 tdTomato uninjured (2 male), n = 3 tdTomato SNI (all female)). BLA = basolateral amygdala.
Figure 2.
Figure 2.. The BLAnoci ensemble is a functional subpopulation of Rspo2 BLA neurons.
(A) Timeline, experimental design, and methods. (B) UMAP of all nuclei (n = 72,125) captured by punches around the amygdala in 30 unique clusters. (C, D) Contribution of nuclei from various stimulation conditions to the total UMAP and cell types. (E, F) Dotplot and heatmap displaying a top gene differentiating the 30 cell clusters. (G) UMAP of amygdalar neuron nuclei (n = 51,775) showing 13 inhibitory (Gad1+ or Gad2+) and 10 BLA (Vglut1+) putative clusters. (H) Heatmap displaying top genes differentiating the 23 neural clusters. (I) Feature plots of select genes for cell classes, published gene markers for valence/nociception in the BLA and CeA, and immediate early genes (IEGs). (J) Representative 4X and 20X fluorescent images and quantification of RNAscope fluorescent in situ hybridization (FISH) showing that BLAnoci neurons largely express Rspo2 but are a subpopulation of all BLA Rspo2+ neurons. Scale: 100 μm. (K) Violin plot displaying expression of genes identified in past BLA RNA sequencing, including expression of Rspo2, by subcluster. (L) Volcano plot of 350 differentially expressed genes (DEGs) between Rspo2+ BLA clusters 0 and 4. Yellow dots indicate genes enriched in the BLA subcluster and orange dots indicate genes enriched in the BLA4 subcluster. (M) IEG modular activity scores of 10 putative BLA clusters across stimulation conditions segregated by percentile thresholds. (N) Volcano plots of BLA clusters 0 and 4 displaying DEGs upper stimulation condition enriched in the IEG+ or IEG− nuclei. Purple dots = DEGs only identified within that condition. Grey dots = shared DEGs across conditions.
Figure 3.
Figure 3.. Chronic pain imparts a unique transcriptomic signature on the BLA.
(A) UMAP of all neuronal nuclei (n = 73,512) across uninjured and chronic neuropathic pain (SNI) conditions identifying 36 unique cell-type clusters. (B) Feature plots of genes for cell classes and for Rspo2. (C) Violin plot displaying expression of genes identified in past BLA RNA sequencing, including expression of Rspo2, by subcluster. (D) Volcano plots of all BLA subclusters combined (top) or subclusters BLA0 and BLA4 combined (bottom) displaying DEGs in all nuclei from SNI mice compared to nuclei from uninjured mice. Orange dots indicate genes enriched in SNI conditions, gray dots indicate genes enriched in uninjured conditions. (E) Volcano plots of all BLA subclusters combined displaying DEGs unique across injury and stimulation conditions. Red dots indicate genes enriched in that condition, blue dots indicate genes enriched in all other conditions, and grey dots indicate shared DEGs across conditions. (F) IEG modular activity scores of 10 putative BLA clusters across stimulation conditions. (G) Volcano plots of Rspo2+ BLA subclusters 0 and 4 displaying DEGs unique between IEG+ and IEG− nuclei in SNI. Red dots indicate genes enriched in that condition, blue dots indicate genes enriched in all other conditions, and grey dots indicate shared DEGs across conditions.
Figure 4.
Figure 4.. The BLAnoci ensemble projects to a nociceptive hotspot in the dorsomedial NAcSh.
(A) Viral expression of AAV5-hSyn-FLEX-GFP in the right BLAnoci ensemble of TRAP2 mice. Scale: 100 μm. (B) BLAnoci ensemble axons (blue) in areas with nociceptive neurons expressing tdTomato (red). Scale: 200 μm. (C) Quantification of BLAnoci axon density by area (blue) and tdTomato (red) in ipsilateral regions of interest. (D) nociTRAP captures a nociceptive hotspot in the dorsomedial NAcSh (NAcShnoci) encompassed by the Islands of Calleja. Scale: 500 μm. (E) BLAnoci ensemble axons and NAcShnoci neurons spread throughout the anterior-posterior axis of the NAc. Scale: 200 μm. (F) Quantification of tdTomato NAcSh neurons in the medial vs lateral shell (Two-tailed paired t test, p = 0.0115) and in the dorsal vs ventral shell (Two-tailed paired t test, p = 0.0409). (G) 60X images showing BLAnoci ensemble axons in close proximity to NAcShnoci neurons. Scale: 50 μm. (H) Quantification of NAcShnoci neurons and BLAnoci ensemble axon density by area across the anterior-posterior axis of the ipsilateral NAc (n = 3 males). (I) Representative images of nociTRAP colocalization with nociFOS (blue) vs home-cageFOS (grey) (Two-tailed unpaired t test, p =0.0005, n = 4 nociFOS, n = 3 home-cageFOS). Scale: 100 μm. (J) Colocalization of mateTRAP (purple) and nociFOS (blue). Scale: 100 μm. Quantification of colocalization of nociFOS with neurons captured by mateTRAP relative to nociTRAP. (Two-tailed unpaired t test, p =0.0190, n = 4 nociTRAP, n = 3 mateTRAP). (K) Timeline of spared nerve injury (SNI) model of chronic neuropathic pain. (L) Colocalization of uninjured nociTRAP (red) and light-touch after SNI FOS (orange). Scale: 100 μm. Quantification of colocalization of light-touchFOS in animals than underwent SNI relative to a second acute nociceptive stimulus in uninjured mice. (Two-tailed unpaired t test, p =0.0096, n = 4 nociFOS, n = 3 SNI light-touchFOS). (M) Schematic of retrograde tracing in the mNAcSh. (N) Timeline and schematic of retrograde labeling and reactivation of afferents to the mNAcSh. (O) Representative images of the injection site in the mNAcSh and the anterior, mid and posterior BLA. Scale: 200 μm. (P) Quantification of nociceptive and non-nociceptive BLA neurons that project to the mNAcSh. (Two-tailed paired t test, p = 0.0007). (Q) Quantification of light-touchFOS colocalization in nociceptive and non-nociceptive BLA neurons that project to the mNAcSh. (Two-tailed paired t test, p =0.0191, n = 4 (1 male)). BLA = basolateral amygdala, ACC = anterior cingulate cortex, NAc = nucleus accumbens, OT = olfactory tubercle, BNST = bed nucleus of the stria terminalis, CeA = central amygdala, mNAcSh = medial nucleus accumbens shell.
Figure 5.
Figure 5.. The BLA transmits nociceptive information to the dorsomedial NAcSh.
(A) Expression of AAV5-hSyn1-FLEX-axon-GCaMP6s in the BLA of Rspo2-Cre mice; Expression of axon-GCaMP6s in the NAcSh with an optic fiber placed above the mNAcSh. Scale: 500 μm (left image), 100 μm (right image). (B) BLA Rspo2 axon terminals in the NAcSh display significantly decreased Ca2+ activity in response to innocuous, noxious, and appetitive stimuli compared to pre-stimulus baselines. (Two-tailed paired t test, light touch: p = 0.0196; acetone: p = 0.0027; pin prick: p = 0.0242; 55°C water: p = 0.0849; sucrose: p = 0.0062). (C) Quantification of peak Z-Score of all stimuli. (Mixed-effects analysis, p = 0.2213, n = 7). (D) Quantification of area under the curve (A.U.C) of all stimuli. (Mixed-effects analysis, p = 0.1178; n = 7 (4 males); n = 6 for sucrose. (E) Expression of AAV5-hSyn1-FLEX-axon-GCaMP6s in the BLAnoci ensemble of TRAP2 mice; Expression of axon-GCaMP6s in the NAcSh with an optic fiber placed above the mNAcSh. Scale: 500 μm (left image), 100 μm (right image). (F) BLAnoci ensemble axon terminals in the NAcSh display significantly increased Ca2+ activity in response to noxious stimuli compared to pre-stimulus baselines. (Two-tailed paired t test, acetone: p = 0.0173; pin prick: p = 0.0288; 55°C water: p = 0.0044, n = 13). In contrast, BLAnoci ensemble axon terminals display decreased Ca2+ activity in response to innocuous and appetitive stimuli compared to pre-stimuli baselines. (Two-tailed paired t test, light touch: p = 0.0013; sucrose: p = 0.0004, n = 13). (G) The peak Z-Score of Ca2+ responses to noxious stimuli is significantly different from the response to innocuous and appetitive stimuli. (Mixed-effects analysis with Bonferroni, p = 0.0001; light touch vs. 55°C water: p = 0.004, sucrose vs. acetone: p = 0.0328, sucrose vs. pin prick: p = 0.0566, sucrose vs. 55°C water: p = 0.0133; n = 13 (6 males)). (H) Quantification of A.U.C. of all stimuli. (Mixed-effects analysis with Bonferroni, p < 0.0001; light touch vs. acetone: p = 0.0009, light touch vs. pin prick: p = 0.001, light touch vs. 55°C water: p = 0.0014, sucrose vs. acetone: p = 0.0003, sucrose vs. pin prick: p = 0.0006, sucrose vs. 55°C water: p = 0.0013; n = 13 (6 males)). (I) Timeline for recording Ca2+ responses after before and after SNI; stimulation and recording paradigm. (J) BLAnoci ensemble axons in the NAcSh display increased Ca2+ activity in response to a light touch compared to uninjured mice. Ca2+ responses to other noxious or appetitive stimuli were unchanged in SNI. (K) The A.U.C. was elevated in response to a light touch in mice with SNI compared to uninjured mice. (Mixed-effects analysis with Bonferroni; main effect of stimulus: p = 0.0009; light touch SNI vs uninjured: p = 0.0388; n = 13 uninjured (6 males), n = 5 SNI (2 males)). (L) The peak Z-Score of the Ca2+ responses to stimuli was not significantly different between uninjured and SNI mice. (Mixed-effects analysis with Bonferroni; main effect of stimulus: p = 0.0002; n = 13 uninjured, n = 5 SNI). A.U.C. = area under the curve (arbitrary units) calculated as A.U.C. post-stimulus (0 to 5 seconds) minus A.U.C. pre-stimulus (−10 to −5 seconds). Peak Z-score is calculated over 10 seconds post-stimulus. BLA = basolateral amygdala, NAc = nucleus accumbens.

Similar articles

Cited by

References

    1. Kimmey B. A., McCall N. M., Wooldridge L. M., Satterthwaite T. D., Corder G., Engaging endogenous opioid circuits in pain affective processes. J Neurosci Res 100, 66–98 (2022). - PMC - PubMed
    1. Kuner R., Kuner T., Cellular Circuits in the Brain and Their Modulation in Acute and Chronic Pain. Physiol Rev 101, 213–258 (2021). - PubMed
    1. Pignatelli M., Beyeler A., Valence coding in amygdala circuits. Curr Opin Behav Sci 26, 97–106 (2019). - PMC - PubMed
    1. Gore F., Schwartz E. C., Brangers B. C., Aladi S., Stujenske J. M., Likhtik E., Russo M. J., Gordon J. A., Salzman C. D., Axel R., Neural representations of unconditioned stimuli in basolateral amygdala mediate innate and learned responses. Cell 162, 134–145 (2015). - PMC - PubMed
    1. Janak P. H., Tye K. M., From circuits to behaviour in the amygdala. Nature 517, 284–292 (2015). - PMC - PubMed

Publication types