[Preprint]. 2024 Feb 18:2024.02.18.580354.
doi: 10.1101/2024.02.18.580354.

Mice lacking Astn2 have ASD-like behaviors and altered cerebellar circuit properties

Affiliations

Mice lacking Astn2 have ASD-like behaviors and altered cerebellar circuit properties

Michalina Hanzel et al. bioRxiv. .

Update in

Abstract

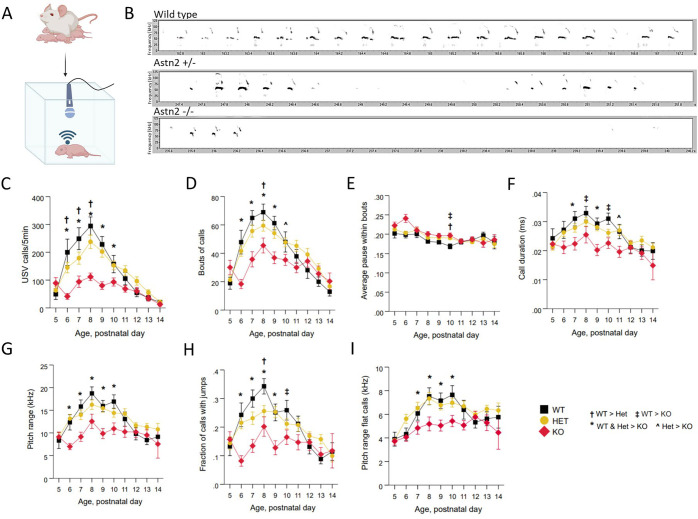
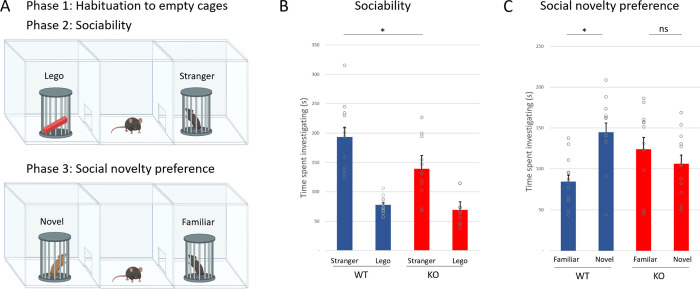
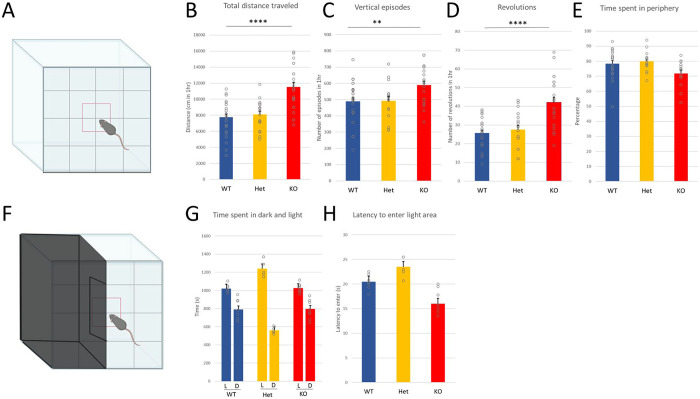
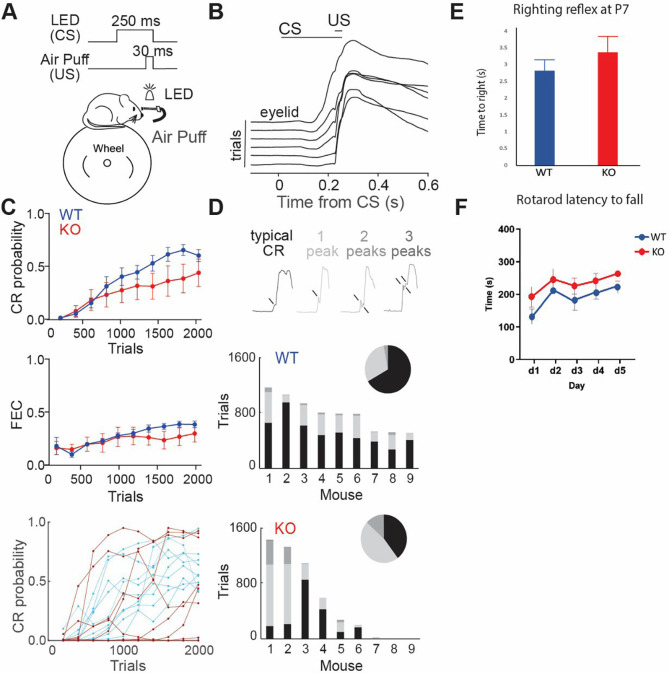
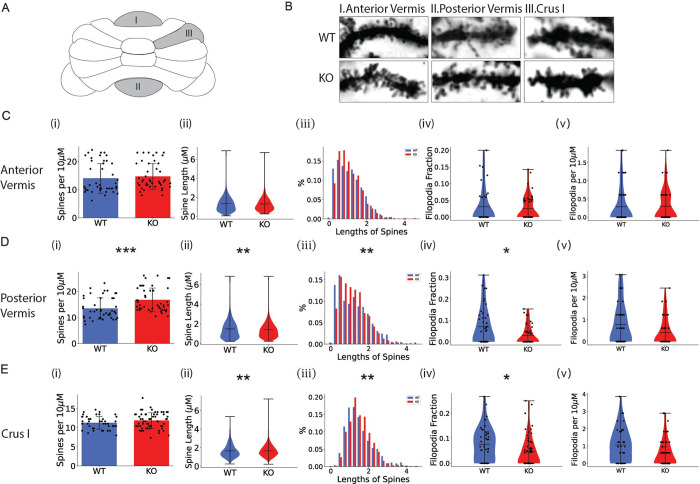
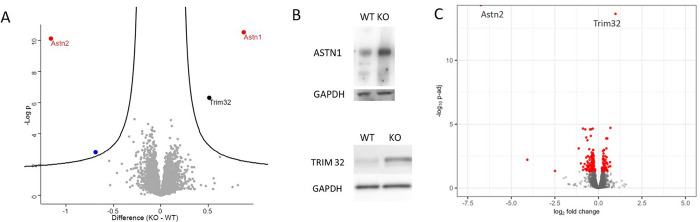
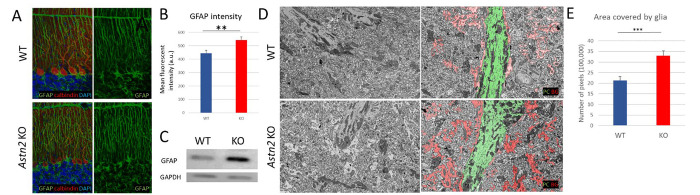
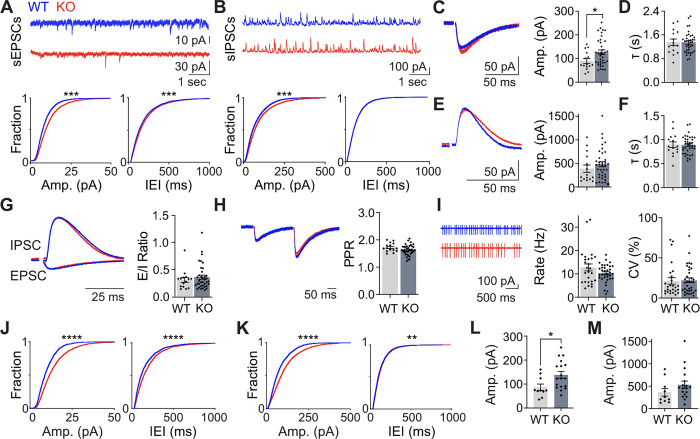
Astrotactin 2 (ASTN2) is a transmembrane neuronal protein highly expressed in the cerebellum that functions in receptor trafficking and modulates cerebellar Purkinje cell (PC) synaptic activity. We recently reported a family with a paternally inherited intragenic ASTN2 duplication with a range of neurodevelopmental disorders, including autism spectrum disorder (ASD), learning difficulties, and speech and language delay. To provide a genetic model for the role of the cerebellum in ASD-related behaviors and study the role of ASTN2 in cerebellar circuit function, we generated global and PC-specific conditional Astn2 knockout (KO and cKO, respectively) mouse lines. Astn2 KO mice exhibit strong ASD-related behavioral phenotypes, including a marked decrease in separation-induced pup ultrasonic vocalization calls, hyperactivity and repetitive behaviors, altered social behaviors, and impaired cerebellar-dependent eyeblink conditioning. Hyperactivity and repetitive behaviors were also prominent in Astn2 cKO animals. By Golgi staining, Astn2 KO PCs have region-specific changes in dendritic spine density and filopodia numbers. Proteomic analysis of Astn2 KO cerebellum reveals a marked upregulation of ASTN2 family member, ASTN1, a neuron-glial adhesion protein. Immunohistochemistry and electron microscopy demonstrates a significant increase in Bergmann glia volume in the molecular layer of Astn2 KO animals. Electrophysiological experiments indicate a reduced frequency of spontaneous excitatory postsynaptic currents (EPSCs), as well as increased amplitudes of both spontaneous EPSCs and inhibitory postsynaptic currents (IPSCs) in the Astn2 KO animals, suggesting that pre- and postsynaptic components of synaptic transmission are altered. Thus, ASTN2 regulates ASD-like behaviors and cerebellar circuit properties.


Figures

Figure 1:
Figure 1:. Loss of Astn2 results in fewer and less dynamic ultrasonic vocalizations in the mouse pups.
A) Pups were isolated from their mothers at postnatal days (P)5 – P14 and placed in a soundproof chamber fitted with an ultrasonic microphone. Ultrasonic vocalizations (USVs) were recorded for 5 mins. B) Sample spectrograms illustrating the differences in USVs from P7 wild type (WT) (n = 20), heterozygous (HET) (n = 52) and Astn2 KO (n = 24) animals (frequency in kHz as a function of time). Loss of ASTN2 expression robustly influenced USV production and dynamics on a number of measures at P6-P10: C) Number of USV calls during the 5-minute recording session was reduced in Astn2 KOs. Heterozygous animals showed a significant reduction at P6-P8. D) Bouts of calls were reduced in Astn2 KOs. E) Average pause within bouts was reduced in Astn2 KOs at P10. F) Call duration was reduced in Astn2 KOs. G) Pitch range of all USV calls was reduced in Astn2 KOs. H) Fraction of calls that are dynamic (contain a pitch jump) was reduced in Astn2 KOs. Heterozygous animals show a reduction in dynamic calls at P8. I) Range of frequency pitch for flat calls was reduced in Astn2 KOs at P7-P10.
Figure 2:
Figure 2:. Social behavior is altered in the Astn2 KO mice.
A) The three-chamber social test was performed on 8–12-week-old animals (n = 12 WT, 11 KO). The test consisted of three phases, starting with a 10-minute habituation to the empty cages, followed by two 10-minute testing phases. In phase 2, to test sociability, mice were exposed to a non-social (Lego block) and a social stimulus (stranger mouse). In phase 3, to test social novelty preference, the non-social stimulus was replaced by a novel mouse. The familiar mouse from phase 2 was left in their cage. The time spent interacting with the stimuli was manually scored by the investigator. B) In the first phase of the experiment, WT mice show a strong preference for the social stimulus (p <0.0001). Astn2 KO animals also show a preference for the social stimulus (p= 0.001), however, the absolute time they spend interacting with the social stimulus is significantly reduced as compared to the WT (p= 0.027). C) In the third phase of the experiment, WT animals interact with the novel animals significantly longer than with the familiar animals (p= 0.0003). In contrast, the Astn2 KO animals do not show a preference for the novel animal and spend as much time with the familiar animal as with the novel animal (p = 0.35). Data is presented as the mean + SEM. *p < 0.05, **p < 0.01, ***p <0.001, ****p <0.0001, ns= not significant
Figure 3:
Figure 3:. Astn2 KO mice show hyperactivity and repetitive behaviors, but not anxiety, in the open field test.
A) 8–12 weeks old wild type (n = 29), heterozygous (n = 17) and Astn2 KO (n = 23) animals were placed in an open field arena for 1 hour and allowed to explore freely. The center of the arena was assigned in the software. B) The total distance traveled was increased significantly in the KO animals (p < 0.0001). C) The number of vertical episodes (rearing) was significantly increased in the Astn2 KOs as compared to WTs and Hets (p = 0.005). D) The number of revolutions (circling) was significantly increased in the Astn2 KOs (p < 0.0001). E) Time spent in the center versus the periphery of the arena was measured. Astn2 KOs spend less time in the periphery of the arena (p = 0.026). F) A subset of animals (n = 7 WT, 5 Het, 8 KO) were tested in a light/dark open field paradigm where a black box covers half of the arena. G) All genotypes spent significantly more time in the light part of the arena (L) versus the dark part (D) and there were no differences in the amount to time spent in the light (L) versus the dark (D) between WT and KO animals (p = 0.9). Het animals spent significantly more time in the light compared to WT and KO animals (p < 0.0001). H) The latency to enter the light compartment significantly decreased in the Astn2 KO (p < 0.0001). Data is presented as the mean + SEM. Data analyzed with One way ANOVA with Tukey Kramer post-hoc test *p < 0.05, **p < 0.01, ***p <0.001, ****p <0.0001
Figure 4.
Figure 4.. Astn2 KO mice show abnormal cerebellar-dependent associative learning but normal righting reflex and rotarod behavior.
A) Behavioral configuration for delay eyeblink conditioning. Mice (8–15 weeks old, N = 9/genotype) were head-fixed and could run freely on a cylindrical treadmill while high-speed videography recorded eyelid position during stimuli presentation. B) Selected average eyelid traces (100-trial average) over the course of training from an example WT mouse in response to a 250-ms LED conditioned stimulus (CS) co-terminating with the delivery of a 30-ms aversive air puff unconditioned stimulus (US). C) Top, binned conditioned response (CR) probability over training (200-trial average). Middle, binned CR amplitude (fraction of eyelid closed (FEC), 200-trial average) over training with CRs preserved in trial space. Bottom, CR probability plotted for individual WT (light blue) and KO (maroon) mice. D) Top, example eyelid traces showing various CR topographies observed during CS-US trials. CRs with three peaks comprised <1% of all observed CRs. Middle insert, detected CR peaks from all CS-US trials of all WT mice (N = 7128 trials). Middle, proportional contribution of individual WT mice. Bottom inset, same as middle inset, for all CS-US trials of all KO mice (N = 4943 trials). Bottom, same as middle, for individual KO mice. E) P7 wild type (n = 12) and Astn2 KO (n = 13) pups were evaluated using the righting reflex assay by placing pups in a supine position. Time to completely right themselves was recorded. No difference was found between WT and KO animals. F) 8–12 week old wild type (n = 8) and Astn2 KO (n = 10) animals were placed on an accelerating rotarod for five consecutive days (d). An average of three trials per day was recorded. Time to fall from the rotarod was measured. WT and Astn2 KO animals did not show significantly different results in their latency to fall. Data is presented as the mean ± SEM.
Figure 5:
Figure 5:. Cerebellar lobule-specific changes in Purkinje cell dendritic spine numbers and morphology in Astn2 KO mice.
A) Schematic of a mouse cerebellum. I marks the anterior vermis (lobule III), II marks the posterior vermis (lobule XI), and III marks Crus I. B) Example images of sampled dendritic segments with dendritic spines in the anterior vermis, the posterior vermis, and Crus I, in WT (top panels) and Astn2 KO (bottom panels). C-E) Analysis of PC dendritic spines in WT and Astn2 KO animals in (C) the Anterior Vermis, (D) the Posterior Vermis and (E) Crus I. (i) The number of spines per 10μm dendrite segment. *** p < 0.001, Wilcoxon rank-sum test. (ii) The distribution of spine lengths with all sampled dendritic segments pooled together. ** p < 0.01, two-sample Kolmogorov-Smirnov test. (iii) Detailed histogram visualization of (ii), showing the percentage proportions of each length bracket. ** p < 0.01, two-sample Kolmogorov-Smirnov test. (iv) Distribution of the fractions of filopodia on each sampled dendritic segment. * p < 0.05, two-sample Kolmogorov-Smirnov test. (v) Distribution of the total number of filopodia on each sampled dendritic segment. * p < 0.05, two-sample Kolmogorov-Smirnov test.
Figure 6:
Figure 6:. Astn2 KO mice have increased levels of ASTN1 that is post transcriptionally regulated.
A) Proteomic analysis of Astn2 KO animals at P22. A volcano plot depicting differentially expressed proteins in whole cerebellar lysates of Astn2 KO animals and wild type littermates (n = 8 WT, 8 KO). ASTN2 is downregulated and ASTN1 and TRIM32 are upregulated in Astn2 KO animals. B) Western blot showing the upregulation of ASTN1 and TRIM32 in P22 cerebellar samples. C) Volcano plot depicting differentially expressed genes (P-adj<0.05, indicated with red) in P22 Astn2 KO cerebellum, compared with WT littermates, identified using DESeq2. Astn1 gene is not upregulated suggesting that ASTN1 protein overexpression is post transcriptionally regulated in Astn2 KO animals.
Figure 7:
Figure 7:. Astn2 KO mice have an increase in Bergmann glia.
A) Immunohistochemistry with antibodies against GFAP (a Bergmann glia marker), calbindin (a PC marker) and Hoechst in P22 Astn2 KO mice (bottom) and WT littermates (top) (left panels). An increase in GFAP signal as well as disorganization of BG fibers is observed in Astn2 KO mice (right panels). B) Astn2 KO mice have a higher mean fluorescent intensity of GFAP staining indicating an increase in Bergmann glia. C) Western blot for GFAP in P22 cerebellar tissue of Astn2 KO mice. There is an increase in amount of GFAP protein in Astn2 KO mice. D) Electron microscopy imaging of WT (top panels) Astn2 KO (bottom panels) cerebellar molecular layer at P22. An example image of 2900x direct magnification EM image (left panel) and a pseudocolored EM image revealing a PC dendrite (green) and Bergmann glia fibers (red) (right panel). E) Quantification of the area covered by glia in EM images in WT and Astn2 KO animals. There is a significant increase in Bergmann glia fibers in the Astn2 KO. 3 mice per genotype for all datasets. Data is presented as the mean + SEM. Data analyzed with Student’s T test *p < 0.05, **p < 0.01, ***p <0.001
Figure 8:
Figure 8:. Astn2 KO mice show differences in spontaneous and evoked synaptic currents.
A) Top, spontaneous excitatory postsynaptic currents (sEPSCs) in whole-cell recordings (Vm = −70 mV) of Purkinje cells (PCs). Bottom left, cumulative distribution of sEPSC amplitudes. ***p < 0.001, Wilcoxon rank-sum. Bottom right, same as left, for inter-event interval (IEI). ***p < 0.001, Wilcoxon rank-sum. B) Top, spontaneous inhibitory postsynaptic currents (sIPSCs) in whole-cell recordings of PCs (Vm = 0 mV). Bottom left, cumulative distribution of sIPSC amplitudes. ***p < 0.001, Wilcoxon rank-sum. Bottom right, same as left, for IEI. C) Left, example of mean evoked EPSC in whole-cell recordings of PCs (Vm = -70 mV). Right, summary of EPSC amplitudes across cells. *p < 0.05, unpaired Student’s t-test. D) Summary of EPSC decay kinetics (τ) across cells. E) Left, example of mean evoked IPSC in whole-cell recordings of PCs (Vm = 0 mV). Right, summary of IPSC amplitudes across cells. F) Summary of IPSC τ across cells. G) Left, example of mean evoked EPSC and IPSC from an individual WT and KO PC. KO traces scaled to the WT EPSC. Right, summary of the ratios of excitation to inhibition (E/I ratio) across cells. H) Left, example of mean evoked EPSCs from an individual WT and KO PC. KO traces scaled to the first WT EPSC. Right, summary of paired-pulse ratios (PPR) across cells. I) Left, example of mean extracellular recordings of PC spiking activity from an individual WT and KO PC. Middle, summary of spike rates across cells. Right, summary of coefficients of variation (CV) across cells. J) Left, cumulative distribution of sEPSC amplitudes of PCs in posterior vermis. ****p < 0.0001, Wilcoxon rank-sum. Right, same as left, for IEIs. ****p < 0.0001, Wilcoxon rank-sum. K) Left, cumulative distribution of sIPSC amplitudes of PCs in posterior vermis. ****p < 0.0001, Wilcoxon rank-sum. Right, same as left, for IEIs. **p < 0.01, Wilcoxon rank-sum. L) Summary of EPSC amplitudes across PCs in posterior vermis. *p < 0.05, unpaired Student’s t-test. M) Summary of IPSC amplitudes across PCs in posterior vermis. Error bars ±SEM.

Similar articles

References

    1. Behesti H., Fore T.R., Wu P., Horn Z., Leppert M., Hull C., and Hatten M.E. (2018). ASTN2 modulates synaptic strength by trafficking and degradation of surface proteins. Proceedings of the National Academy of Sciences. 10.1073/pnas.1809382115. - DOI - PMC - PubMed
    1. Fishell G., and Hatten M.E. (1991). Astrotactin provides a receptor system for CNS neuronal migration. Development 113, 755–765. 10.1242/DEV.113.3.755. - DOI - PubMed
    1. Adams N.C., Tomoda T., Cooper M., Dietz G., and Hatten M.E. (2002). Mice that lack astrotactin have slowed neuronal migration. Development 129. 10.1242/dev.129.4.965. - DOI - PubMed
    1. Wilson P.M., Fryer R.H., Fang Y., and Hatten M.E. (2010). Astn2, a novel member of the astrotactin gene family, regulates the trafficking of ASTN1 during glial-guided neuronal migration. Journal of Neuroscience 30. 10.1523/JNEUROSCI.0032-10.2010. - DOI - PMC - PubMed
    1. Zheng C., Heintz N., and Hatten M.E. (1996). CNS gene encoding astrotactin, which supports neuronal migration along glial fibers. Science 272, 417–419. 10.1126/SCIENCE.272.5260.417. - DOI - PubMed

Publication types