[Preprint]. 2024 Mar 26:2024.02.12.579184.
doi: 10.1101/2024.02.12.579184.

Disrupting CD38-driven T cell dysfunction restores sensitivity to cancer immunotherapy

Affiliations

Disrupting CD38-driven T cell dysfunction restores sensitivity to cancer immunotherapy

Or-Yam Revach et al. bioRxiv. .

Abstract

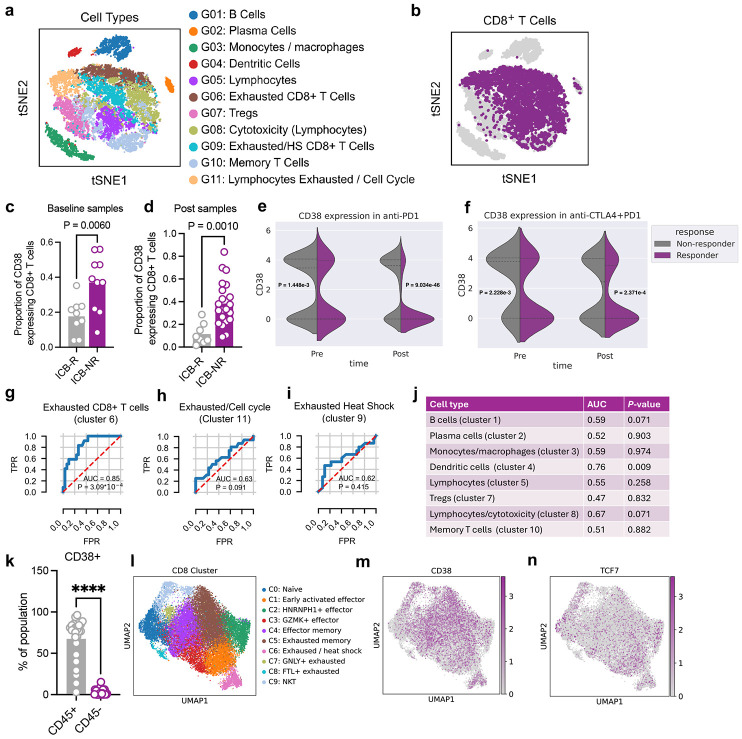
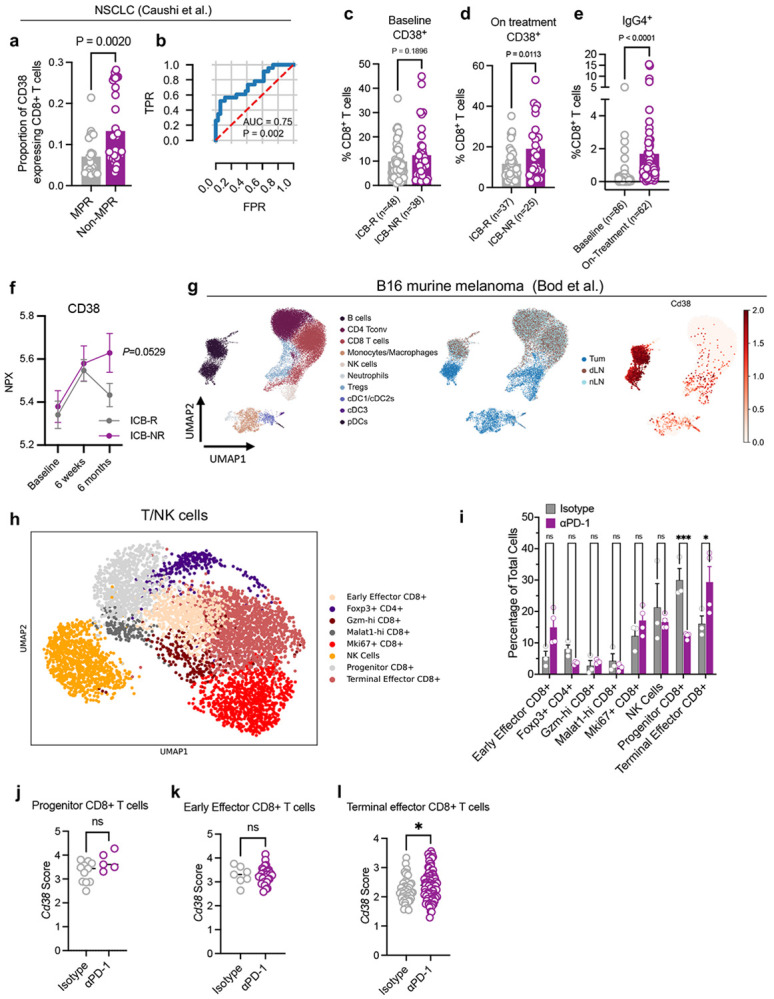
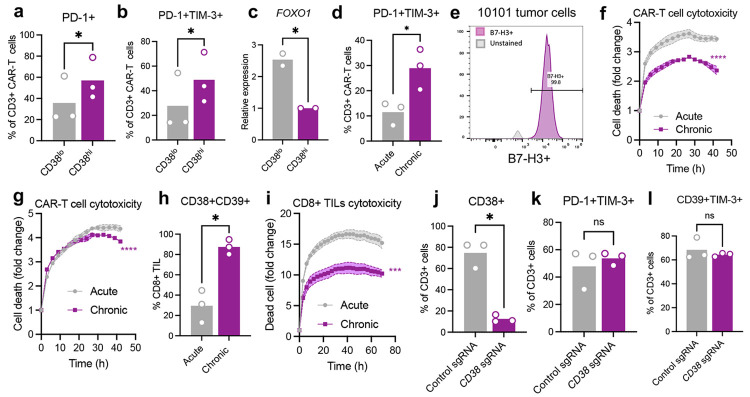
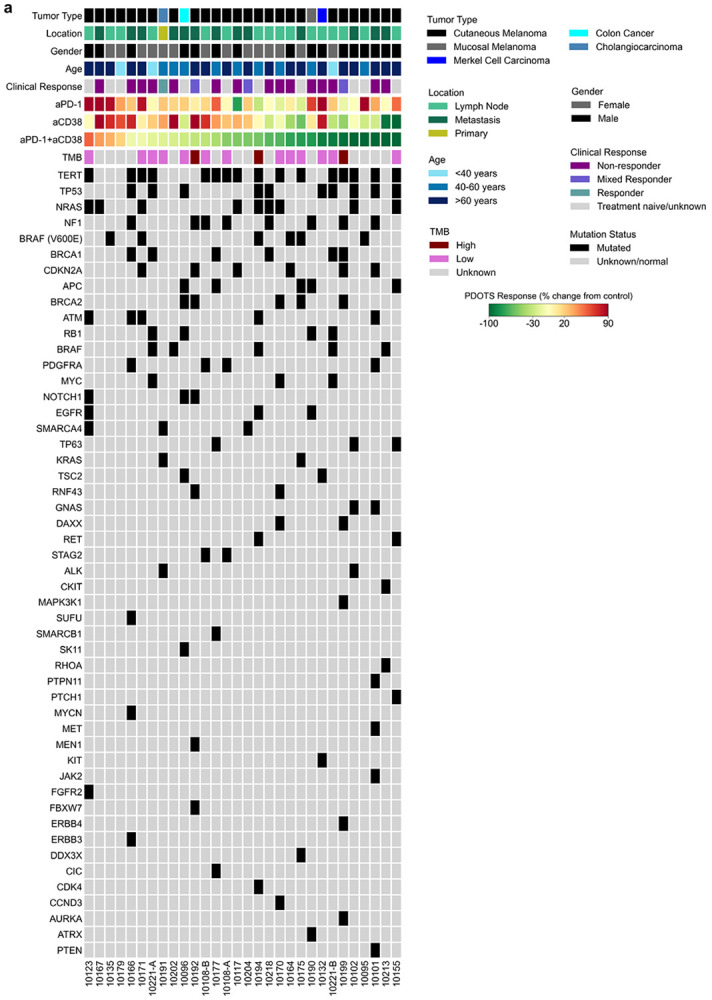
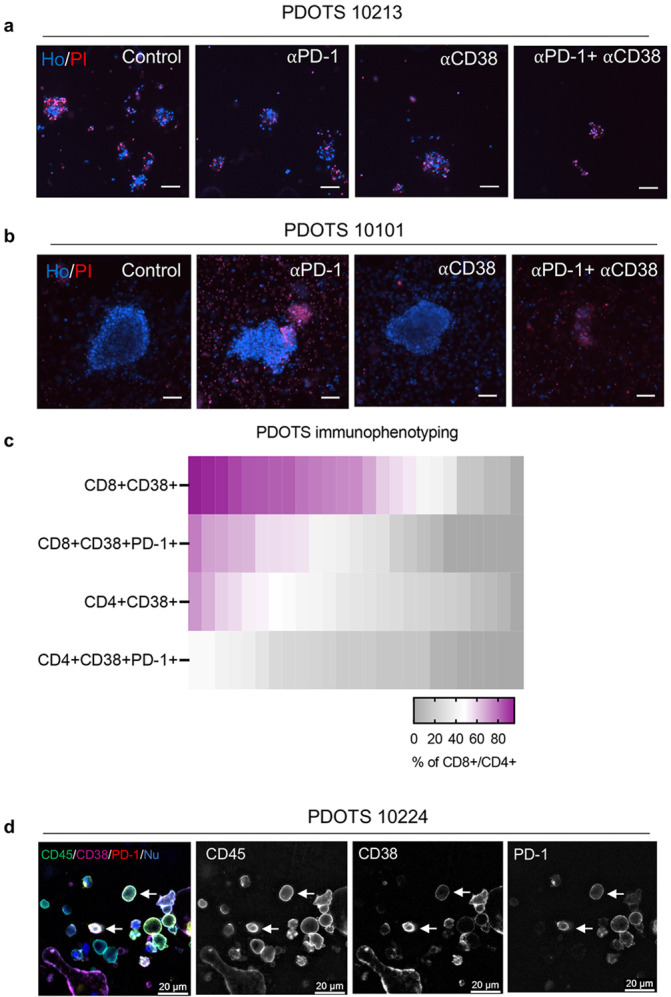
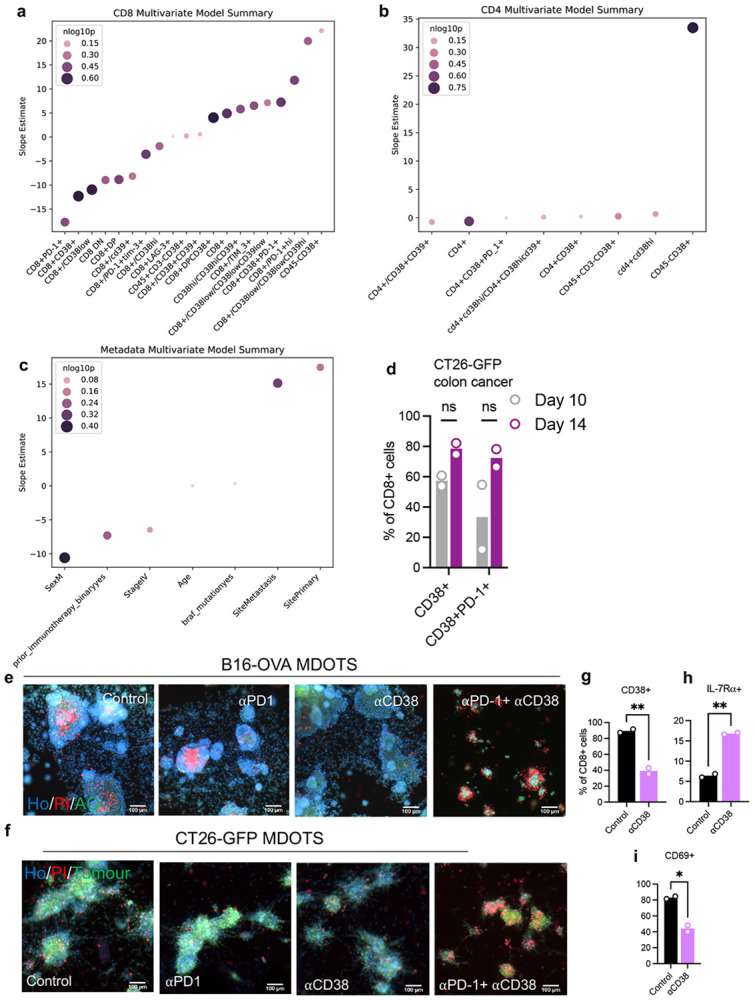
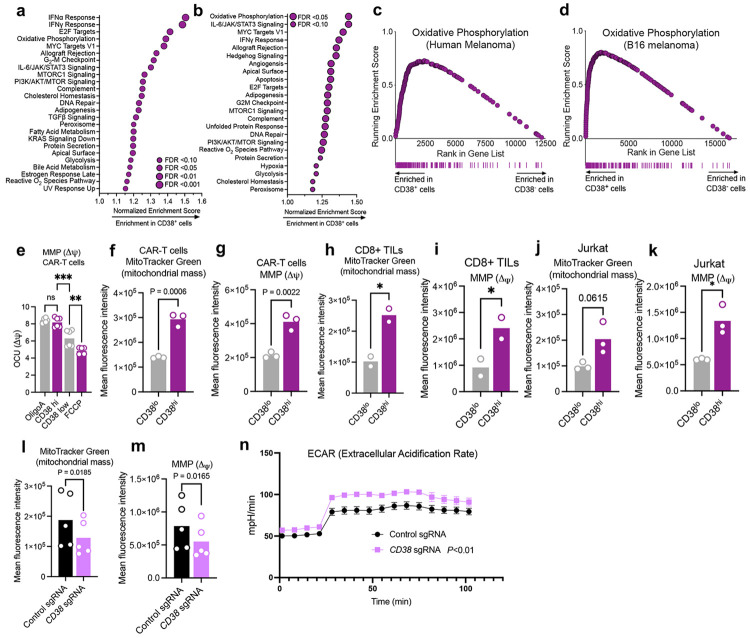
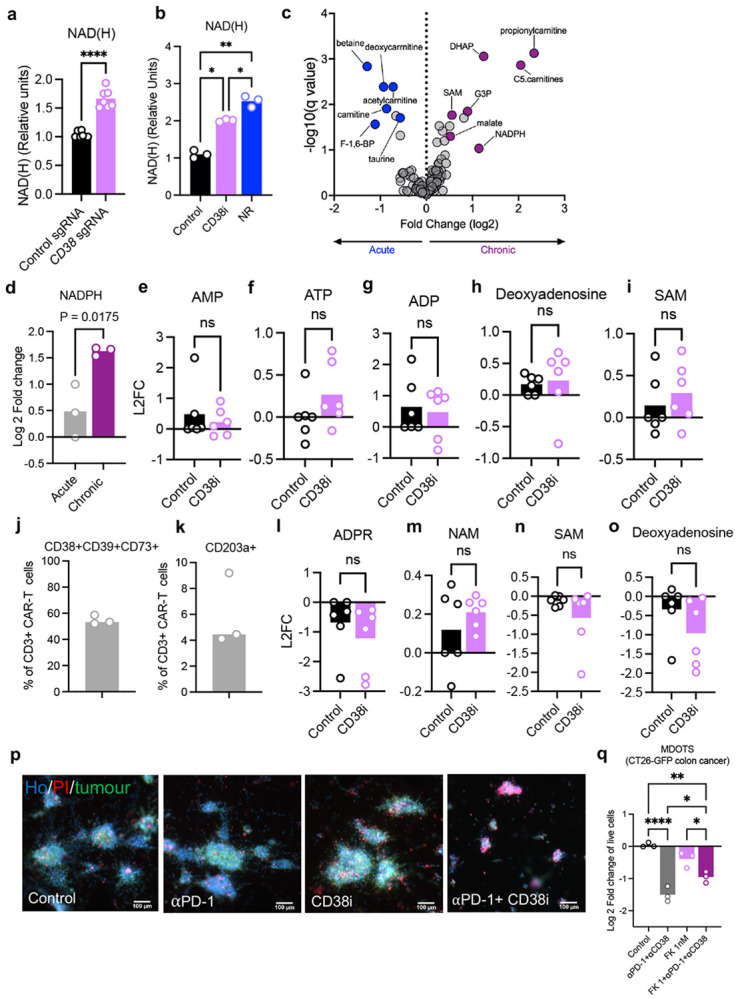
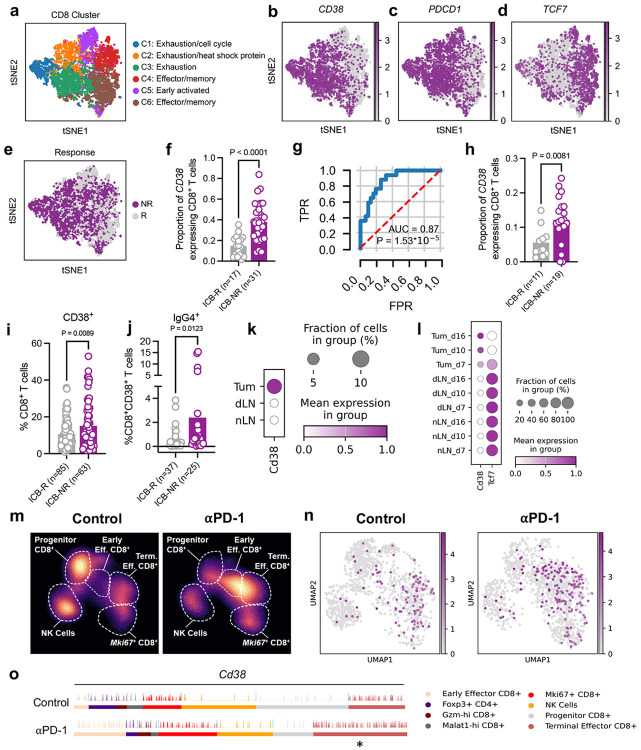
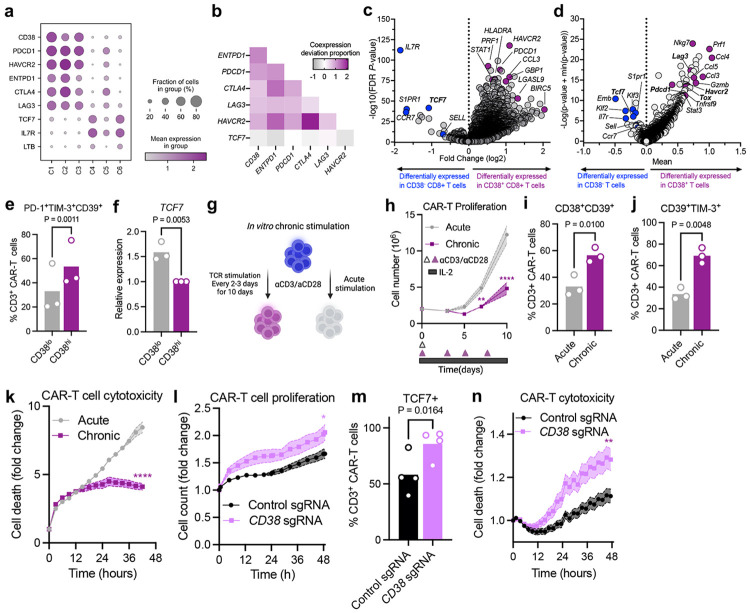
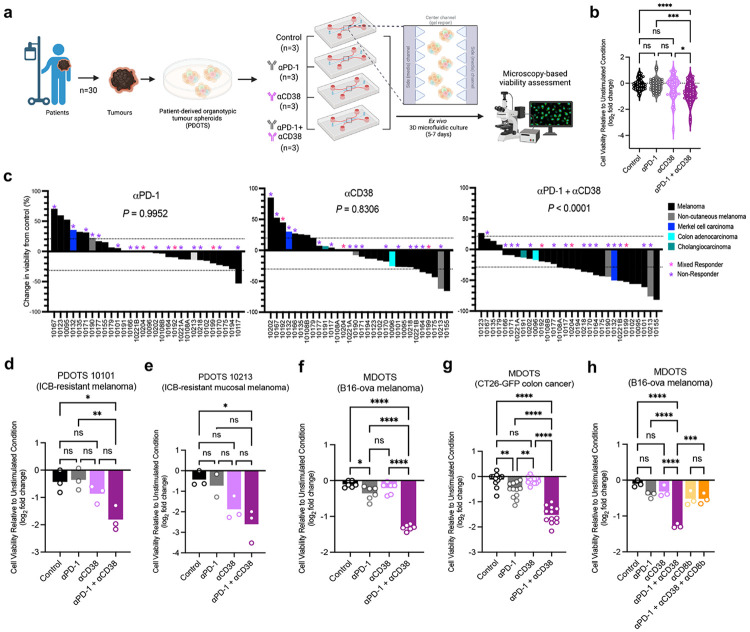
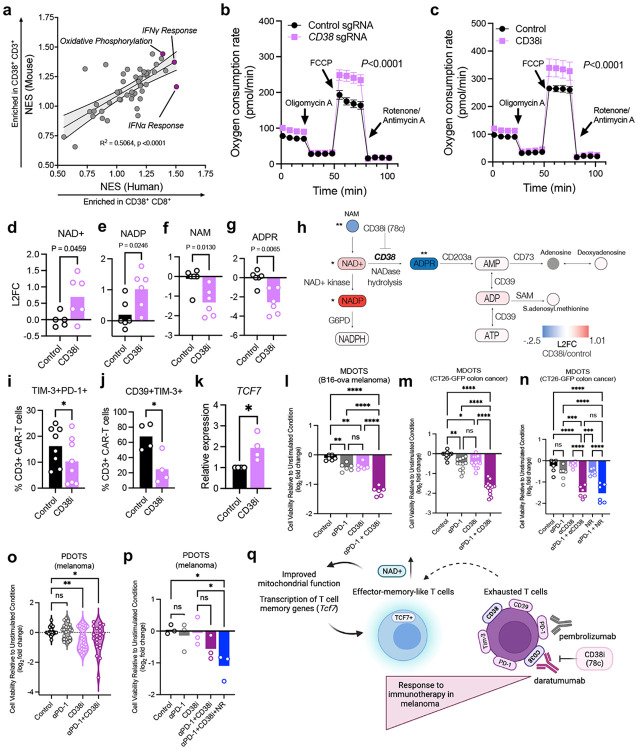
A central problem in cancer immunotherapy with immune checkpoint blockade (ICB) is the development of resistance, which affects 50% of patients with metastatic melanoma1,2. T cell exhaustion, resulting from chronic antigen exposure in the tumour microenvironment, is a major driver of ICB resistance3. Here, we show that CD38, an ecto-enzyme involved in nicotinamide adenine dinucleotide (NAD+) catabolism, is highly expressed in exhausted CD8+ T cells in melanoma and is associated with ICB resistance. Tumour-derived CD38hiCD8+ T cells are dysfunctional, characterised by impaired proliferative capacity, effector function, and dysregulated mitochondrial bioenergetics. Genetic and pharmacological blockade of CD38 in murine and patient-derived organotypic tumour models (MDOTS/PDOTS) enhanced tumour immunity and overcame ICB resistance. Mechanistically, disrupting CD38 activity in T cells restored cellular NAD+ pools, improved mitochondrial function, increased proliferation, augmented effector function, and restored ICB sensitivity. Taken together, these data demonstrate a role for the CD38-NAD+ axis in promoting T cell exhaustion and ICB resistance, and establish the efficacy of CD38 directed therapeutic strategies to overcome ICB resistance using clinically relevant, patient-derived 3D tumour models.

Keywords: 3D microfluidic culture; CD38; NAD+; PD-1; T cell exhaustion; cytokines; immunotherapy; organotypic tumour spheroids.


Conflict of interest statement

R.W.J. is a member of the advisory board for and has a financial interest in Xsphera Biosciences Inc., a company focused on using ex vivo profiling technology to deliver functional, precision immune-oncology solutions for patients, providers, and drug development companies. R.W.J. has received honoraria from Incyte (invited speaker), G1 Therapeutics (advisory board), Bioxcel Therapeutics (invited speaker). R.W.J. has ownership interest in U.S. patents US20200399573A9 and US20210363595A1. R.W.J.'s interests were reviewed and are managed by Massachusetts General Hospital and Mass General Brigham in accordance with their conflict-of-interest policies. A.M has served a consultant/advisory role for Third Rock Ventures, Asher Biotherapeutics, Abata Therapeutics, ManaT Bio, Flare Therapeutics, venBio Partners, BioNTech, Rheos Medicines and Checkmate Pharmaceuticals, is currently a part-time Entrepreneur in Residence at Third Rock Ventures, is an equity holder in ManaT Bio, Asher Biotherapeutics and Abata Therapeutics, and has received research funding support from Bristol-Myers Squibb. A.M.’s interests were reviewed and are managed by Massachusetts General Hospital and Mass General Brigham in accordance with their conflict-of-interest policies. J.M.S., L-C.C, N.S, M.M., N.N., R.S. are current employees with Teiko.bio and own stock. E E. and S.A.E. were employed with Teiko.bio in the past 2 years and own stock. R.S. and M.H.S. are Teiko.bio’s co-founders and R.S. serves on the company board. M.H.S. serves as an advisor for Teiko.bio and owns stock. M.E.W. worked as a contractor for Teiko.bio during this project. M.H.S. has received a speaking honorarium from Standard BioTools and Kumquat Bio, has been a paid consultant for Five Prime, Ono, January, Earli, Astellas, and Indaptus, and has received research funding from Roche/Genentech, Pfizer, Valitor, and Bristol Myers Squibb.X.W. and C.R.F. report a patent on the B7-H3 CAR T cells (US10519214B2). K.T.F. serves on the Board of Directors of Clovis Oncology, Strata Oncology, Kinnate, and Scorpion Therapeutics; Scientific Advisory Boards of PIC Therapeutics, Apricity, C-Reveal, Tvardi, ALX Oncology, xCures, Monopteros, Vibliome, Karkinos, Soley Therapeutics, Alterome, Immagene, and intrECate; consultant to Nextech, Takeda, Novartis, Transcode Therapeutics, and Roche/Genentech. R.T.M. consults for Bristol Myers Squibb. G.M.B. has sponsored research agreements through her institution with: Olink Proteomics, Teiko Bio, InterVenn Biosciences, and Palleon Pharmaceuticals. She has served on advisory boards for: Iovance, Merck, Nektar Therapeutics, Novartis, and Ankyra Therapeutics. She consults for: Merck, InterVenn Biosciences, Iovance, and Ankyra Therapeutics. She holds equity in Ankyra Therapeutics. M.S.F received funding from Calico Life Sciences, Bristol-Myers Squibb, Istari Oncology and served as a consultant for Galvanize Therapeutics. N.H. holds equity in BioNTech and is an advisor for Related Sciences/Danger Bio, Repertoire Immune Medicines and CytoReason, and receives research funding from Calico Life Sciences and Bristol-Myers Squibb. D.L serves on the scientific advisory board for Oncovalent Therapeutics, and received honorariums from Genentech.

Figures

Extended Figure 1∣
Extended Figure 1∣. Supporting data that CD38+ CD8+ T cells are associated with ICB resistance.
a-d, scRNAseq of tumour- infiltrating leukocytes (CD45+) from melanoma patients treated with ICB (a) t-SNE plot of CD45+ (n=16,291) with 11 distinct clusters; (b) feature plot demonstrating CD8a expression; (c) proportion of CD38 expressing CD8+T cells from pre-ICB tumours; (ICB-R, n=9; ICB-NR, n=10) and (d) post ICB tumours (ICB-R, n=8; ICB-NR, n=21; Means (bars) and individual values (open circles) are shown; 2-sided unpaired t-test, e-f, proportion of CD38 expressing CD8 T cells in ICB-R and ICB-NR, separated by ICB type (anti-PD-1 or anti-PD-1 plus anti-CTLA-4), (ICB-R, n=17; ICB-NR, n=31) nonparametric two sample Kolmogorov-Smirnov test. g-i, Receiver Operating Characteristic (ROC) curves demonstrating the predictive power of CD38+CD45+ cells for ICB resistance across different immune clusters in Extended Data Fig. 1a (clusters 6,9,11). FPR = false positive rate. TPR = true positive rate. j, summary of Receiver Operating Characteristic (ROC) curves of the predictive power of CD38 expression across different CD45+ clusters for ICB resistance. k, flow cytometry immunophenotyping of CD38 surface staining in CD45+ and CD45 cells from human melanoma tumours (n=18). Means (bars) and individual values (open circles) are shown; 2-sided unpaired t-test. l-n, scRNAseq analysis of CD8 T cells from melanoma validation cohort (l) UMAP of CD8 clusters (n=22,008) with 9 distinct clusters identified; (m) CD38 expression (n) TCF7 expression. ****p < 0.0001.
Extended Figure 2∣
Extended Figure 2∣. Supporting data that CD38+ CD8+ T cells are increased during tumour progression.
a, proportion of CD38 expressing CD8+T cells from (a) NSCLC (MPR-major pathological response ICB-R n=23; non-MPR, ICB-NR, n=34) b, Receiver Operating Characteristic (ROC) curve demonstrating the predictive power of CD38+CD8+ T cells for lack of ICB treatment benefit in NSCLC ; FPR = false positive rate. TPR = true positive rate. c-d CyTOF analysis of peripheral blood examining CD8+CD38+ T cells in melanoma patients' blood before ICB treatment (c) and after (d). e, CyTOF analysis of peripheral blood examining CD8+CD38+IgG4+. f, Olink analysis of CD38 protein levels in blood plasma of ICB-R (n=64) and ICB-NR (n=53) patients before and following 6 weeks and 6 months after ICB treatment. 2-way ANOVA. g, scRNAseq of CD45+ cells from B16 tumours showing UMAP with 10 distinct clusters, their distribution of location (Tum), tumour draining lymph nodes (dLN), and normal lymph nodes (nLN) and the expression of CD38 in those clusters. h, scRNAseq of T/NK tumour-infiltrating leukocytes from B16-ova tumours from Control (Vehicle/IgG, n=3) and αPD-1 (Vehicle/anti-PD-1, n=4). i-l, CD3+ TILs in Control (Vehicle/IgG, n=3) and αPD-1 (Vehicle/anti-PD-1, n=4) B16-ova treated tumours. (i) proportion of indicated immune populations upon PD-1 blockade (proportion from total cells; 2-way ANOVA with Sidak correction for multiple comparisons.). j-l, proportion of Cd38 expressing CD3+TILs of indicated types; unpaired t-test. *P <0.05, ***P <0.001.
Extended Figure 3∣
Extended Figure 3∣. Supporting data that CD38hiCD8+ T cells are dysfunctional.
a-c, analysis of sorted CD38hi and CD38loB7-H3.CAR-T for (a) surface staining for PD-1+ (b) surface staining of PD-1+TIM-3+ and (c) gene expression of FOXO1. Means (bars) and individual values (open circles) are shown (n=3 (a-b); n=2 (c); 2-sided unpaired t-test). d, analysis of surface staining for PD-1+TIM-3+ in B7-H3.CAR-T cells following acute and chronic T cell stimulation. Means (bars) and individual values (open circles) are shown (n=3; 2-sided paired t-test). e, Analysis of surface staining for B7-H3 antigen in 10101 melanoma tumour cells f-g, cytotoxicity assay of acute and chronically stimulated B7-H3.CAR-T cells towards 10170 (f) and 10101 (g) patient derived melanoma cell lines. Two other repeats for Fig. 2k. Means +/− s.e.m. (shaded area) are shown (n=3 biological replicates; 2-way ANOVA with Sidak correction for multiple comparisons). h, surface staining for CD38+CD39+ in CD8+ TILs from melanoma patients, following acute and chronic T cell stimulation. Means (bars) and individual values (open circles) are shown (n=3; 2-sided paired t-test) i, cytotoxicity of 10170 CD8+ TILs following acute and chronic T cell stimulation, towards 10170 patient-derived cell line (n=2 biological replicates; 2-way ANOVA with Sidak correction for multiple comparisons). j-l, analysis of surface staining of (j) CD38+, (k) PD-1+TIM-3+, (l) CD39+TIM-3+ in chronically stimulated control sgRNA and CD38 sgRNA B7-H3.CAR-T cells. Means (bars) and individual values (open circles) are shown (n=3; 2-sided paired t-test). *P <0.05, ***P < 0.001, ****p < 0.0001, ns, not significant.
Extended Figure 4∣
Extended Figure 4∣. Supporting data that CD38 blockade overcomes ICB resistance.
a, Tumour type, tissue source (location), gender, age, clinical response, PDOTS response data, tumour mutational burden (TMB), and associated tumour mutational profile for specimens used for PDOTS profiling (n=30; samples ordered by response to dual PD-1/CD38 blockade). PDOTS response parameters defined as previously described: responder (reduction >30% compared to control), partial responder (<30% reduction and <20% growth compared to control), and non-responder (>20% growth compared to control).
Extended Figure 5∣
Extended Figure 5∣. Supporting data that CD38 blockade overcomes ICB resistance in human melanoma.
a-b, representative images of 10213 ICB-resistant mucosal melanoma PDOTS (a) and 10101 ICB-resistant cutaneous melanoma PDOTS (b) treated with indicated treatments. Ho-Hoechst (blue), PI -propidium iodide, dead cells (red). Scale bars=100μm. c, flow cytometry analysis of indicated populations from PDOTS single cell suspension before culturing (n=25). d, immunofluorescence imaging of cutaneous melanoma PDOTS with indicated markers. Nu-nucleus, blue. White arrows denote cells with marker co-expression.
Extended Figure 6∣
Extended Figure 6∣. Supporting data that CD38 blockade overcomes ICB resistance.
a-c, Multiple linear regression summaries for the association of immune and clinical features of melanoma patient derived tumours used for PDOTS with ex vivo response to PD-1/CD38 dual blockade (n=30 for clinical features and n=22 for immune features) (Fig. 3b-c). (a) flow cytometry measures CD8+ proportions; (b) CD4+ proportions; (c) clinical demographic features. Points are coloured by −log10(p-value). d, flow cytometry analysis of indicated populations in CD8+ T cells TILs from CT26-GFP tumours at day 10 and day 14. e-f, representative images of B16-ova murine melanoma (e) and CT26-GFP murine colon cancer (f) treated with indicated treatments. Ho-Hoechst (blue), PI- PI -propidium iodide, dead cells (red), AO- acridine orange, live cells (green). g-i, cell surface staining of (g) CD38+ (h) IL-7Ra+ (i) CD69+ on CT26-GFP murine tumour derived CD8+ TILs treated in vitro with CD38 blocking antibody or control IgG. Means (bars) and individual values (open circles) are shown (n=2; 2-sided unpaired t-test). *P <0.05, **P < 0.01.
Extended Figure 7∣
Extended Figure 7∣. Supporting data that CD38 is associated with mitochondrial dysfunction.
a-b, Gene set enrichment analysis (GSEA) of (a) CD8+ TILs from human melanoma and (b) CD3+ TILs from B16-ova murine melanoma. c-d, mountain plots showing enrichment for OXPHOS gene set based on CD38 expression in (c) CD8+ TILs human melanoma and (d) CD3+ TILs from B16-ova murine melanoma. e, Incucyte mitochondrial membrane potential (MMP) measurements of sorted CD38hi and CD38lo B7-H3.CAR-T cells. Means (bars) and individual values (open circles) are shown (n=3; 3 biological replicates; 1-way ANOVA). f-k, Flow cytometry analysis of mitochondrial mass (f,h,j) and MMP (g,i,k) in CD38hi and CD38lo, chronically stimulated B7-H3.CAR-T cells (f,g), CD8+ TILs (h,i) and JURKAT cells (j,k). Means (bars) and individual values (open circles) are shown (n=3; 2-sided paired t-test). l,m, Flow cytometry analysis of mitochondrial mass (l) and MMP (m) of chronically stimulated control and CD38 sgRNA B7-H3.CAR-T cells (n=3; Means (bars) and individual values (open circles) are shown; 2-sided unpaired t-test). n, Extracellular acidification rate (ECAR) under basal condition in response to addition of oligomycin, carbonyl cyanide p-trifluoromethoxyphenylhydrazone (FCCP), and rotenone/antimycin A of B7-H3.CAR-T cells form indicated groups. (n=5, 2 biological replicates, 2-way ANOVA with Sidak correction for multiple comparisons). *P <0.05, **P < 0.01, ***P < 0.001.
Extended Figure 8∣
Extended Figure 8∣. Supporting data that CD38 inhibition restores cellular NAD+ levels.
a-b, Analysis of relative NAD(H) in (a) control and CD38 sgRNA B7-H3.CAR-T cells (n=3 biological repeats, 3 independent experiments; Means (bars) and individual values (open circles) are shown; 2-sided unpaired t-test) and (b) chronically stimulated B7-H3.CAR-T cells with indicated treatments (n=3 biological repeats; Means (bars) and individual values (open circles) are shown; 1-way ANOVA with Tukey correction for multiple comparisons). c, volcano plot of intracellular metabolomics of acute vs chronic B7-H3.CAR-T cells (n=3 biological repeats). d, Relative NADPH levels in B7-H3.CAR-T cells in indicated groups determined by LC-MS. Means (bars) and individual values (open circles) are shown (n=3 biological replicates, 2-sided unpaired t-test). e-i, Relative levels of intracellular (e) AMP (Adenosine mono-phosphate), (f) ATP (Adenosine triphosphate), (g) ADP(Adenosine diphosphate), (h) deoxyadenosine and (i) SAM (S-Adenosylmethionine) in chronically stimulated CAR-T cells +/− CD38i (n=6; 2 independent CAR-T donors; Means (bars) and individual values (open circles) are shown; 2-sided unpaired t-test). j-k, flow cytometric analysis of the indicated surface markers in chronically stimulated B7-H3.CAR-T cells (n=3 biological repeats; Means (bars) and individual values (open circles) are shown). l-o, Relative levels of extracellular (l) ADPR (Adenosine diphosphate ribose), (m) NAM (nicotinamide), (n) SAM, (o) Deoxyadenosine in chronically stimulated CAR-T cells +/− CD38i (n=6 biological replicates; 2 independent CAR-T donors; 2-sided unpaired t-test). p, representative images of CT26-GFP murine colon cancer treated with indicated treatments. Ho- Hoechst (blue), PI- PI -propidium iodide, dead cells (red), GFP- tumour cells. q, Viability assessment of CT26-GFP MDOTS (n=3 biological replicates, one-way ANOVA with Tukey correction for multiple comparisons), with indicated treatments. *P < 0.05, **P < 0.01, ***P < 0.001, ns, not significant.
Figure 1∣
Figure 1∣. CD38+ CD8+ T cells are associated with ICB resistance.
a-g, scRNAseq of CD45+ immune cells from melanoma patients with (a) t-SNE plot of CD8+ T cell clusters (n=6,350); (b-d) t-SNE plot of CD8+ T cell clusters showing expression of (b) CD38, (c) PDCD1, and (d) TCF7; (e) t-SNE plot of CD8+ T cell clusters by ICB response; (f) Proportion of CD38 expressing CD8+T cells from indicated groups. Responders (ICB-R) and non-responders (ICB-NR). Means (bars) and individual values (open circles) are shown. 2-sided unpaired t-test; (g) Receiver Operating Characteristic (ROC) curve, demonstrating the predictive power of CD38+CD8+ T cells for ICB resistance. h, Validation cohort evaluating proportion of CD38 expressing CD8+T cells from indicated groups; 2-sided unpaired t-test, i-j, CyTOF analysis of peripheral blood examining levels of (i) CD38+CD8+T cells and (j) IgG4+ CD38+CD8+T cells from ICB responding and non-responding patients; Means (bars) and individual values (open circles) are shown; 2-sided unpaired t-test, k-1, Dot plots indicating (k) Cd38 expression in CD8+ TILs from B16-ova tumours (Tum), tumour draining lymph nodes (dLN), and normal lymph nodes (nLN) and (I) expression of Cd38 and Tcf7 (Tum, dLN, and nLN) at day 7, 10 and 1620. m-o, scRNAseq of CD3+ TILs from IgG control and αPD-1 treated mice bearing B16-ova tumours showing (m) UMAP of T/NK cell clusters by condition; (n) Cd38 gene expression in UMAP from (m); (o) tracks plots of Cd38 gene expression by T/NK cluster. 2-way ANOVA with Sidak correction for multiple comparisons. Statistics in Extended Data Fig. 2i. P < 0.05.
Figure 2∣
Figure 2∣. CD38hiCD8+ T cells are dysfunctional.
a, Dot plot showing the expression of exhaustion and effector/memory-related genes in CD8+ TILs from human melanoma tumours. b, Co-expression deviation proportion plot demonstrating co-expression of exhaustion-related genes and TCF7 from melanoma validation cohort. c-d, Volcano plots depicting differentially expressed genes based on CD38 expression in (c) CD8+ TILs from human melanoma and (d) CD3+ TILs from B16-ova murine melanoma. e-f, Surface staining (e) for PD-1+CD39+TIM-3+ (n=3; 2-sided paired t-test) and (f) TCF7 expression (n=3; 2-sided unpaired t-test) in sorted CD38hi and CD38lo B7-H3.CAR-T cells. Means (bars) and individual values (open circles) are shown. g, Scheme depicting acute and chronic TCR stimulation. h-k, Acute and chronic B7-H3.CAR-T (h) proliferation assay; Means +/− s.e.m. (shaded areas) are shown (n=3; 2-way ANOVA with Sidak correction for multiple comparisons). Surface staining for CD38+CD39+ (i) and CD39+TIM-3+ (j); Means (bars) and individual values (open circles) are shown (n=3, 2-sided paired t-test) (k) cytotoxicity assay towards 10164 patient derived melanoma cell line. Representative experiment out of three is presented. Means +/− s.e.m. (shaded area) are shown (n=3 biological replicates; 3 independent experiments; 2-way ANOVA with Sidak correction for multiple comparisons). l-n, analysis of chronically stimulated control sgRNA and CD38 sgRNA B7-H3.CAR-T cells; (l) Proliferation assay; Means +/− s.e.m. (shaded area) are shown (n=3 biological replicates; 3 independent experiments; 2-way ANOVA with Sidak correction for multiple comparisons); (m) TCF7 intracellular staining. Means (bars) and individual values (open circles) are shown (n=4; 2-sided paired t-test;); (n) Cytotoxicity assay 10164 melanoma cells. Means +/− s.e.m. (shaded area) are shown (n=3 biological replicates; 3 independent experiments; 2-way ANOVA with Sidak correction for multiple comparisons). *P < 0.05, **P < 0.01, ****P < 0.0001.
Figure 3∣
Figure 3∣. CD38 blockade overcomes ICB resistance.
a, Scheme of PDOTS preparation. b, Violin plot of PDOTS (n=30) viability assessment following treatment with anti-PD-1 (250 μg/mL pembrolizumab), anti-CD38 (200 μg/mL), or combined anti-PD-1+anti-CD38. Individual values (open circles) indicate mean for each PDOTS specimen; one-way ANOVA with Tukey correction for multiple comparisons. c, waterfall plots for PDOTS (n=30, indicated tumour types) with indicated treatments. Response is defined as 30% reduction from control (dashed lines). d-e, PDOTS viability assessment from (d) ICB-resistant cutaneous melanoma (10101) and (e) ICB-resistant mucosal melanoma (10213) with indicated treatments (n=3 biological replicates per PDOTS specimen, one-way ANOVA with Tukey correction for multiple comparisons). f-g, Viability assessment of (f) B16-ova MDOTS (n=6 biological replicates, 2 independent experiments), (g) CT26-GFP MDOTS (n=12 biological replicates, 4 independent experiments), (h) B16-ova MDOTS (n=3 biological replicates, 1 independent experiment) with indicated treatments. Means (bars) and individual values (open circles) are shown (one-way ANOVA with Tukey correction for multiple comparisons. *P < 0.05. **P < 0.01; ***P < 0.001; **** P < 0.0001; ns, not significant.
Figure 4∣
Figure 4∣. CD38 inhibition restores cellular NAD+ and sensitivity to ICB.
a, correlation analysis between the GSEA of CD38+/−CD8+ T cells in human melanoma and CD38+/−CD3+ T cells in B16-ova murine melanoma, b-c, Oxygen consumption rate (OCR) under basal condition in response to indicated mitochondrial inhibitors of chronically stimulated B7-H3.CAR-T cells form indicated groups. (n=5 biological replicates, 2 independent experiments; 2-way ANOVA with Sidak correction for multiple comparisons). d-g, Relative levels of (d) NAD+ (Nicotinamide adenine dinucleotide), (e) NADP+ (Nicotinamide adenine dinucleotide phosphate), (f) NAM (nicotinamide) and (g) ADPR (Adenosine diphosphate ribose) in B7-H3.CAR-T cells in indicated groups (n=6 biological replicates; 2 independent experiments; 2-sided unpaired t-test). h, scheme of NAD+ metabolism and log2 fold change (L2FC) of indicated analytes. i-j, surface staining of (i) TIM-3+PD-1+ and (j) CD39+TIM-3+ in B7-H3.CAR-T cells in indicated groups. Means (bars) and individual values (open circles) are shown (n≥4; 2-sided paired t-test), k, TCF7 expression in B7-H3.CAR-T cells in indicated groups. Means (bars) and individual values (open circles) are shown (n=4; 2-sided unpaired t-test). l-m, Viability assessment of (l) B16-ova MDOTS (n=6 biological replicates, 2 independent experiments), (m) CT26-GFP MDOTS (n=12 biological replicates, 4 independent experiments), (n) CT26-GFP MDOTS (n=6 biological replicates, 2 independent experiments) with indicated treatments. Means (bars) and individual values (open circles) are shown (one-way ANOVA with Tukey correction for multiple comparisons). o, Viability assessment of melanoma PDOTS with indicated treatments. (n=21, 7 independent specimens. Mean values (bars) and individual values (open circles) are shown.; mixed effects one-way ANOVA with Geisser-Greenhouse correction and Holm-Sidak correction for multiple comparisons test. p, Viability assessment of melanoma PDOTS treated with indicated treatments (n=3 biological replicates). Means (bars) and individual values (open circles) are shown; one-way ANOVA with Tukey correction for multiple comparisons. *P < 0.05, **P < 0.01; ***P < 0.001, ns, not significant, q, Scheme demonstrating the effect of targeting CD38 on ICB response by increasing NAD+ and TCF7 expression along with restoring mitochondrial bioenergetics.

Similar articles

  • Overcoming resistance to immunotherapy by targeting CD38 in human tumor explants.
    Revach OY, Cicerchia AM, Shorer O, Palin CA, Petrova B, Anderson S, Liu B, Park J, Chen L, Mehta A, Wright SJ, McNamee N, Tal-Mason A, Cattaneo G, Tiwari P, Xie H, Sweere JM, Cheng LC, Sigal N, Enrico E, Miljkovic M, Evans SA, Nguyen N, Whidden ME, Srinivasan R, Spitzer MH, Sun Y, Sharova T, Lawless AR, Michaud WA, Rasmussen MQ, Fang J, Brook JR, Chen F, Wang X, Ferrone CR, Lawrence DP, Sullivan RJ, Liu D, Sachdeva UM, Sen DR, Flaherty KT, Manguso RT, Bod L, Kellis M, Boland GM, Yizhak K, Yang J, Kanarek N, Sade-Feldman M, Hacohen N, Jenkins RW. Revach OY, et al. Cell Rep Med. 2025 Jul 15;6(7):102210. doi: 10.1016/j.xcrm.2025.102210. Epub 2025 Jun 27. Cell Rep Med. 2025. PMID: 40578364 Free PMC article.
  • High CD38 expression defines a mitochondrial function-adapted CD8+ T cell subset with implications for lung cancer immunotherapy.
    Lv LL, Zhai JW, Wu JJ, Fan GQ, Zhang YX, Shen Y, Qu QX, Chen C. Lv LL, et al. Cancer Immunol Immunother. 2025 Jan 3;74(2):49. doi: 10.1007/s00262-024-03881-5. Cancer Immunol Immunother. 2025. PMID: 39751818 Free PMC article.
  • Ex Vivo Profiling of PD-1 Blockade Using Organotypic Tumor Spheroids.
    Jenkins RW, Aref AR, Lizotte PH, Ivanova E, Stinson S, Zhou CW, Bowden M, Deng J, Liu H, Miao D, He MX, Walker W, Zhang G, Tian T, Cheng C, Wei Z, Palakurthi S, Bittinger M, Vitzthum H, Kim JW, Merlino A, Quinn M, Venkataramani C, Kaplan JA, Portell A, Gokhale PC, Phillips B, Smart A, Rotem A, Jones RE, Keogh L, Anguiano M, Stapleton L, Jia Z, Barzily-Rokni M, Cañadas I, Thai TC, Hammond MR, Vlahos R, Wang ES, Zhang H, Li S, Hanna GJ, Huang W, Hoang MP, Piris A, Eliane JP, Stemmer-Rachamimov AO, Cameron L, Su MJ, Shah P, Izar B, Thakuria M, LeBoeuf NR, Rabinowits G, Gunda V, Parangi S, Cleary JM, Miller BC, Kitajima S, Thummalapalli R, Miao B, Barbie TU, Sivathanu V, Wong J, Richards WG, Bueno R, Yoon CH, Miret J, Herlyn M, Garraway LA, Van Allen EM, Freeman GJ, Kirschmeier PT, Lorch JH, Ott PA, Hodi FS, Flaherty KT, Kamm RD, Boland GM, Wong KK, Dornan D, Paweletz CP, Barbie DA. Jenkins RW, et al. Cancer Discov. 2018 Feb;8(2):196-215. doi: 10.1158/2159-8290.CD-17-0833. Epub 2017 Nov 3. Cancer Discov. 2018. PMID: 29101162 Free PMC article.
  • Strategies to reinvigorate exhausted CD8+ T cells in tumor microenvironment.
    Guan Q, Han M, Guo Q, Yan F, Wang M, Ning Q, Xi D. Guan Q, et al. Front Immunol. 2023 Jun 16;14:1204363. doi: 10.3389/fimmu.2023.1204363. eCollection 2023. Front Immunol. 2023. PMID: 37398660 Free PMC article. Review.
  • Immunotherapy Goes Local: The Central Role of Lymph Nodes in Driving Tumor Infiltration and Efficacy.
    van Pul KM, Fransen MF, van de Ven R, de Gruijl TD. van Pul KM, et al. Front Immunol. 2021 Mar 1;12:643291. doi: 10.3389/fimmu.2021.643291. eCollection 2021. Front Immunol. 2021. PMID: 33732264 Free PMC article. Review.

References

    1. Ribas A. & Wolchok J. D. Cancer immunotherapy using checkpoint blockade. Science 359, 1350–1355 (2018). - PMC - PubMed
    1. Wolchok J. D. et al. Long-Term Outcomes With Nivolumab Plus Ipilimumab or Nivolumab Alone Versus Ipilimumab in Patients With Advanced Melanoma. J. Clin. Oncol. 40, 127–137 (2022). - PMC - PubMed
    1. Budimir N., Thomas G. D., Dolina J. S. & Salek-Ardakani S. Reversing T-cell Exhaustion in Cancer: Lessons Learned from PD-1/PD-L1 Immune Checkpoint Blockade. Cancer Immunol Res 10, 146–153 (2022). - PubMed
    1. Jenkins R. W., Barbie D. A. & Flaherty K. T. Mechanisms of resistance to immune checkpoint inhibitors. Br. J. Cancer 118, 9–16 (2018). - PMC - PubMed
    1. Sharma P., Hu-Lieskovan S., Wargo J. A. & Ribas A. Primary, Adaptive, and Acquired Resistance to Cancer Immunotherapy. Cell 168, 707–723 (2017). - PMC - PubMed

Publication types