[Preprint]. 2024 Feb 13:2024.02.13.580131.
doi: 10.1101/2024.02.13.580131.

Complementary Cytoskeletal Feedback Loops Control Signal Transduction Excitability and Cell Polarity

Affiliations

Complementary Cytoskeletal Feedback Loops Control Signal Transduction Excitability and Cell Polarity

Jonathan Kuhn et al. bioRxiv. .

Update in

Abstract

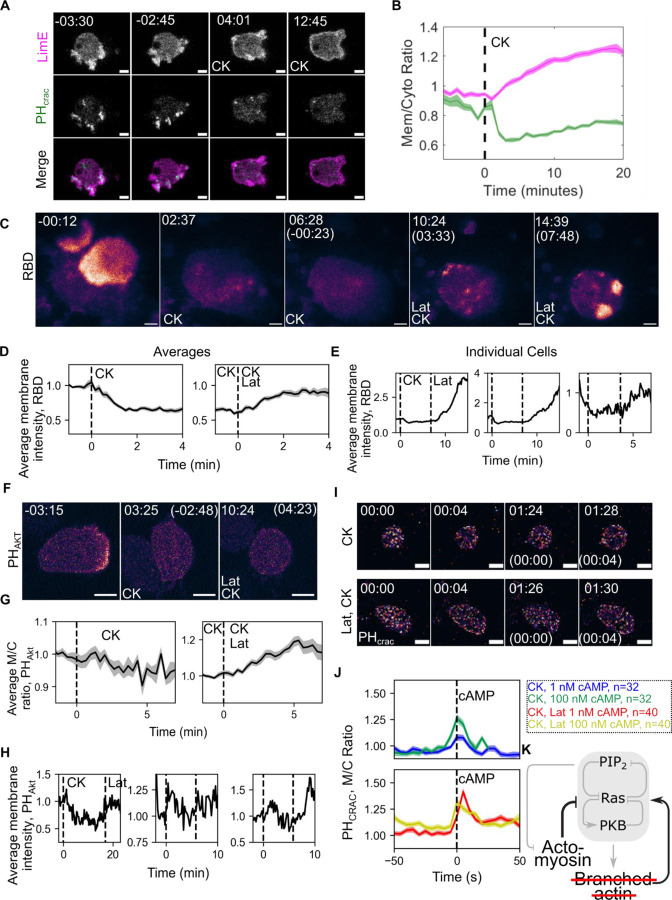
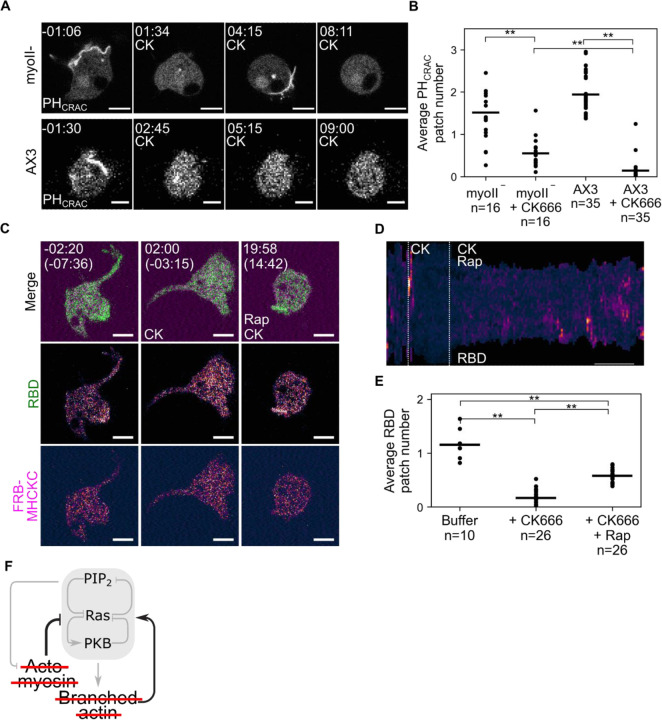
To move through complex environments, cells must constantly integrate chemical and mechanical cues. Signaling networks, such as those comprising Ras and PI3K, transmit chemical cues to the cytoskeleton, but the cytoskeleton must also relay mechanical information back to those signaling systems. Using novel synthetic tools to acutely control specific elements of the cytoskeleton in Dictyostelium and neutrophils, we delineate feedback mechanisms that alter the signaling network and promote front- or back-states of the cell membrane and cortex. First, increasing branched actin assembly increases Ras/PI3K activation while reducing polymeric actin levels overall decreases activation. Second, reducing myosin II assembly immediately increases Ras/PI3K activation and sensitivity to chemotactic stimuli. Third, inhibiting branched actin alone increases cortical actin assembly and strongly blocks Ras/PI3K activation. This effect is mitigated by reducing filamentous actin levels and in cells lacking myosin II. Finally, increasing actin crosslinking with a controllable activator of cytoskeletal regulator RacE leads to a large decrease in Ras activation both globally and locally. Curiously, RacE activation can trigger cell spreading and protrusion with no detectable activation of branched actin nucleators. Taken together with legacy data that Ras/PI3K promotes branched actin assembly and myosin II disassembly, our results define front- and back-promoting positive feedback loops. We propose that these loops play a crucial role in establishing cell polarity and mediating signal integration by controlling the excitable state of the signal transduction networks in respective regions of the membrane and cortex. This interplay enables cells to navigate intricate topologies like tissues containing other cells, the extracellular matrix, and fluids.


Figures

Figure 1:
Figure 1:. Cytoskeletal feedback loops at the cell front and back control Ras activity.
(A) Scanning confocal imaging of Ras activation (RBD-EGFP) in wild-type (AX3) or actobindin ABC triple knockout (abnABC) Dictyostelium cells. (B) Diagram (left) and experimental data (right) of RBD membrane kymographs corresponding to the movies in (A) (right). Scale bars = 2 minutes. (C) Individual (dots) and average (lines) percentages of the membrane periphery with RBD localization significantly above background in AX3 and abnABC cells. n = cells, **= p< 0.005. (D) Scanning confocal imaging of mCherry-FRB-MHCKC membrane recruitment and cell shape (brightfield) in AX3 cells. Cells are also expressing an unlabeled membrane-localized FKBP domain (cAR1–2xFKBP, see methods). t = 00:00 indicates rapamycin addition. (E) Examples (left) and diagram (right) of temporal color projections of cell outlines corresponding to the movie in (D). Blue and yellow times indicate the first and last images in the projection, respectively. (F) Average (line) and SEM (shaded area) of cell area before and after MHCKC recruitment by rapamycin addition (dashed line, t = 0). n = 16 cells. (G) Scanning confocal imaging of RBD and MHCKC membrane recruitment in AX3 cells. t=00:00 indicates rapamycin addition. (H) Membrane kymograph of Ras activation corresponding to the movie in (G). Dashed line indicates rapamycin addition, scale bar = 6 minutes. (I) Average (line) and SEM (shaded area) of normalized percentages of the membrane periphery with RBD localization significantly above background before and after MHCKC recruitment by rapamycin addition (dashed line, t = 0). n = 20 cells. (J) Schematic of the core signaling system controlling cell migration (shaded area) as well as cytoskeletal effectors. Gray arrows indicate previously known interactions while the black arrows indicate the positive feedback from branched actin (Fig 1A–C, S1A–B) and the negative feedback from myosin (Fig 1D–I) shown here. Time is in min:sec; scale bars = 5 µm unless otherwise noted.
Figure 2:
Figure 2:. Cortical actin suppresses signaling network activation.
(A) Scanning confocal imaging of polymerizing actin (LimEΔCoil-RFP) and PIP3 levels (PHCRAC-YFP) in wild type (AX3) Dictyostelium cells before and after treatment with the Arp2/3 inhibitor CK666 (CK). t = 00:00 indicates CK666 addition. (B) Average (line) and SEM (shaded area) of the membrane-to-cytosol intensity ratio of LimE (magenta) and PHCRAC (green) before and after CK666 addition (dashed line, t = 0). n = 27 cells. (C) TIRF imaging activated Ras (RBD-mCherry) in electrofused (“giant”) AX3 cells before and after CK666 addition and subsequently latrunculin addition. Cells are incubated in caffeine to raise basal activity levels. t = 00:00 indicates the addition of CK666 or, in parentheses, latrunculin. (D) Average (line) and SEM (shaded area) of average RBD intensity on the membrane of giant AX3 cells in buffer before and after CK666 addition (left, dashed line, t = 0) or in CK666 before and after latrunculin addition (right, dashed line, t = 0). The left plot excludes data after latrunculin addition while the right excludes data before CK666 addition. n = 22 cells. (E) Selected individual traces from the dataset in (D). The left plot corresponds to the movie in (C). t = 00:00 indicates CK666 addition; dashed lines correspond to indicated drug addition. (F) Scanning confocal imaging of PIP3 levels (RFP-PHAKT) in human neutrophil-like (dHL60) cells before and after the addition of CK666 addition and subsequently latrunculin addition. t = 00:00 indicates the addition of CK666 or, in parentheses, latrunculin. (G-H) Average (G, line), SEM (G, shaded area), and individual traces (H) of the normalized PHAKT membrane-to-cytosol ratio before and after CK666 and subsequently latrunculin addition in dHL60 cells. The right plot in (G) contains both cells starting in buffer and cells pre-incubated in CK666 while the left only contains cells starting in buffer. The left plot in (H) corresponds to the movie in (F), all dashed lines indicate drug addition. n = 27 cells prior to CK666 addition, 55 cells after CK666 addition and latrunculin addition. (I) Scanning confocal imaging of PIP3 levels in developed AX3 Dictyostelium cells treated with CK666 (CK) or CK666 and latrunculin (CK, Lat) before and after the addition of 1 nM cAMP and subsequently 100 nM cAMP. t = 00:00 indicates the addition of 1 nM cAMP or, in parentheses, 100 nM cAMP. (J) Average (line) and SEM (shaded area) of the membrane-to-cytosol ratio of PHCRAC before and after the indicated dose of cAMP. n=cells. (K) Arp2/3 experiments reveal negative feedback to signaling from F-Actin left behind after CK666 treatment and positive feedback from branched actin networks. Red line striking out “Branched actin” reflects the CK666 treatment effect. Time is in min:sec; scale bars = 5 µm.
Figure 3:
Figure 3:. The actomyosin cortex exhibits negative feedback onto signaling networks.
(A) Scanning confocal images of PIP3 levels (PHCRAC-YFP) in wild type (AX3) and myosin II-null (myoII-) Dictyostelium cells before and after CK666 addition. t = 00:00 indicates CK666 addition. (B) Average (lines) and individual (dots) mean number of PIP3 patches over time before and after CK666 addition in AX3 and myoII cells. n = cells, ** = p < 0.005. (C) Scanning confocal images of Ras activation (RBD-EGFP) before and after CK666 addition and subsequently mCherry-FRB-MHCKC membrane recruitment in AX3 cells. Cells are also expressing an unlabeled membrane-localized FKBP domain (cAR1–2xFKBP). t = 00:00 indicates the addition of CK666 or, in parentheses, rapamycin. (D) Membrane kymograph of Ras activation corresponding to the movie in (C). Dashed lines represent the addition of specified drug, scale bar = 5 minutes. (E) Average (lines) and individual (dots) mean number of RBD patches over time before and after CK666 addition and subsequently MHCKC recruitment by rapamycin addition. n = cells, ** = p < 0.005. (F) The partial reversal of CK666’s effect on signaling by ablating myosin (Fig 3A–E) indicates that the actomyosin cortex as an ensemble feeds back negatively on cell signaling. Red lines indicate that Arp 2/3 and Myosin have been eliminated or reduced. Time is in min:sec; scale bars = 5 µm unless otherwise noted.
Figure 4:
Figure 4:. Increasing the abundance of the actomyosin cortex using RacE leads to signaling inhibition.
(A) Scanning confocal imaging of RacE-GEF (mCherry-FRB-GXCTΔNT) membrane recruitment and cell shape in wild type (AX3) Dictyostelium cells. Cells are also expressing an unlabeled membrane-localized FKBP domain (cAR1–2xFKBP). t = 00:00 indicates rapamycin addition. (B) Temporal color projections of cell outlines corresponding to the movie in (A). Blue and yellow times indicate the first and last images in the projection, respectively. (C) Average (line) and SEM (shaded area) of cell area in AX3 cells before and after GXCT recruitment (dashed line, t=0). n = 35 cells. (D) Traces of cell movement in AX3 cells 200 seconds before and after GXCT recruitment. n = 35 cells. (E) Scanning Confocal imaging of GXCT recruitment and polymerizing actin (LimEΔCoil-EGFP) in AX3 cells. t = 00:00 indicates rapamycin addition. (F) Membrane kymograph of LimE from the movie in (E). Dashed line indicates rapamycin addition, scale bar = 5 minutes. (G) Average (line) and SEM (shaded area) membrane-to-cytosol ratio of LimE before and after GXCT recruitment by rapamycin addition (dashed line, t = 0). n = 8 cells. (H) Scanning Confocal imaging of GXCT recruitment and Ras activation (RBD-EGFP) in AX3 cells. t = 00:00 indicates rapamycin addition. (I) Membrane kymograph of RBD from the movie in (H). Dashed line indicates rapamycin addition, scale bar = 5 minutes. (J) Average (line) and SEM (shaded area) membrane-to-cytosol ratio of RBD before and after GXCT recruitment by rapamycin addition (dashed line, t = 0). n = 9 cells. Time is in min:sec. (K) Increasing the abundance of the actomyosin cortex (thick black arrow) inhibits the core signaling module. Scale bars = 5 µm unless otherwise noted.
Figure 5:
Figure 5:. RacE reversibly and locally control cell signaling and actin polymerization.
(A) Scanning confocal imaging of RacE-GEF (tagRFP-SSPB-GXCTΔNT) optical membrane recruitment in wild type (AX3) Dictyostelium cells. Cells are also expressing an unlabeled membrane-localized iLID domain (N150-ILID, see methods). t = 00:00 indicates blue light exposure or blue light loss (parentheses). (B) Average (lines) and SEM (shaded area) of cell area before and after GXCT membrane recruitment (left, dashed line) or GXCT membrane dissociation (right, dashed line). n = 17 cells (left) and 6 cells (right). (C) Individual traces of cell area in cells before, during (shaded area), and after GXCT recruitment. The plot on the left corresponds to the movie in (A). (D) TIRF imaging of Ras activation (RBD-emiRFP670) before, during, and after GXCT recruitment in electrofused (“giant”) AX3 cells. Cells are treated with 50 µg/ml Biliverdin to activate emiRFP670 fluorescence. t = 00:00 indicates blue light exposure. (E) Average (lines) and SEM (shaded area) of the percentage of the cell membrane with RBD localization significantly above background before and after GXCT membrane recruitment (left, dashed line) or GXCT membrane dissociation (right, dashed line). n = 7 cells. (F) Individual traces of the percentage of the cell membrane with RBD localization significantly above background in giant cells before, during (shaded area), and after GXCT recruitment. The plot on the left corresponds to the movie in (D). (G) Scanning confocal imaging of cell protrusion formation after local recruitment of SSPB-GXCT or SSPB alone. +CK indicates cells were pre-treated with CK666. Boxes indicate the region of blue light exposure; arrows form a line between the center of the protrusion formed after stimulation and the center of the cell. t = 00:00 indicates the last timepoint before blue light exposure. (H) Angular histograms of the angle formed between the center of the protrusion and the location of GXCT recruitment relative to the cell center as demonstrated in (G). n = 26 cells, SSPB-GXCT and SSPB-GXCT + CK666. n = 15 cells, SSPB. (I) TIRF imaging of RBD membrane localization before and after local GXCT recruitment in giant AX3 cells. The yellow box indicates the region of blue light exposure and the blue arrow indicates the line and direction for linear kymograph creation. t = 00:00 indicates the last timepoint before blue light exposure. (J) Linear kymograph of GXCT recruitment and RBD intensity corresponding to the blue line in (I). Yellow box indicates the approximate region of blue light exposure. Scale bar indicates 20 seconds. (K) Quantification of the motion of RBD waves away from the region of GXCT recruitment (see methods). Because this measurement is a composite of RBD translocation and disappearance it is not a true velocity. n = cells, ** = p < 0.005. Time is in min:sec; scale bars = 5 µm unless otherwise noted.
Figure 6:
Figure 6:. Cytoskeletal networks can create polarity by feeding back onto a core signaling module.
(A) Schematic showing the signal transduction network involving Ras/ PIP2 and PKB and how they couple to the two types of actin feedback loops. (B) Kymographs showing activity around the cell perimeter as function of time. PIP2 and Ras are shown in green and magenta respectively. The top and bottom correspond to simulations without and with the feedback loops, respectively. (C) Simulated cell trajectories of 10 cells each with feedback loops turned off (top) and on (bottom). (D) Kymographs showing wave activity across cell perimeter for varying strengths of the branched actin feedback. (E) Total Ras activity around the cell perimeter with respect to the strength of the branched actin feedback. Wildtype corresponds to a strength of 1. Black bar denotes the mean of 10 simulations per strength. Simulations with total Ras activity less than 500 showed no firings. (F) Kymographs showing wave activity across cell perimeter for varying strengths of the actomyosin feedback. (G) Total Ras activity around the cell perimeter with respect to the strength of the actomyosin feedback. Wildtype corresponds to a strength of 0.4. Black bar denotes the mean of 10 simulations per strength. Simulations with total Ras activity less than 200 showed no firings. (H) Frames from a 2D simulation of effects of adding CK666 and then Latrunculin to wild type cells. The three rows represent waves in the wildtype cell, waves after CK666 addition, and subsequent Latrunculin treatment. (I) The total Ras activity for simulations as in panel H. The solid line and the shaded area represent the mean ± 1 standard deviation. In all the simulations the CK666 effect is incorporated at the 200 s and the additional Latrunculin effect is added at the 400 s. Scale bars = 10 microns

References

    1. Devreotes P. N. et al. Excitable Signal Transduction Networks in Directed Cell Migration. Annu Rev Cell Dev Biol 33, 103–125 (2017). - PMC - PubMed
    1. Graziano B. R., Weiner O. D., Huttenlocher A. & Sahai E. Self-organization of protrusions and polarity during eukaryotic chemotaxis This review comes from a themed issue on Cell adhesion and migration Edited by. Curr Opin Cell Biol 30, 60–67 (2014). - PMC - PubMed
    1. Miao Y. et al. Altering the threshold of an excitable signal transduction network changes cell migratory modes. Nat Cell Biol 19, 329–340 (2017). - PMC - PubMed
    1. Sasaki A. T., Chun C., Takeda K. & Firtel R. A. Localized Ras signaling at the leading edge regulates PI3K, cell polarity, and directional cell movement. Journal of Cell Biology 167, 505–518 (2004). - PMC - PubMed
    1. Sasaki A. T. et al. G protein–independent Ras/PI3K/F-actin circuit regulates basic cell motility. J Cell Biol 178, 185 (2007). - PMC - PubMed

Publication types