[Preprint]. 2024 Jun 29:2024.02.11.24302646.
doi: 10.1101/2024.02.11.24302646.

Diagnosing missed cases of spinal muscular atrophy in genome, exome, and panel sequencing datasets

Affiliations

Diagnosing missed cases of spinal muscular atrophy in genome, exome, and panel sequencing datasets

Ben Weisburd et al. medRxiv. .

Update in

  • Diagnosing missed cases of spinal muscular atrophy in genome, exome, and panel sequencing data sets.
    Weisburd B, Sharma R, Pata V, Reimand T, Ganesh VS, Austin-Tse C, Osei-Owusu I, O'Heir E, O'Leary M, Pais L, Stafki SA, Daugherty AL, Folland C, Peric S, Fahmy N, Udd B, Horáková M, Łusakowska A, Manoj R, Nalini A, Karcagi V, Polavarapu K, Lochmüller H, Horvath R, Bönnemann CG, Donkervoort S, Haliloğlu G, Herguner O, Kang PB, Ravenscroft G, Laing N, Scott HS, Töpf A, Straub V, Pajusalu S, Õunap K, Tiao G, Rehm HL, O'Donnell-Luria A. Weisburd B, et al. Genet Med. 2025 Apr;27(4):101336. doi: 10.1016/j.gim.2024.101336. Epub 2024 Dec 9. Genet Med. 2025. PMID: 39670433

Abstract

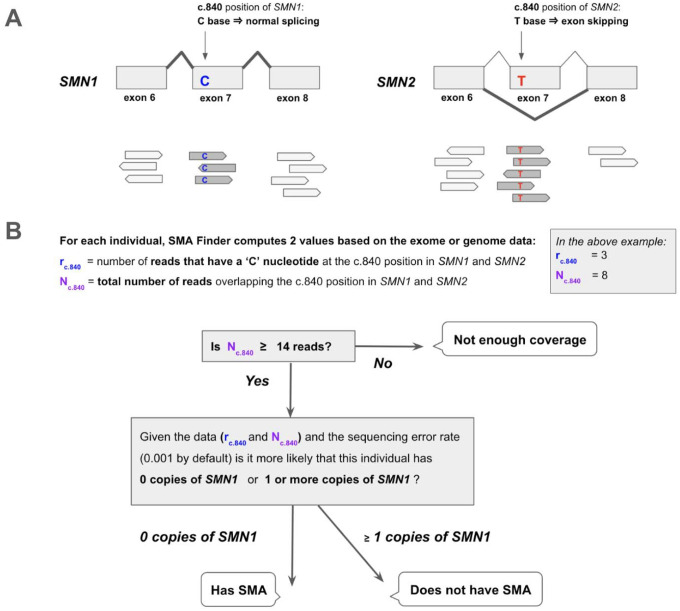
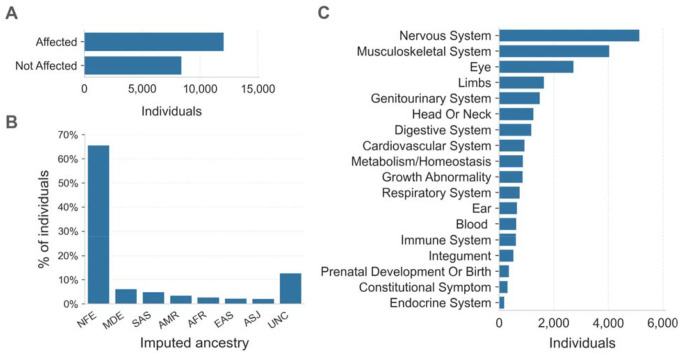
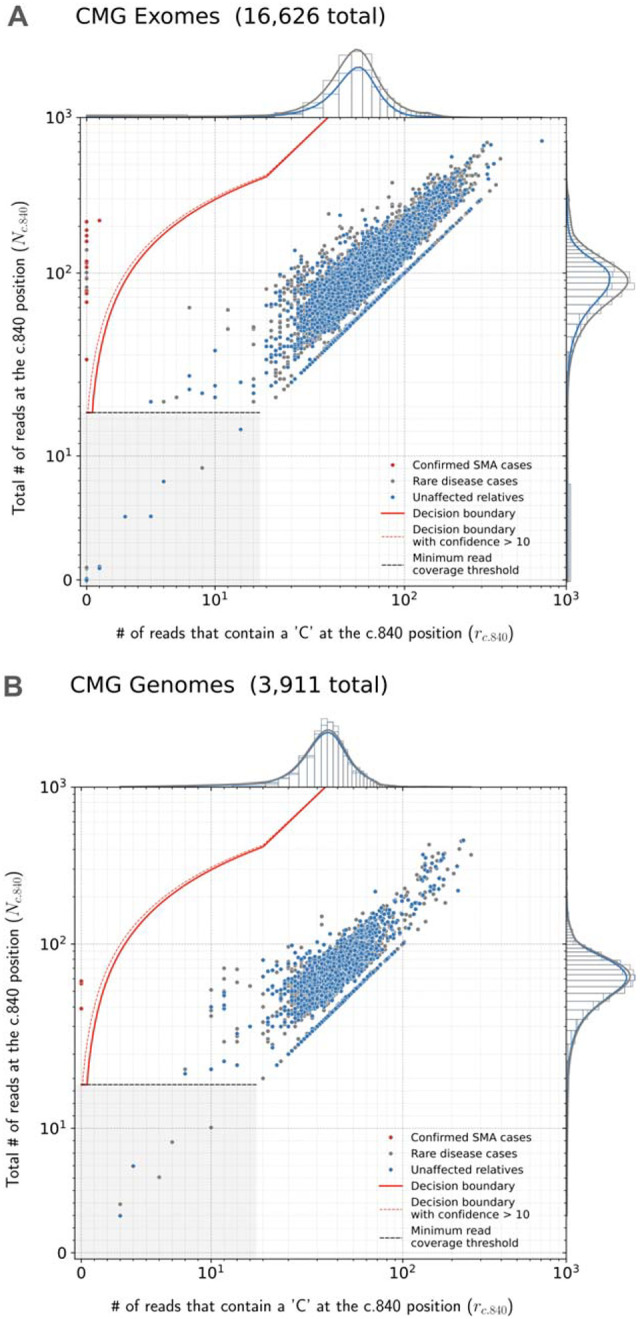
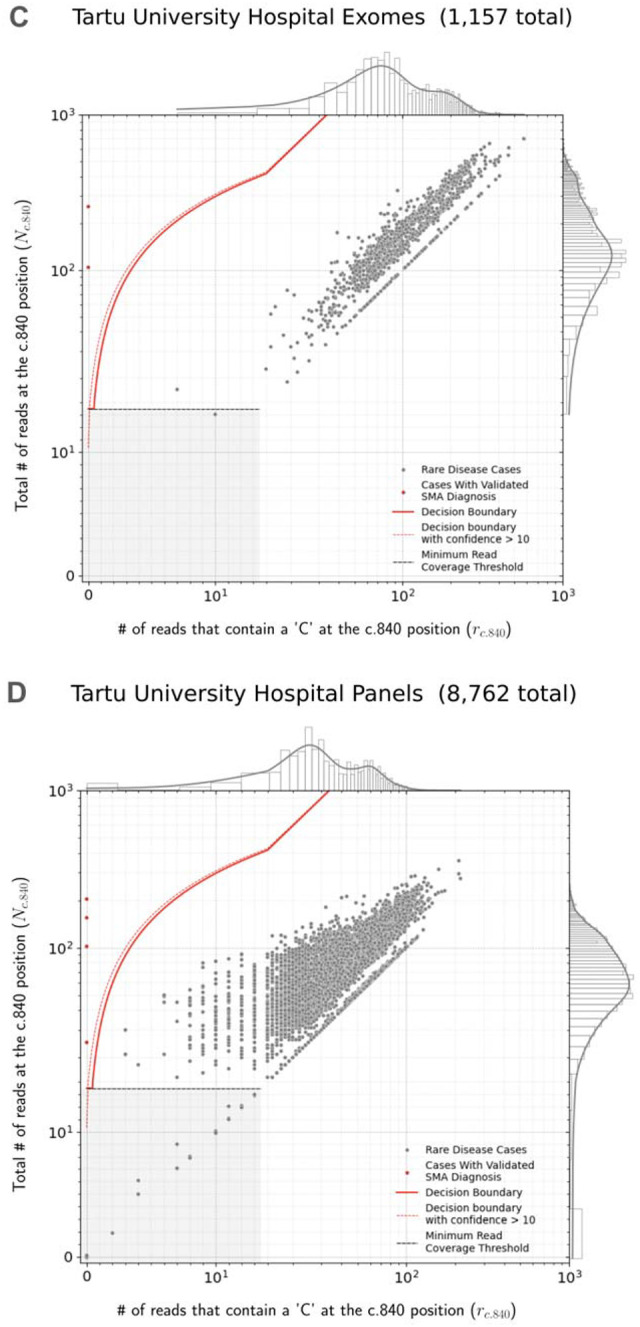
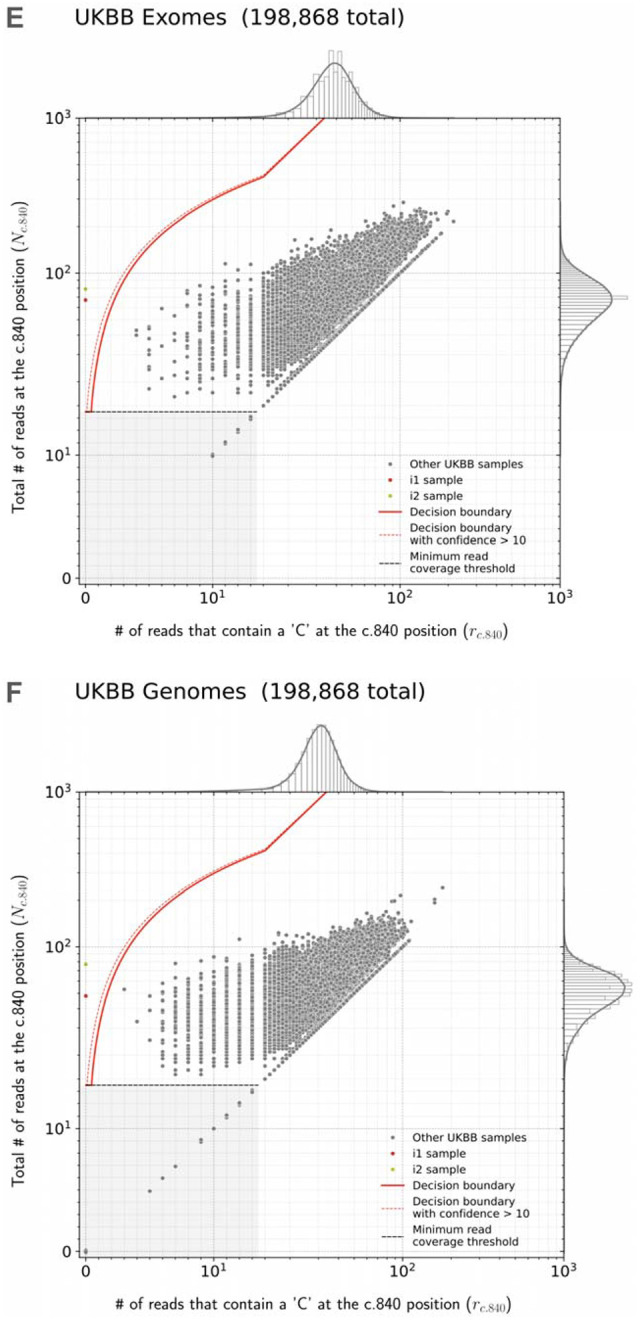
Spinal muscular atrophy (SMA) is a genetic disorder that causes progressive degeneration of lower motor neurons and the subsequent loss of muscle function throughout the body. It is the second most common recessive disorder in individuals of European descent and is present in all populations. Accurate tools exist for diagnosing SMA from genome sequencing data. However, there are no publicly available tools for GRCh38-aligned data from panel or exome sequencing assays which continue to be used as first line tests for neuromuscular disorders. This deficiency creates a critical gap in our ability to diagnose SMA in large existing rare disease cohorts, as well as newly sequenced exome and panel datasets. We therefore developed and extensively validated a new tool - SMA Finder - that can diagnose SMA not only in genome, but also exome and panel sequencing samples aligned to GRCh37, GRCh38, or T2T-CHM13. It works by evaluating aligned reads that overlap the c.840 position of SMN1 and SMN2 in order to detect the most common molecular causes of SMA. We applied SMA Finder to 16,626 exomes and 3,911 genomes from heterogeneous rare disease cohorts sequenced at the Broad Institute Center for Mendelian Genomics as well as 1,157 exomes and 8,762 panel sequencing samples from Tartu University Hospital. SMA Finder correctly identified all 16 known SMA cases and reported nine novel diagnoses which have since been confirmed by clinical testing, with another four novel diagnoses undergoing validation. Notably, out of the 29 total SMA positive cases, 23 had an initial clinical diagnosis of muscular dystrophy, congenital myasthenic syndrome, or myopathy. This underscored the frequency with which SMA can be misdiagnosed as other neuromuscular disorders and confirmed the utility of using SMA Finder to reanalyze phenotypically diverse neuromuscular disease cohorts. Finally, we evaluated SMA Finder on 198,868 individuals that had both exome and genome sequencing data within the UK Biobank (UKBB) and found that SMA Finder's overall false positive rate was less than 1 / 200,000 exome samples, and its positive predictive value (PPV) was 97%. We also observed 100% concordance between UKBB exome and genome calls. This analysis showed that, even though it is located within a segmental duplication, the most common causal variant for SMA can be detected with comparable accuracy to monogenic disease variants in non-repetitive regions. Additionally, the high PPV demonstrated by SMA Finder, the existence of treatment options for SMA in which early diagnosis is imperative for therapeutic benefit, as well as widespread availability of clinical confirmatory testing for SMA, warrants the addition of SMN1 to the ACMG list of genes with reportable secondary findings after genome and exome sequencing.


Conflict of interest statement

HLR receives research funding from Microsoft and previously received funding from Illumina to support rare disease gene discovery and diagnosis. AODL has consulted for Tome Biosciences, Ono Pharma USA Inc, and Addition Therapeutics, and is member of the scientific advisory board for Congenica Inc and the Simons Foundation SPARK for Autism study. AL received honoraria for speaking at educational events for Biogen, PTC and Roche, is a subinvestigator in clinical trials by Roche and PTC, and is involved in a project supported by Biogen (POL-SMA-17-11166). PBK has received research support from ML Bio and Sarepta Therapeutics, and has consulted for Lupin, Neurogene, NS Pharma, and Teneofour.

Figures

Figure 1.
Figure 1.. Detecting SMA using reads aligned to the SMN1 and SMN2 paralogs
A. The SMN1 and SMN2 paralogs are 99.9% identical. One of the few differences between them occurs at their c.840 position. The ‘C’ at this position in SMN1 leads to proper splicing, while the ‘T’ in SMN2 leads to skipping of exon 7 in most SMN2 transcripts. Individuals that have zero functional copies of SMN1 develop spinal muscular atrophy (SMA), and the severity of their disease is inversely proportional to the number of copies of SMN2 in their genome since each copy of SMN2 can produce a small amount of SMN protein. B. SMA Finder works by counting all aligned reads that overlap the c.840 position in both SMN1 and SMN2 and then computing the fraction of reads that have a ‘C’ at that position. This fraction is interpreted as the fraction of intact SMN1 copies in the individual’s genome. When it is near zero, it implies the absence of any functional copies of SMN1, and therefore suggests that the sample is positive and the individual has a diagnosis of SMA.
Figure 2.
Figure 2.. Overview of the CMG rare disease cohort
A. The affected status of individuals in the CMG cohort is shown on the y-axis. 12,045 individuals are in the Affected category, 8,401 are Not Affected, and 91 individuals have unknown affected status. Here “Affected” means that the individual was enrolled in a rare disease cohort due to having a disease considered to be rare and most likely genetic in origin. B. Inferred ancestry of individuals within the CMG cohort is shown on the x-axis: NFE (Non-Finnish Europeans), MDE (Middle Eastern), SAS (South Asian), AMR (Admixed American), AFR (African/African American), EAS (East Asian), ASJ (Ashkenazi Jewish), and UNC (unclassified). C. The top-level categories from the Human Phenotype Ontology (HPO) are shown on the y-axis. Any individual with multiple HPO terms was counted only once in each category but may be counted more than once across categories.
Fig 3.
Fig 3.. SMA Finder results
Read counts measured by SMA Finder in exome (A) and genome (B) samples from CMG cohorts, as well exomes (C) and panel sequencing samples (D) from Tartu University Hospital. Each dot represents a sample. The red line represents the decision boundary used by SMA Finder which reports samples to the left of the boundary as SMA-positive. Samples in the gray box where y ≤ 14 are reported as having insufficient read coverage to make a call. The red dots represent previously known SMA diagnoses, the gray dots are rare disease cases (including the new SMA diagnoses), and the blue dots are unaffected relatives. To clearly show points across a large range of read count values, the x and y axes use a symmetrical log scale that is linear in the range 0 ≤ x ≤ 14 and 0 ≤ y ≤ 14 before switching to a logarithmic scale for x or y > 14. This choice of scale causes part of the decision boundary to appear curved even though it is linear in standard Cartesian coordinates. E and F show SMA Finder read counts for 198,868 UKBB exomes and genomes respectively. The red dot represents UKBB sample i1 which had phenotype records consistent with an SMA diagnosis and was called positive by both SMA Finder and SMNCopyNumberCaller. The yellow dot represents i2 which was only called positive by SMA Finder and was a no-call from SMNCopyNumberCaller. Marginal histograms show the density of scatter plot points along each axis, with the histogram along the vertical axis showing a distribution of read counts overlapping the c.840 position in SMN1 + SMN2, while the histogram along the horizontal axis shows the number of reads with a ‘C’ at the c.840 position. NOTE: The exome, genome, and panel sequencing samples in A and B as well as in C and D are largely from non-overlapping sets of individuals, while the exomes and genomes in E and F are alternative samples from the same set of 198,868 individuals in UKBB.

References

    1. Sarv S. et al. The Birth Prevalence of Spinal Muscular Atrophy: A Population Specific Approach in Estonia. Front. Genet. 12, 796862 (2021). - PMC - PubMed
    1. Verhaart I. E. C. et al. Prevalence, incidence and carrier frequency of 5q-linked spinal muscular atrophy - a literature review. Orphanet J. Rare Dis. 12, 124 (2017). - PMC - PubMed
    1. Chen X. et al. Spinal muscular atrophy diagnosis and carrier screening from genome sequencing data. Genet. Med. 22, 945–953 (2020). - PMC - PubMed
    1. Schorling D. C., Pechmann A. & Kirschner J. Advances in Treatment of Spinal Muscular Atrophy - New Phenotypes, New Challenges, New Implications for Care. J Neuromuscul Dis 7, 1–13 (2020). - PMC - PubMed
    1. Lefebvre S. et al. Identification and characterization of a spinal muscular atrophy-determining gene. Cell 80, 155–165 (1995). - PubMed

Publication types