. 2024 Jan 25;16(1):e52927.
doi: 10.7759/cureus.52927. eCollection 2024 Jan.

Biliary Disease in a Tertiary Care Hospital: A Review of Clinical and Radiological Burden

Affiliations

Biliary Disease in a Tertiary Care Hospital: A Review of Clinical and Radiological Burden

Rawan A Mahdi et al. Cureus. .

Abstract

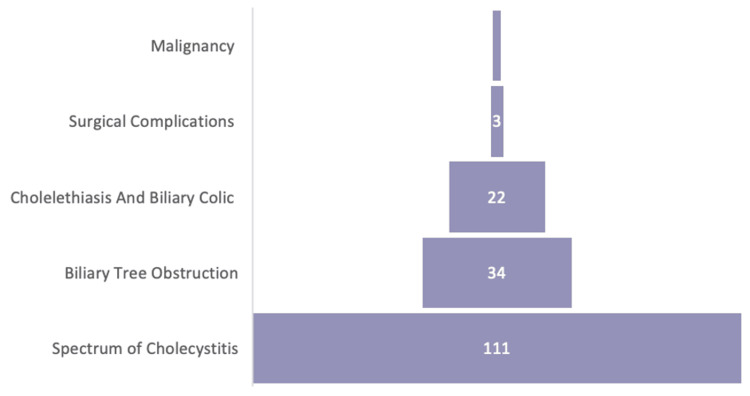
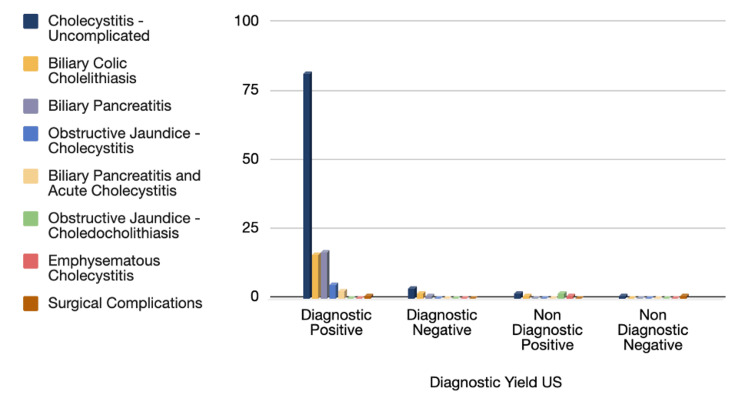
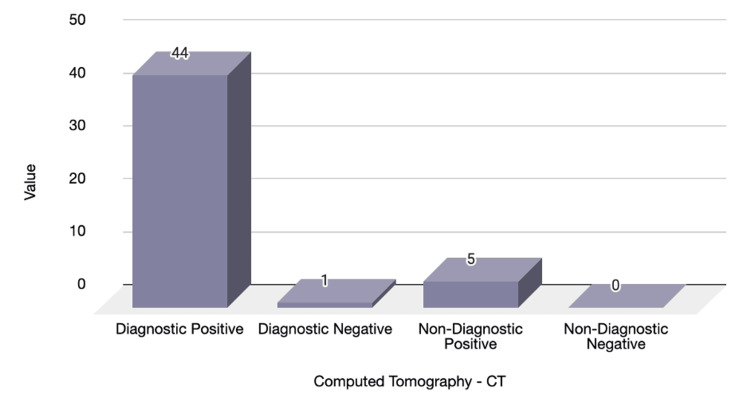
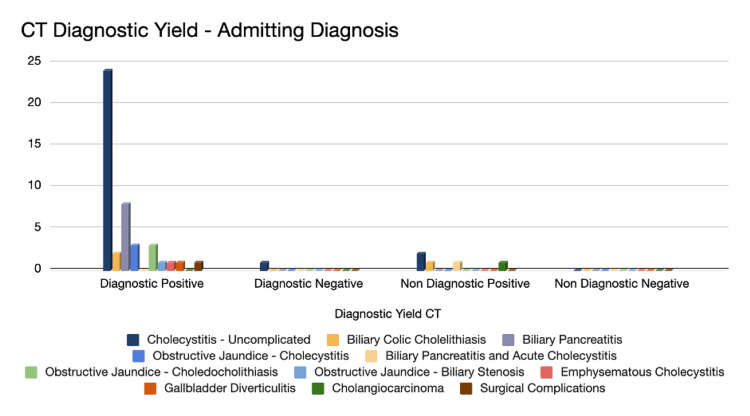
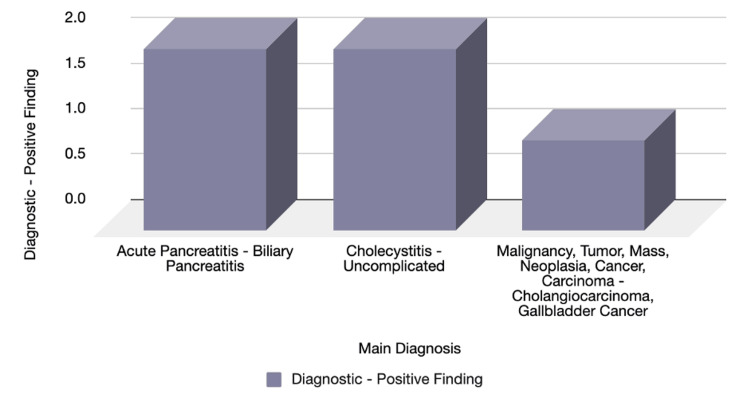
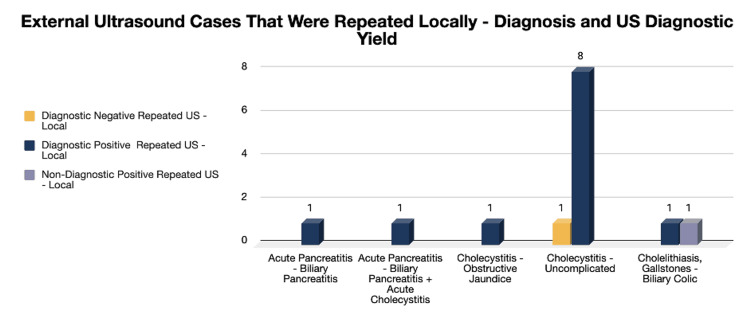
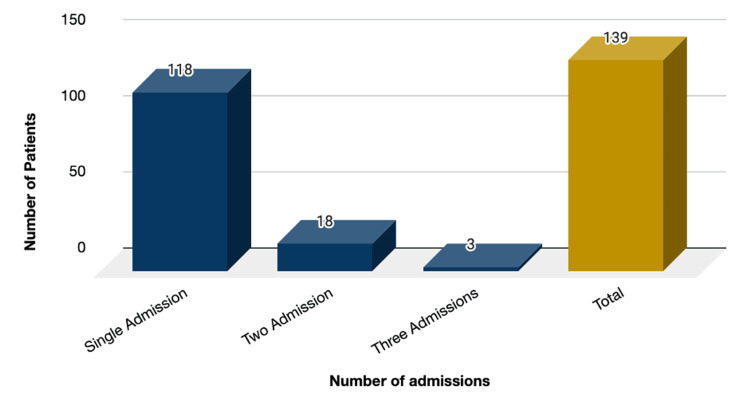
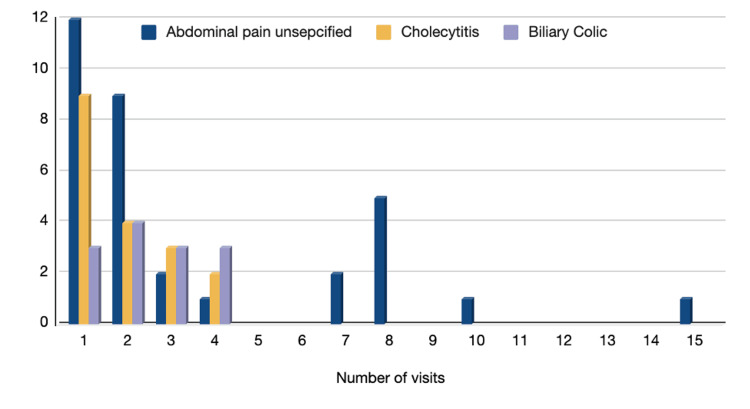
Introduction Gallbladder disease accounts for a significant percentage of surgical admissions per year. A review of these cases was done to assess their hospital impact with an evaluation of the efficacy of radiological modalities in terms of evaluation, ideal use, and clinical application. Therefore, this study aims to review the demographics of the disease, the diagnostic yield of radiological modalities, and the overall outcome in regards to the hospital policies and medical services provided in hopes of achieving suitable clinical pathways, increasing the efficiency of gallbladder disease assessment, and limiting unwarranted investigations. Methods This is a single-center, retrospective study that included all the surgical emergency admissions from January 1st to December 31st 2018, in the Salmaniya Medical Complex, Kingdom of Bahrain. A total sample of 163 emergency admissions (cases) was selected from those aged 14 and older with documented biliary stones or biliary-related disease. A review of radiological modalities for diagnosis included plain radiographs (AXR, CXR), US abdomen, CT scans, and MRCP/MRI, which were then correlated with histopathological findings confirming the presence of gallstone disease. In addition to evaluating readmissions and emergency visits in terms of hospital burden. Results One hundred and sixty-three (10.44%) of 1,562 surgical admission cases in 2018 were diagnosed with biliary tree disease (76 males, 87 females). A total of 419 different radiological investigations were requested in 161 of the cases evaluated: 53.7% of plain radiographs (AXR, CXR), 33.2% of US abdomen, 11.9% of CT scan, and 1.2% of MRCP/MRI. Ultrasound showed a sensitivity of 48.72% and a specificity of 100%, while CT scan sensitivity was 57.14% and a specificity of 100% when it came to detecting gallstones and gallbladder-related disease. Plain radiographs add no direct benefit to diagnosing biliary disease. Conclusion Gallbladder disease is very prevalent with a wide array of disease entities, requiring radiological assistance in diagnosis. Ultrasound is the ideal modality for the diagnosis of biliary disease due to its ease of use and availability; it has high sensitivity and specificity, and it can be complemented by other modalities such as CT scans and MRCP/MRI when it comes to assessing for complications. On the other hand, plain radiographs have no significant value in the detection of gallbladder-related disease, and their utilization should be limited to emergency cases with high clinical suspicion.

Keywords: biliary pancreatitis; cholecystitis; cholelithiasis; hospital burden; ultrasound imaging.


Conflict of interest statement

The authors have declared that no competing interests exist.

Figures

Figure 1
Figure 1. General demographics: Gender and nationality distribution
n=163 (10.44%) of the starting 1,562 data which were divided into gender (76 males [46.6%] and 87 females [53.4%]) and nationality. Highest values in following countries: Bahrain (n=99, 60.7%), Philippines (n=16, 9.8%), India (n=13, 8%), Bangladesh (n=10, 6.1%), Pakistan (n=8, 5%) and others (n=17,  10.4%), respectively
Figure 2
Figure 2. Diagnosis trends based on categories
Total (n=172) different diagnoses. Spectrum of cholecystitis (n=111, 64.5%), biliary tree obstruction (n=34, 19.8%), cholelethiais and biliary colic (n=22, 12.8%), surgical complications (n=3, 1.7%), and malignancy (n=2, 1.2%).
Figure 3
Figure 3. The spectrum of cholecystitis disease
*Total number of diagnoses adjusted for concomitant pathology The spectrum of cholecystitis (n=111) is distributed into subtypes: Cholecystitis uncomplicated (n=100, 90%), cholecystitis with obstructive jaundice (n=6, 5%), cholecystitis with biliary pancreatitis (n=3, 3%), cholecystitis with emphysematous/gangrenous (n=1, 1%), gallbladder diverticulitis (n=1, 1%)
Figure 4
Figure 4. Imaging modalities %
Modalities supporting the diagnosis of biliary disease studied in our population (n=163) in our facility. Plain radiographs (n=225, 53.7%), US (n=139, 33.2%), CT scan (n=50, 11.9%), MRCP (n=5,  1.2%)
Figure 5
Figure 5. Ultrasound diagnostic yield: admitting diagnosis
Number of cases with ultrasound: 139 out of 163. Cholecystitis: uncomplicated (n=89 - 64%), biliary colic: cholelithiasis (n=19, 13.7%), biliary pancreatitis (n=18, 13%), obstructive jaundice: cholecystitis (n=5, 3.6%), biliary pancreatitis and acute cholecystitis (n= 3, 2.2%), obstructive jaundice: choledocholithiasis (n=2, 1.4%), emphysematous cholecystitis (n=1, 0.7%), surgical complications (n=2, 1.4%).
Figure 6
Figure 6. CT Abdomen diagnostic yield
Number of cases with CT scan: 50 out of 163. Diagnostic positive (n=44, 88%), Diagnostic negative (n=1, 2%), non-diagnostic positive (n=5, 10%), non-diagnostic negative (n=0, 0%)
Figure 7
Figure 7. CT diagnostic yield: admitting diagnosis
Number of cases with CT scan: 50 out of 163. Cholecystitis: Uncomplicated (n=27,  54%), biliary colic: cholelithiasis (n=3, 6%), biliary pancreatitis (n=8, 16%), obstructive jaundice: cholecystitis (n=3, 6%), biliary pancreatitis and acute cholecystitis (n= 1, 2%), obstructive jaundice: choledocholithiasis (n=3, 6%), obstructive jaundice: biliary stenosis (n=1, 2%), emphysematous cholecystitis (n=1, 2%), gallbladder diverticulitis (n=1, 2%), cholangiocarcinoma (n=1, 2%), surgical complications (n=1, 2%)
Figure 8
Figure 8. MRI diagnostic yield
Number of cases with MRCP/MRI: five out of 163. Acute pancreatitis: biliary pancreatitis (n=2, 40%), cholecystitis: uncomplicated (n=2, 40%), malignancy (n=1, 20%).
Figure 9
Figure 9. External ultrasound cases that were repeated locally: diagnosis and US diagnostic yield
14 cases out of the 163-sample population had repeated ultrasound imaging both externally (in a private hospital) and locally in our facility. Cholecystitis: uncomplicated (n=9, 64.3%), cholecystitis with obstructive jaundice (n=1, 7.14%), acute pancreatitis, biliary pancreatitis (n=1, 7.14%), acute pancreatitis, biliary pancreatitis + acute cholecystitis (n=1, 7.14%), cholelithiasis, gallstones: biliary colic (n=2, 14.3%).
Figure 10
Figure 10. Recurrent admissions
Out of the n=163 sample population, 118 had a single admission (72.39%), 18 had two admissions (11.04%), and three cases had three admissions (1.84%).
Figure 11
Figure 11. Most common diagnosis for revisits within one year
Out of 139 individuals (n=163 cases, adjusted for patients with readmissions): 21 patients were readmitted more than twice within a one-year time period from the index admission. The graph shows a total of 77 emergency episodes out of n=163 cases (adjusted for patients with readmissions) and the most common cause of revisits within a one-year time period from index admission: Abdominal pain (n=33, 43%), cholecystitis (n=18,  23.4%), biliary colic (n=13, 16.8%), and others (n=13, 16.8%).
Figure 12
Figure 12. Risk factors for gallstones
The comorbidities taken into account in this study included entities directly linked to biliary disease development. Their presence in all cases accounted for 139 patients (adjusted for the same individuals with recurrent visits) and was calculated at 285 comorbidities with a direct link to biliary disease development. The graph demonstrates percentages based on their frequency: Age >40 (n=90, 31.6%), female gender (n=87, 30.5%), obesity (n=50,  17.5%), diabetes mellitus (n=27, 9.5%), weight loss (n=9, 3.2%), sickle cell disease (n=6, 2.1% ), dyslipidemia (n=16, 5.6%)
Figure 13
Figure 13. Length of hospital stay
Number of cases (n=163) vs. the length of hospital stay in days (< 3 days to >20 days) < 3 days (n=29, 17.8%), 3-5 days (n=80, 49%), 6-8 days (n=29, 17.8%), 9-11 days (n=9, 5.5%), 12-14 days (n=7, 4.3%), 15-17 days (n=4, 2.5%), 20+ days (n=5, 3.1%)

Similar articles

References

    1. "One-day, one-stay, and one-step" lessons from the Danish guidelines for the treatment of gallstone disease. Verdonk RC, de Reuver PR. Hepatobiliary Surg Nutr. 2023;12:607–610. - PMC - PubMed
    1. Incremental net benefit of cholecystectomy compared with alternative treatments in people with gallstones or cholecystitis: a systematic review and meta-analysis of cost-utility studies. Bagepally BS, Sajith Kumar S, Natarajan M, Sasidharan A. BMJ Open Gastroenterol. 2022;9 - PMC - PubMed
    1. The burden of gallstone disease in the United States population. Unalp-Arida A, Ruhl CE. :2022. - PMC - PubMed
    1. Gallstones: Watch and wait, or intervene? Ibrahim M, Sarvepalli S, Morris-Stiff G, et al. Cleve Clin J Med. 2018;85:323–331. - PubMed
    1. Evidence-based current surgical practice: calculous gallbladder disease. Duncan CB, Riall TS. J Gastrointest Surg. 2012;16:2011–2025. - PMC - PubMed

LinkOut - more resources