MX1 and UBE2L6 are potential metaflammation gene targets in both diabetes and atherosclerosis
- PMID: 38406276
- PMCID: PMC10893863
- DOI: 10.7717/peerj.16975
MX1 and UBE2L6 are potential metaflammation gene targets in both diabetes and atherosclerosis
Abstract
Background: The coexistence of diabetes mellitus (DM) and atherosclerosis (AS) is widespread, although the explicit metabolism and metabolism-associated molecular patterns (MAMPs) responsible for the correlation are still unclear.
Methods: Twenty-four genetically wild-type male Ba-Ma mini pigs were randomly divided into five groups distinguished by different combinations of 90 mg/kg streptozotocin (STZ) intravenous injection and high-cholesterol/lipid (HC) or high-lipid (HL) diet feeding for 9 months in total. Pigs in the STZ+HC and STZ+HL groups were injected with STZ first and then fed the HC or HL diet for 9 months. In contrast, pigs in the HC+STZ and HL+STZ groups were fed the HC or HL diet for 9 months and injected with STZ at 3 months. The controls were only fed a regular diet for 9 months. The blood glucose and abdominal aortic plaque observed through oil red O staining were used as evaluation indicators for successful modelling of DM and AS. A microarray gene expression analysis of all subjects was performed.
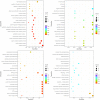
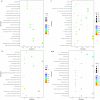
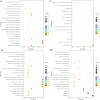
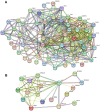
Results: Atherosclerotic lesions were observed only in the HC+STZ and STZ+HC groups. A total of 103 differentially expressed genes (DEGs) were identified as common between them. The most significantly enriched pathways of 103 common DEGs were influenza A, hepatitis C, and measles. The global and internal protein-protein interaction (PPI) networks of the 103 common DEGs consisted of 648 and 14 nodes, respectively. The top 10 hub proteins, namely, ISG15, IRG6, IRF7, IFIT3, MX1, UBE2L6, DDX58, IFIT2, USP18, and IFI44L, drive aspects of DM and AS. MX1 and UBE2L6 were the intersection of internal and global PPI networks. The expression of MX1 and UBE2L6 was 507.22 ± 342.56 and 96.99 ± 49.92 in the HC+STZ group, respectively, which was significantly higher than others and may be linked to the severity of hyperglycaemia-related atherosclerosis. Further PPI network analysis of calcium/micronutrients, including MX1 and UBE2L6, consisted of 58 and 18 nodes, respectively. The most significantly enriched KEGG pathways were glutathione metabolism, pyrimidine metabolism, purine metabolism, and metabolic pathways.
Conclusions: The global and internal PPI network of the 103 common DEGs consisted of 648 and 14 nodes, respectively. The intersection of the nodes of internal and global PPI networks was MX1 and UBE2L6, suggesting their key role in the comorbidity mechanism of DM and AS. This inference was partly verified by the overexpression of MX1 and UBE2L6 in the HC+STZ group but not others. Further calcium- and micronutrient-related enriched KEGG pathway analysis supported that MX1 and UBE2L6 may affect the inflammatory response through micronutrient metabolic pathways, conceptually named metaflammation. Collectively, MX1 and UBE2L6 may be potential common biomarkers for DM and AS that may reveal metaflammatory aspects of the pathological process, although proper validation is still needed to determine their contribution to the detailed mechanism.
Keywords: Atherosclerosis; Biomarker signatures; Diabetes; Differentially expressed genes; Protein–protein interaction.
© 2024 Wang et al.
Conflict of interest statement
The authors declare that they have no competing interests.
Figures


Similar articles
-
Establishment of type 2 diabetes mellitus models using streptozotocin after 3 months high-fat diet in Bama minipigs.Anim Biotechnol. 2023 Dec;34(7):2295-2312. doi: 10.1080/10495398.2022.2088548. Epub 2022 Jun 24. Anim Biotechnol. 2023. PMID: 35749713
-
Bioinformatics analysis of vascular RNA-seq data revealed hub genes and pathways in a novel Tibetan minipig atherosclerosis model induced by a high fat/cholesterol diet.Lipids Health Dis. 2020 Mar 25;19(1):54. doi: 10.1186/s12944-020-01222-w. Lipids Health Dis. 2020. PMID: 32213192 Free PMC article.
-
Whole Transcriptomic Analysis of Key Genes and Signaling Pathways in Endogenous ARDS.Dis Markers. 2022 Oct 4;2022:1614208. doi: 10.1155/2022/1614208. eCollection 2022. Dis Markers. 2022. PMID: 36246560 Free PMC article.
-
Identification of hub genes and establishment of a diagnostic model in tuberculosis infection.AMB Express. 2024 Apr 13;14(1):36. doi: 10.1186/s13568-024-01691-7. AMB Express. 2024. PMID: 38615114 Free PMC article.
-
[Biochemical and pathological analysis of mice with type 2 diabetes mellitus induced by high-fat diet and low-dose streptozotocin injections].Nan Fang Yi Ke Da Xue Xue Bao. 2014 Jul;34(8):1115-20. Nan Fang Yi Ke Da Xue Xue Bao. 2014. PMID: 25176077 Chinese.
Cited by
-
Applications of gene pair methods in clinical research: advancing precision medicine.Mol Biomed. 2025 Apr 9;6(1):22. doi: 10.1186/s43556-025-00263-w. Mol Biomed. 2025. PMID: 40202606 Free PMC article. Review.
-
Exploration of potential biomarkers and immune cell infiltration characteristics for peripheral atherosclerosis in sjögren's syndrome based on comprehensive bioinformatics analysis and machine learning.Front Genet. 2025 Jul 30;16:1546315. doi: 10.3389/fgene.2025.1546315. eCollection 2025. Front Genet. 2025. PMID: 40809841 Free PMC article.
-
Identification of Shared Biomarkers in Chronic Kidney Disease and Diabetic Nephropathy Using Single-Cell Sequencing.Diabetes Metab Syndr Obes. 2025 Jul 5;18:2155-2174. doi: 10.2147/DMSO.S514319. eCollection 2025. Diabetes Metab Syndr Obes. 2025. PMID: 40636753 Free PMC article.
-
Revealing the critical state and identifying individualized dynamic network biomarker for type 2 diabetes through advanced analysis methods on individual basis.Sci Rep. 2025 Jan 31;15(1):3925. doi: 10.1038/s41598-025-87438-1. Sci Rep. 2025. PMID: 39890881 Free PMC article.
-
Identification of compounds to promote diabetic wound healing based on transcriptome signature.Front Pharmacol. 2025 Jun 2;16:1576056. doi: 10.3389/fphar.2025.1576056. eCollection 2025. Front Pharmacol. 2025. PMID: 40529493 Free PMC article.
References
-
- Anderson D, Neri J, Souza CRM, Valverde JG, De Araujo JMG, Nascimento M, Branco RCC, Arrais NMR, Lassmann T, Blackwell JM, Jeronimo SMB. Zika virus changes methylation of genes involved in immune response and neural development in Brazilian babies born with congenital microcephaly. Journal of Infectious Diseases. 2021;223(3):435–440. doi: 10.1093/infdis/jiaa383. - DOI - PubMed
MeSH terms
Substances
LinkOut - more resources
Full Text Sources
Medical
Research Materials
Miscellaneous

