The effect of age and resilience on the dose-response function between the number of adversity factors and subjective well-being
- PMID: 38406308
- PMCID: PMC10884289
- DOI: 10.3389/fpsyg.2024.1332124
The effect of age and resilience on the dose-response function between the number of adversity factors and subjective well-being
Abstract
Background: Encountering challenges and stress heightens the vulnerability to mental disorders and diminishes well-being. This study explores the impact of psychological resilience in the context of adverse events, considering age-related variations in its influence on well-being.
Methods: A total of 442 participants (male vs. female =48% vs. 52%) with a mean age of 41.79 ± 16.99 years were collected and completed the following questionnaires Brief Betrayal Trauma Survey (BBTS), Brief Resilience Scale (BRS), Peace of Mind (PoM), The World Health Organization Quality of Life-BREF (WHOQOL-BREF), and Social Support Questionnaire (SSQ). They all underwent structural and resting-state functional magnetic resonance imaging (MRI) scans.
Results: Participants were categorized based on adversity levels: 34.39% faced one, 26.24% none, and 19.91, 9.50, and 8.14% encountered two, three, and four adversities, respectively. This categorization helps assess the impact on participants' experiences. As adversity factors increased, PoM decreased. Controlling for age improved PoM model fit (ΔR2 = 0.123, p < 0.001). Adversity factors and age explained 14.6% of PoM variance (df = 2, F = 37.638, p < 0.001). PoM decreased with more adversity and increased with higher age.
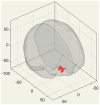
Conclusion: The study found most participants faced at least one adversity. Adversity negatively affected PoM scores, while resilience acted as a protective factor. Resilience plays a crucial role in buffering the impact of adversities on well-being. Among those with high adversity, higher resilience correlated with stronger DMN-right frontal pole connectivity. Brain volume showed no significant differences, but the quality of life and social support varied between subgroups, with no differences in personal demographic and biophysical features.
Keywords: adversity; aging; dose–response; resilience; well-being.
Copyright © 2024 Hsieh, Chang, Yao, Yang and Yang.
Conflict of interest statement
The authors declare that the research was conducted in the absence of any commercial or financial relationships that could be construed as a potential conflict of interest. The author(s) declared that they were an editorial board member of Frontiers, at the time of submission. This had no impact on the peer review process and the final decision.
Figures


Similar articles
-
Social support enhances the mediating effect of psychological resilience on the relationship between life satisfaction and depressive symptom severity.Sci Rep. 2023 Mar 24;13(1):4818. doi: 10.1038/s41598-023-31863-7. Sci Rep. 2023. PMID: 36964160 Free PMC article.
-
The association between specific types of childhood adversity and attenuated psychotic symptoms in a community sample.Early Interv Psychiatry. 2019 Apr;13(2):281-289. doi: 10.1111/eip.12478. Epub 2017 Sep 20. Early Interv Psychiatry. 2019. PMID: 28941143
-
Mental health and resilience at older ages: bouncing back after adversity in the British Household Panel Survey.J Epidemiol Community Health. 2008 Nov;62(11):987-91. doi: 10.1136/jech.2007.069138. J Epidemiol Community Health. 2008. PMID: 18854503
-
Resilience after adversity: an umbrella review of adversity protective factors and resilience-promoting interventions.Front Psychiatry. 2024 Oct 4;15:1391312. doi: 10.3389/fpsyt.2024.1391312. eCollection 2024. Front Psychiatry. 2024. PMID: 39429523 Free PMC article.
-
Resilience and the brain: a key role for regulatory circuits linked to social stress and support.Mol Psychiatry. 2020 Feb;25(2):379-396. doi: 10.1038/s41380-019-0551-9. Epub 2019 Oct 18. Mol Psychiatry. 2020. PMID: 31628419 Review.
Cited by
-
Perceived Stress, Resilience and Emotional Intelligence in Romanian Healthcare Professionals.Healthcare (Basel). 2024 Nov 22;12(23):2336. doi: 10.3390/healthcare12232336. Healthcare (Basel). 2024. PMID: 39684958 Free PMC article.
-
Resilient Coping Levels and Psychometric Properties of the Brief Resilient Coping Scale Among Nursing Professionals in Saudi Arabia.Healthcare (Basel). 2024 Nov 1;12(21):2181. doi: 10.3390/healthcare12212181. Healthcare (Basel). 2024. PMID: 39517392 Free PMC article.
References
-
- Chang Z.-Y. (1989). A study of correlation among self-control, social support and learn-tired among university students (MSc), National Chuanghua University of Education, Chuanghua, Taiwan.
-
- Chen C. (2017). Mindfulness predicts subjective well-being and depression: mediating effect analysis. J. Health Promot. Health Educ. 48, 1–34. doi: 10.3966/207010632017120048001 - DOI
-
- Chiu C. D., Yeh Y. Y., Huang C. L., Wu Y. C., Yeh Y. C., Lin C. C., et al. . (2010). Unintentional memory inhibition is weakened in non-clinical dissociators. Journal of Behavior Therapy and Experimental Psychiatry. 41:117–124. - PubMed
LinkOut - more resources
Full Text Sources
Research Materials
Miscellaneous

