. 2024 Feb 9:18:1286991.
doi: 10.3389/fnins.2024.1286991. eCollection 2024.

Quantitative evaluation of embedding resins for volume electron microscopy

Affiliations

Quantitative evaluation of embedding resins for volume electron microscopy

Lennart Tegethoff et al. Front Neurosci. .

Abstract

Optimal epoxy resin embedding is crucial for obtaining consistent serial sections from large tissue samples, especially for block faces spanning >1 mm2. We report a method to quantify non-uniformity in resin curing using block hardness measurements from block faces. We identify conditions that lead to non-uniform curing as well as a procedure to monitor the hardness of blocks for a wide range of common epoxy resins used for volume electron microscopy. We also assess cutting repeatability and uniformity by quantifying the transverse and sectional cutting forces during ultrathin sectioning using a sample-mounted force sensor. Our findings indicate that screening and optimizing resin formulations is required to achieve the best repeatability in terms of section thickness. Finally, we explore the encapsulation of irregularly shaped tissue samples in a gelatin matrix prior to epoxy resin embedding to yield more uniform sections.

Keywords: cutting forces; epoxy resin; hardness; tissue embedding; volume electron microscopy (vEM).


Conflict of interest statement

The authors declare that the research was conducted in the absence of any commercial or financial relationships that could be construed as a potential conflict of interest.

Figures
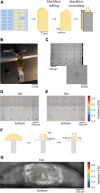
FIGURE 1
FIGURE 1
Hardness uniformity of resin blocks. (A) Illustration of the preparation of resin blocks for hardness testing. Blue arrows indicate the surface that was tested. (B) Resin block clamped in place for indentation hardness measurements. (C) A representative grid pattern for hardness mapping of a block face. Inset shows an individual diamond indentation from which hardness is calculated. (D) Hardness measurements from an EMbed 812 MH block cured in a silicon mold. (E) Hardness measurements from EMbed 812 MH resin that was first degassed prior to curing. (F) Illustration of the preparation of resin cross-sections that were cured on aluminum stubs for hardness testing. Blue arrows indicate the surface that was tested. (G) Hardness measurements from EMbed 812 MH resin that was first cured on a stub. Measurements were made from a cross-section of the dome of resin, perpendicular to the stub surface.
FIGURE 2
FIGURE 2
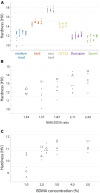
Hardness of different resin formulations. (A) Hardness values from independent blocks for each of the tested resins. Hardness (n = 8–20 points per block face) was measured for three or four blocks of each resin type. (B) The hardness of EMbed 812 measured for different ratios of hardeners NMA and DDSA. (C) Hardness of EMbed 812 MH cured with different concentrations of the accelerator (BDMA).
FIGURE 3
FIGURE 3
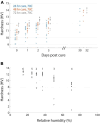
Time varying and environmental properties of resin hardness. (A) EMbed 812 blocks cured for 24 (blue), 48 (red), or 72 (grey) hours and then measured for hardness at different days post-cure. (B) Hardness of an EMbed 812 MH resin block measured at different relative humidities. Small numbers indicate the sequence in which measurements were performed.
FIGURE 4
FIGURE 4
Force profile measurements. (A) A photograph of the force sensors (S1 and S2) mount and resultant, sectional and transverse forces measured by the sensors. (B) Raw signals from the force sensors during a section from a diamond shaped resin block. (C) Representative sectional (FS) and transverse (FT) forces for sections cut at 35 and 50 nm. (D) Sectional forces from a 15 min long sectioning session. Inset shows a magnified portion of the time series. (E) A diagram of the measurement of mean sectional and transverse forces and the standard deviation of the force during the cut. (F) A representative example of a cut with high frequency chatter.
FIGURE 5
FIGURE 5
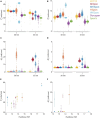
Force measurements from different resins. (A) Mean sectional force from different resins (color-coded) cut at 35 or 50 nm. (B) Mean transverse force from different resins (color-coded) cut at 35 or 50 nm nominal section thickness. (C,D) Standard deviation of sectional and transverse forces at 35 or 50 nm nominal section thickness. (E) Mean resultant forces plotted versus block hardness for 50 nm (filled circles) and 35 nm (open squares) sections. Asterisk indicates the forces for EMbed 812 VH resin were from ∼100 nm sections due to missed cuts. (F) Mean of the standard deviation of sectional force plotted versus block hardness for 50 nm (filled circles) and 35 nm (open squares) sections.
FIGURE 6
FIGURE 6
Compression of different resins. (A) A block of LX 112 resin (left) and representative 50 nm section (right). Lines indicate method used to measure compression along cutting direction. (B) A block of EMbed 812 MH resin (left) and representative 50 nm section (right). (C) Percentage of section compression relative to the length of block faces plotted versus hardness for different resins (color-coded, 50 nm sections). Asterisk indicates the compression percentages for EMbed 812 VH resin were from ∼100 nm sections due to missed cuts. (D) Decompression of a 50 nm LX 112 section on the water surface at different time points. Rectangular box is equally sized in the three images. (E) Percentage of section compression plotted versus mean resultant force (color-coded). Open circles represent compression of 35 nm LX 112 sections, closed circles are 50 nm sections. Asterisk indicates the compression percentages and forces for EMbed 812 VH resin were from ∼100 nm sections due to missed cuts. (F) Percentage of section compression plotted versus cutting speed (color-coded, 50 nm sections).
FIGURE 7
FIGURE 7
Effect of cutting parameters on cutting repeatability and uniformity. (A,B) Mean sectional and transverse forces from different resins (color-coded) cut at 50 nm and 6 degree clearance angle plotted versus cutting speed. (C,D) Standard deviation of sectional and transverse forces from different resins (color-coded) cut at 50 nm and 6 degree clearance angle plotted versus cutting speed. (E,F) Mean sectional and transverse forces from different resins (color-coded) cut at 35 nm and 1.2 mm/s plotted versus knife clearance angle. (G,H) Standard deviation of sectional and transverse forces from different resins (color-coded) cut at 35 nm and 1.2 mm/s plotted versus knife clearance angle. Note that reported clearance angles do not include the built-in 4 degree clearance angle of the knives we used.
FIGURE 8
FIGURE 8
Hardness of embedded tissue samples. (A) Blockface image of a ROTO stained brain embedded in EMbed 812 MH resin (left) and a 50 nm section (right). White arrows indicate distortion of the section. (B) Mean sectional (blue) and transverse (red) forces for 50 nm sections from the block in panel A. (C) Blockface image of a ROTO + UA + Pb stained brain surrounded first with 12% gelatin and then embedded in EMbed 812 medium hard resin (left) and a 50 nm section (right). White arrow indicates distortion of the portion of the section not containing gelatin. (D) Mean sectional (blue) and transverse (red) forces for 50 nm sections from the block in panel C. (E) Blockface image of a ROTO + UA + Pb stained brain surrounded first with 12% gelatin stained with ROTO and then embedded in EMbed 812 medium hard resin (left) and a 50 nm section (right). (F) Mean sectional (blue) and transverse (red) forces for 50 nm sections from the block in panel E.

Similar articles

Cited by

References

    1. Acetarin J.-D., Carlemalm E., Kellenberger E., Villiger W. (1987). Correlation of some mechanical properties of embedding resins with their behaviour in microtomy. J. Electron Microsc. Tech. 6 63–79. 10.1002/jemt.1060060109 - DOI
    1. Alexander S.-C., Michał J., Daniel R. B., Art P., Yuelong W., Tim B., et al. (2021). A connectomic study of a petascale fragment of human cerebral cortex. bioRxiv [Preprint] 10.1101/2021.05.29.446289 - DOI
    1. Briggman K. L., Bock D. D. (2012). Volume electron microscopy for neuronal circuit reconstruction. Curr. Opin. Neurobiol. 22 154–161. 10.1016/j.conb.2011.10.022 - DOI - PubMed
    1. Calì C., Wawrzyniak M., Becker C., Maco B., Cantoni M., Jorstad A., et al. (2018). The effects of aging on neuropil structure in mouse somatosensory cortex-A 3D electron microscopy analysis of layer 1. PLoS One 13:e0198131. 10.1371/journal.pone.0198131 - DOI - PMC - PubMed
    1. Dellmann H. D., Pearson C. B. (1977). Better epoxy resin embedding for electron microscopy at low relative humidity. Stain Technol. 52 5–8. 10.3109/10520297709116736 - DOI - PubMed

LinkOut - more resources