

Association of CSF biomarkers with MRI brain changes in Alzheimer's disease
- PMID: 38406609
- PMCID: PMC10884990
- DOI: 10.1002/dad2.12556
Association of CSF biomarkers with MRI brain changes in Alzheimer's disease
Abstract
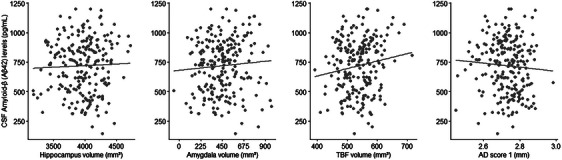
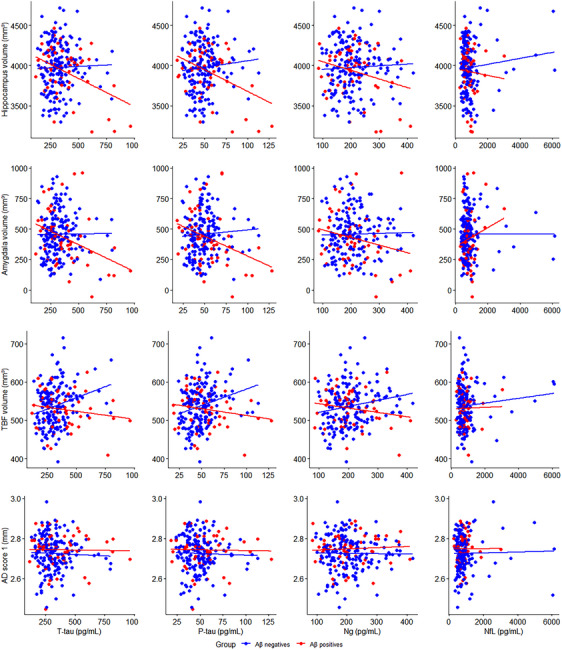
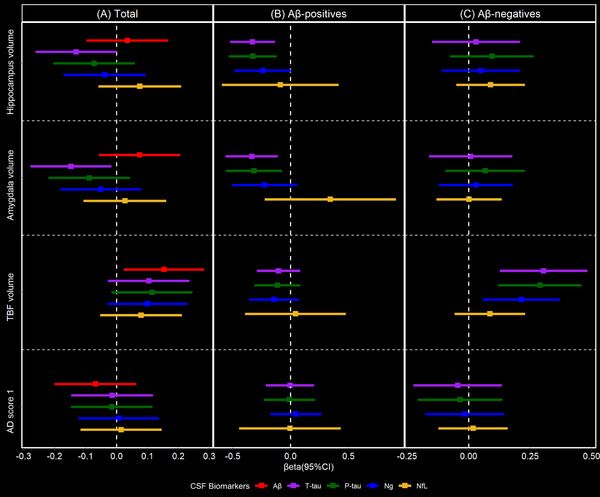
The relation between cerebrospinal fluid (CSF) biomarkers of Alzheimer's disease (AD) and magnetic resonance imaging (MRI) measures is poorly understood in cognitively healthy individuals from the general population. Participants' (n = 226) mean age was 70.9 years (SD = 0.4). CSF concentrations of amyloid beta (Aβ)1-42, total tau (t-tau), phosphorylated tau (p-tau), neurogranin, and neurofilament light, and volumes of hippocampus, amygdala, total basal forebrain (TBF), and cortical thickness were measured. Linear associations between CSF biomarkers and MRI measures were investigated. In Aβ1-42 positives, higher t-tau and p-tau were associated with smaller hippocampus (P = 0.001 and P = 0.003) and amygdala (P = 0.005 and P = 0.01). In Aβ1-42 negatives, higher t-tau, p-tau, and neurogranin were associated with larger TBF volume (P = 0.001, P = 0.001, and P = 0.01). No associations were observed between the CSF biomarkers and an AD signature score of cortical thickness. AD-specific biomarkers in cognitively healthy 70-year-olds may be related to TBF, hippocampus, and amygdala. Lack of association with cortical thickness might be due to early stage of disease.
Keywords: Alzheimer's disease; amygdala; amyloid beta 1‐42; cerebrospinal fluid biomarkers; cognitively healthy; cortical Alzheimer's disease signature score; hippocampus; magnetic resonance imaging measures; neurofilament light protein; neurogranin; phosphorylated tau; total basal forebrain; total tau.
© 2024 The Authors.Alzheimer's & Dementia: Diagnosis, Assessment & Disease Monitoring published by Wiley Periodicals LLC on behalf of Alzheimer's Association.
Conflict of interest statement
KB has served as a consultant, on advisory boards, or data monitoring committees for Abcam, Axon, BioArctic, Biogen, JOMDD/Shimadzu, Julius Clinical, Lilly, MagQu, Novartis, Ono Pharma, Roche Diagnostics, and Siemens Healthineers, and is a co‐founder of Brain Biomarker Solutions in Gothenburg AB (BBS), which is a part of the GU Ventures Incubator Program. HZ has served on scientific advisory boards and/or as a consultant for Abbvie, Acumen, Alector, ALZPath, Annexon, Apellis, Artery Therapeutics, AZTherapies, CogRx, Denali, Eisai, Nervgen, Novo Nordisk, Passage Bio, Pinteon Therapeutics, Red Abbey Labs, reMYND, Roche, Samumed, Siemens Healthineers, Triplet Therapeutics, and Wave; has given lectures in symposia sponsored by Cellectricon, Fujirebio, Alzecure, Biogen, and Roche; and is a co‐founder of Brain Biomarker Solutions in Gothenburg AB (BBS), which is a part of the GU Ventures Incubator Program (outside submitted work). SK has served on scientific advisory boards and/or as a consultant for Geras Solutions, Optoceutics, and Biogen, unrelated to the present study. The authors declare no conflicts of interest. Author disclosures are available in the supporting information.
Figures
Similar articles
-
Comparison of CSF neurofilament light chain, neurogranin, and tau to MRI markers.Alzheimers Dement. 2021 May;17(5):801-812. doi: 10.1002/alz.12239. Epub 2021 Mar 4. Alzheimers Dement. 2021. PMID: 33663022 Free PMC article.
-
Brain alterations in the early Alzheimer's continuum with amyloid-β, tau, glial and neurodegeneration CSF markers.Brain Commun. 2022 May 24;4(3):fcac134. doi: 10.1093/braincomms/fcac134. eCollection 2022. Brain Commun. 2022. PMID: 35702732 Free PMC article.
-
Associations of Neurodegeneration Biomarkers in Cerebrospinal Fluid with Markers of Alzheimer's Disease and Vascular Pathology.J Alzheimers Dis. 2023;92(3):887-898. doi: 10.3233/JAD-221015. J Alzheimers Dis. 2023. PMID: 36806507 Free PMC article.
-
A Review of Fluid Biomarkers for Alzheimer's Disease: Moving from CSF to Blood.Neurol Ther. 2017 Jul;6(Suppl 1):15-24. doi: 10.1007/s40120-017-0073-9. Epub 2017 Jul 21. Neurol Ther. 2017. PMID: 28733960 Free PMC article. Review.
-
Core candidate neurochemical and imaging biomarkers of Alzheimer's disease.Alzheimers Dement. 2008 Jan;4(1):38-48. doi: 10.1016/j.jalz.2007.08.006. Epub 2007 Dec 21. Alzheimers Dement. 2008. PMID: 18631949 Review.
Cited by
-
"Proteinjury": a universal pathological mechanism mediated by cerebrospinal fluid in neurodegeneration and trauma.Front Cell Dev Biol. 2025 May 20;13:1593122. doi: 10.3389/fcell.2025.1593122. eCollection 2025. Front Cell Dev Biol. 2025. PMID: 40463840 Free PMC article. Review.
-
Hippocampal Subfields Volume: Another Hint of the Continuum Between CAA and AD?Eur J Neurol. 2025 Jul;32(7):e70284. doi: 10.1111/ene.70284. Eur J Neurol. 2025. PMID: 40626372 Free PMC article.
-
Brain MRI signatures across sex and CSF Alzheimer's disease biomarkers.Brain Commun. 2025 May 30;7(3):fcaf210. doi: 10.1093/braincomms/fcaf210. eCollection 2025. Brain Commun. 2025. PMID: 40503330 Free PMC article.
References
-
- Alzheimer's Association . 2015 Alzheimer's disease facts and figures. Alzheimers Dement. 2015;11(3):332‐384. - PubMed
-
- Blennow K, Zetterberg H. Biomarkers for Alzheimer's disease: current status and prospects for the future. J Intern Med. 2018;284(6):643‐663. - PubMed
-
- Hardy J, Selkoe DJ. The amyloid hypothesis of Alzheimer's disease: progress and problems on the road to therapeutics. Science. 2002;297(5580):353‐356. - PubMed
Grants and funding
LinkOut - more resources
Full Text Sources