. 2025 Mar 1;81(3):888-902.
doi: 10.1097/HEP.0000000000000773. Epub 2024 Feb 26.

Endothelial YAP/TEAD1-CXCL17 signaling recruits myeloid-derived suppressor cells against liver ischemia-reperfusion injury

Affiliations

Endothelial YAP/TEAD1-CXCL17 signaling recruits myeloid-derived suppressor cells against liver ischemia-reperfusion injury

Sitong Zhang et al. Hepatology. .

Abstract

Background and aims: Liver ischemia-reperfusion injury (IRI) is a common complication of liver transplantation and hepatectomy and causes acute liver dysfunction and even organ failure. Myeloid-derived suppressor cells (MDSCs) accumulate and play immunosuppressive function in cancers and inflammation. However, the role of MDSCs in liver IRI has not been defined.

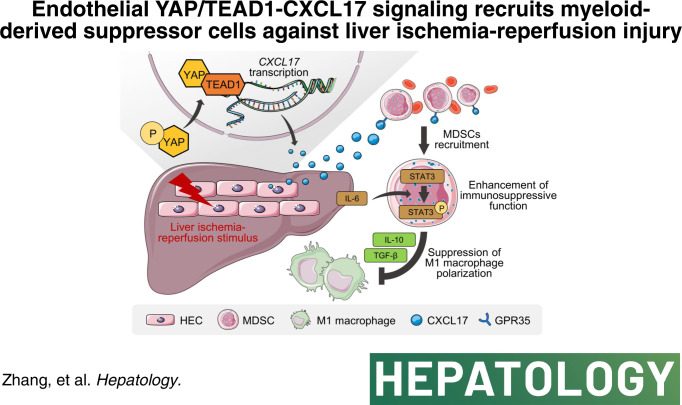
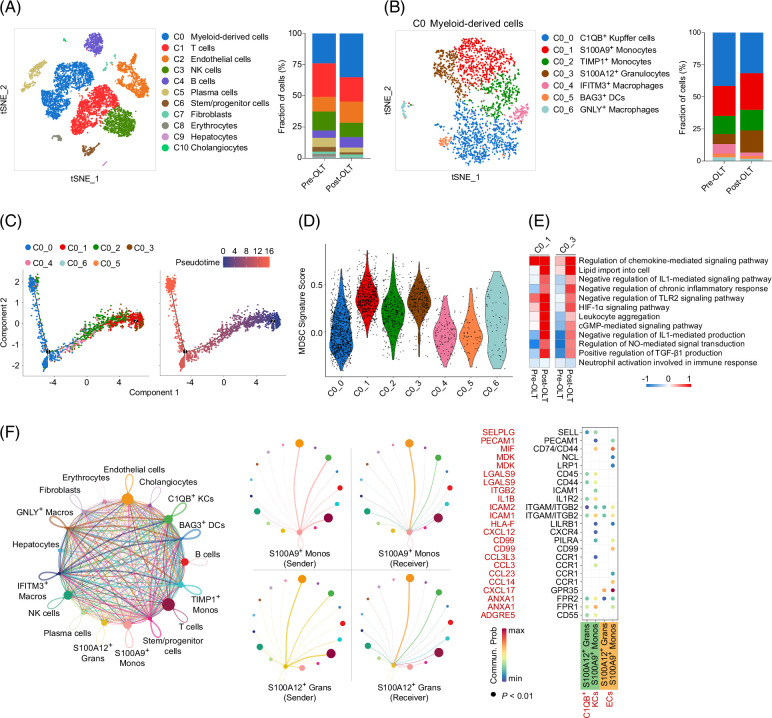
Approach and results: We enrolled recipients receiving OLT and obtained the pre-OLT/post-OLT blood and liver samples. The proportions of MDSCs were significantly elevated after OLT and negatively associated with liver damage. In single-cell RNA-sequencing analysis of liver samples during OLT, 2 cell clusters with MDSC-like phenotypes were identified and showed maturation and infiltration in post-OLT livers. In the mouse model, liver IRI mobilized MDSCs and promoted their infiltration in the damaged liver, and intrahepatic MDSCs were possessed with enhanced immunosuppressive function by upregulation of STAT3 signaling. Under treatment with αGr-1 antibody or adoptive transfer MDSCs to change the proportion of MDSCs in vivo, we found that intrahepatic MDSCs alleviated liver IRI-induced inflammation and damage by inhibiting M1 macrophage polarization. Mechanistically, bulk RNA-sequencing analysis and in vivo experiments verified that C-X-C motif chemokine ligand 17 (CXCL17) was upregulated by YAP/TEAD1 signaling and subsequently recruited MDSCs through binding with GPR35 during liver IRI. Moreover, hepatic endothelial cells were the major cells responsible for CXCL17 expression in injured livers, among which hypoxia-reoxygenation stimulation activated the YAP/TEAD1 complex to promote CXCL17 transcription.

Conclusions: Endothelial YAP/TEAD1-CXCL17 signaling recruited MDSCs to attenuate liver IRI, providing evidence of therapeutic potential for managing IRI in liver surgery.


Conflict of interest statement

The authors have no conflicts to report.

Figures

None
Graphical abstract
FIGURE 1
FIGURE 1
Correlation of circulating MDSCs and liver IRI in recipients of OLT. (A) Statistical analysis of percentages of MDSCs, M-MDSCs, and PMN-MDSCs in pre-OLT or post-OLT blood of recipients (n=30 per group). (B) Representative immunofluorescent staining of CD11b (in green), CD33 (in red), and DAPI (in blue for nucleus) in sections of pre-OLT or post-OLT liver samples (×200). Quantification of CD11b+CD33+ cell counts in each HPF. The scale bar is 50 μm. (C) Variation curves of serum ALT/AST in recipients of OLT from low and high MDSC level groups (n=15 per group). (D) Negative correlation between the levels of serum ALT/AST and the percentages of circulating MDSCs in recipients at day 1 after OLT (n=30). Data are shown as mean±SD. Student t test or linear regression analysis, *p<0.05, **p<0.01, ***p<0.001, ns, no significance. Abbreviations: HPF, high power field; IRI, ischemia-reperfusion injury; MDSC, myeloid-derived suppressor cell; M-MDSC, monocytic MDSC; PMN-MDSC, polymorphonuclear MDSC.
FIGURE 2
FIGURE 2
The scRNA-seq analysis of intrahepatic MDSCs phenotypes in OLT. (A) tSNE plot displaying all cells (9066) in 11 clusters with different colors. The proportion of these clusters in pre-OLT/post-OLT groups is shown. (B) tSNE plot displaying 7 subclusters of myeloid-derived cell cluster (2547) in OLT. The proportion of these subclusters in pre-OLT/post-OLT groups is shown. (C) Pseudotime analysis of 7 myeloid-derived cell subclusters using monocle. The lines indicating the trajectories of clusters (left) and the colors indicating changes in the pseudotime (right) are shown. (D) Violin plots showing MDSC signature scores of 7 myeloid-derived cell subclusters. (E) Heat map of GSVA showing the GO pathways with remarkably different activation between pre-OLT and post-OLT samples of C0_1 or C0_3 clusters. Colors represent activation scores. (F) Interaction networks of all cell types from post-OLT liver samples. Dot plot of significant ligand-receptor interactions between endothelial cells/C1QB+ Kupffer cells (as senders) and S100A9+ monocytes/S100A12+ granulocytes (as receivers) is shown. Colored by cell communication probability, the dot size indicates p value generated by the empirical permutation test. Abbreviations: GO, gene ontology; GSVA, gene set variation analysis; MDSC, myeloid-derived suppressor cell; tSNE, t-distributed stochastic neighbor embedding.
FIGURE 3
FIGURE 3
CD11b+Gr-1+ MDSCs were infiltrated into IRI livers with enhanced immune-suppressive characteristics. (A) Statistical analysis of proportions of MDSCs (defined as CD11b+Gr-1+ cells) and PMN-MDSCs (defined as CD11b+Ly6G+Ly6Clow cells) in mouse livers during liver IRI. (B) Representative immunofluorescent staining of CD11b (in green), Gr-1 (in red), and DAPI (in blue for nucleus) in liver sections of sham or IRI-12h modeling mouse (×200). Quantification of CD11b+Gr-1+ cell counts in each HPF. The scale bar is 50 μm. (C) Flow cytometry assessment of the proliferation of CFSE-labeled T cells stimulated by αCD3/28 and cocultured with intrahepatic MDSCs sorted from the sham or liver IRI group. (D) GSEA plots displaying some specific signaling pathways highly enriched in intrahepatic MDSCs from the liver IRI group. (E) Heat map showing the difference in the expression of specific genes between intrahepatic MDSCs from the sham and liver IRI groups. (F) Overlaid histogram plots and statistical analysis of p-STAT3(Tyr705), IL-10, TGF-β, and ARG1 expression in intrahepatic MDSCs from sham or liver IRI–mediating mice with the treatment of STAT3 inhibitor static. Data are shown as mean±SD. n=4 per group. ANOVA test or Student t test, **p<0.01, ***p<0.001. Abbreviations: ARG1, arginase 1; CFSE, carboxyfluorescein succinimidyl ester; GSEA, gene set enrichment analysis; IRI, ischemia-reperfusion injury; MDSC, myeloid-derived suppressor cell; MFI, mean fluorescence intensity; PMN-MDSC, polymorphonuclear MDSC.
FIGURE 4
FIGURE 4
Intrahepatic MDSCs dampened IRI-induced damage through suppressing M1 macrophage polarization. Mice were treated with αGr-1 antibody, exogenous MDSCs transfer, or isotype IgG control at the onset of reperfusion. After 12 hours, mice were killed and samples were collected for analysis. (A) Representative images of H&E staining for liver sections from sham or liver IRI–mediating mice with depletion or adoptive transfer of MDSCs (×100; ×200). The scale bar is 100 or 50 μm, respectively. (B) Quantification of serum ALT and AST in mice under different treatments. (C) Intrahepatic levels of proinflammatory cytokines IL-1β, IL-6, and TNF-α in mice under different treatments. (D) Flow cytometry analysis and quantification of the proportions as well as CD86 (M1 polarization marker) expression of macrophages under conditions of depletion or adoptive transfer of MDSCs. (E, F) Primary peritoneal macrophages were polarized by HMGB1 (1 μg/mL) and cocultured with sorted MDSCs (cell ratio 1:3) in vitro for 24 hours, along with the treatment of anti-IL-10 or anti-TGF-β neutralizing antibody (10 μg/mL), ARG1 inhibitor l-Norvaline (20 mM) or STAT3 inhibitor Stattic (5 μM). Expression levels of CD86 and proinflammatory cytokine genes (Il6, Tnf, and Il1b) in macrophages were tested. Data are shown as mean±SD. n=4 per group. ANOVA test, *p<0.05, **p<0.01, ***p<0.001, ns, no significance. Abbreviations: IgG, immunoglobulin G; IRI, ischemia-reperfusion injury; MDSC, myeloid-derived suppressor cell.
FIGURE 5
FIGURE 5
CXCL17-GPR35 chemotaxis mediated the intrahepatic infiltration of MDSCs in liver IRI. (A) qPCR analysis showing the relative expression of 12 MDSC-related chemokines in livers from sham or liver IRI mice. (B) ELISA assays of CXCL17 levels in liver samples from sham, liver IRI, pre-OLT, or post-OLT groups. (C) Representative immunofluorescent staining of CD11b (in green), Gr-1 (in red), GRP35 (in pink), and DAPI (in blue for nucleus) in immune cells isolated from livers of sham or IRI-12h modeling mouse (×630). The scale bar is 5 μm. (D) DiR-labeled MDSCs were injected i.v. into sham or liver IRI–mediating mice with or without the treatment of CID 2745687, and imaged in vivo 12 hours later. (E) Statistical analysis of proportions of PMN-MDSCs and M-MDSCs in livers from sham or liver IRI–mediating mice with the addition of CID 2745687. (F) Serum ALT/AST values in sham or liver IRI–mediating mice with the addition of CID 2745687. Data are shown as mean±SD. n=4 per group. ANOVA test or Student t test, *p<0.05, **p<0.01, ***p<0.001. Abbreviations: CXCL17, C-X-C motif chemokine ligand 17; DiR, 1,1-dioctadecyl-3,3,3,3-tetramethylindotricarbocyanine iodide; GPR35, G protein–coupled receptor 35; IRI, ischemia-reperfusion injury; MDSC, myeloid-derived suppressor cell; M-MDSC, monocytic MDSC; PMN-MDSC, polymorphonuclear MDSC; qPCR, real-time quantitative polymerase chain reaction.
FIGURE 6
FIGURE 6
Activated YAP/TEAD1 signaling promoted CXCL17 expression and MDSCs infiltration against liver IRI. (A) Network analysis of the top genes from liver IRI–related gene cluster (marked as the blue module in WGCNA) (left). Venn diagram containing the sets of upregulated DEGs, detected TFs, and predicted TFs related to Cxcl17 (right). (B) Representative immunohistochemistry staining for YAP expression in liver tissues from pre-OLT, post-OLT, sham, or liver IRI groups (×40; ×100). The scale bar is 200 or 100 μm, respectively. (C) Western blot assay showing expressions of YAP, p-YAP (Ser127), TEAD1, TAZ, CXCL17, and β-actin (as control) in liver tissues from pre-OLT, post-OLT, sham, and liver IRI groups. (D) Western blot assay showing the expression of CXCL17 in sham or liver IRI-12h mice with pretreatment of VP or LPA. (E) Flow cytometry assay showing intrahepatic proportions of PMN-MDSCs/M-MDSCs and (F) serum ALT/AST tests in sham or liver IRI-12h mice with pretreatment of VP, LPA, or CID 2745687. Data are shown as mean±SD. n=4 per group. ANOVA test, *p<0.05, **p<0.01, ***p<0.001. Abbreviations: CXCL17, C-X-C motif chemokine ligand 17; DEG, differentially expressed gene; IRI, ischemia-reperfusion injury; LPA, lysophosphatidic acid; MDSC, myeloid-derived suppressor cell; M-MDSC, monocytic MDSC; PMN-MDSC, polymorphonuclear MDSC; TF, transcription factor; VP, verteporfin; WGCNA, weighted gene coexpression network analysis.
FIGURE 7
FIGURE 7
Activated YAP/TEAD1 signaling pathway promoted CXCL17 transcription in endothelial cells under H/R stimulus. (A) Relative expression of Cxcl17 mRNA in hepatocytes, HECs, Kupffer cells, and other NPCs isolated from sham or liver IRI-12h mice. (B) Representative immunofluorescent staining of YAP (in green), CD31 (in red), and DAPI (in blue) in liver sections of sham or IRI-12h modeling mouse (×200). The scale bar is 50 μm. (C) qPCR assay showing the expression of CXCL17 mRNA under H/R (6 h/12 h) condition with the treatment of YAP or TEAD1 siRNA. (D) Western blot assay showing the expression of YAP, p-YAP (Ser127), TEAD1, TAZ, CXCL17, and β-actin (as control) in SK-HEP1 or HECs under H/R (6 h/12 h) condition with the treatment of YAP or TEAD1 siRNA. (E) ChIP-PCR analysis was applied to test the binding of YAP to the CXCL17 promoter in SK-HEP1. CTGF promoter was tested as a positive control. (F) Luciferase assay showing the CXCL17 transcriptional activities in SK-HEP1 with YAP/TEAD1 knockdown or deletion mutation of the YAP/TEAD1 binding site. Data are shown as mean±SD. n=4 per group. ANOVA test or Student t test, **p<0.01, ***p<0.001, ns, no significance. Abbreviations: ChIP, chromatin immunoprecipitation; CXCL17, C-X-C motif chemokine ligand 17; HEC, hepatic endothelial cell; H/R, hypoxia-reoxygenation; NPC, nonparenchymal cell; IRI, ischemia-reperfusion injury; qPCR, real-time quantitative polymerase chain reaction.

References

    1. Zhai Y, Petrowsky H, Hong JC, Busuttil RW, Kupiec-Weglinski JW. Ischaemia-reperfusion injury in liver transplantation—From bench to bedside. Nat Rev Gastroenterol Hepatol. 2013;10:79–89. - PMC - PubMed
    1. Dar WA, Sullivan E, Bynon JS, Eltzschig H, Ju C. Ischaemia reperfusion injury in liver transplantation: Cellular and molecular mechanisms. Liver Int. 2019;39:788–801. - PMC - PubMed
    1. Zhai Y, Busuttil RW, Kupiec-Weglinski JW. Liver ischemia and reperfusion injury: New insights into mechanisms of innate-adaptive immune-mediated tissue inflammation. Am J Transplant. 2011;11:1563–1569. - PMC - PubMed
    1. Gan X, Zhang R, Gu J, Ju Z, Wu X, Wang Q, et al. . Acidic microenvironment regulates the severity of hepatic ischemia/reperfusion injury by modulating the generation and function of Tregs via the PI3K-mTOR pathway. Front Immunol. 2020;10:2945. - PMC - PubMed
    1. Liu Y, Ji H, Zhang Y, Shen X, Gao F, He X, et al. . Recipient T cell TIM-3 and hepatocyte galectin-9 signalling protects mouse liver transplants against ischemia-reperfusion injury. J Hepatol. 2015;62:563–572. - PMC - PubMed

MeSH terms