. 2024 Apr 24;52(7):e38.
doi: 10.1093/nar/gkae127.

Low-input and single-cell methods for Infinium DNA methylation BeadChips

Affiliations

Low-input and single-cell methods for Infinium DNA methylation BeadChips

Sol Moe Lee et al. Nucleic Acids Res. .

Abstract

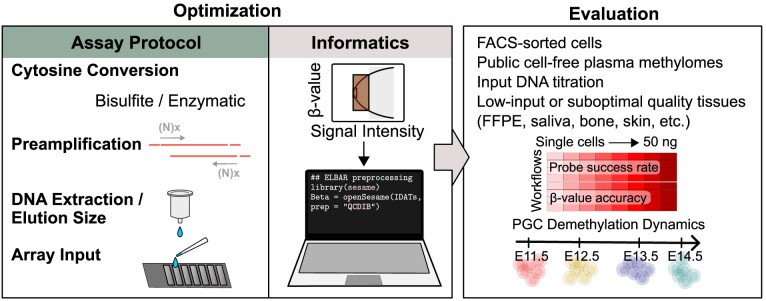
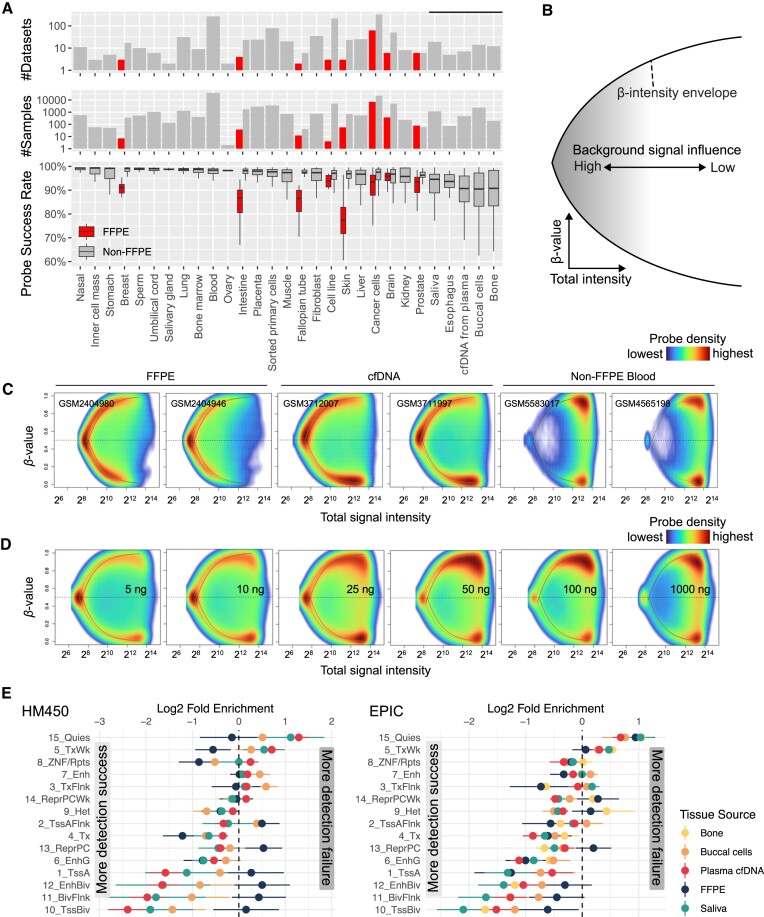
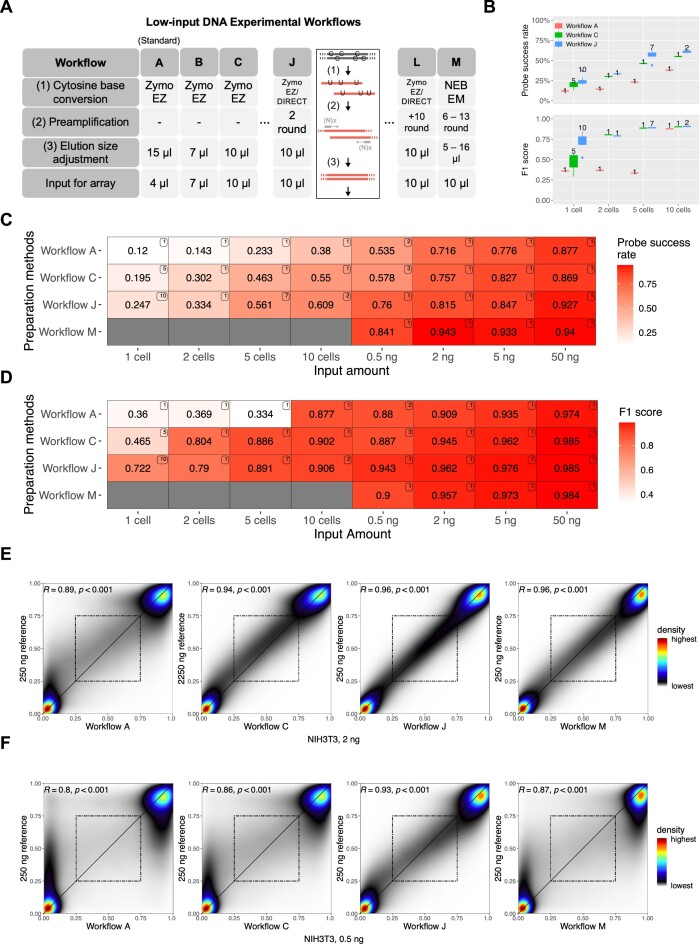
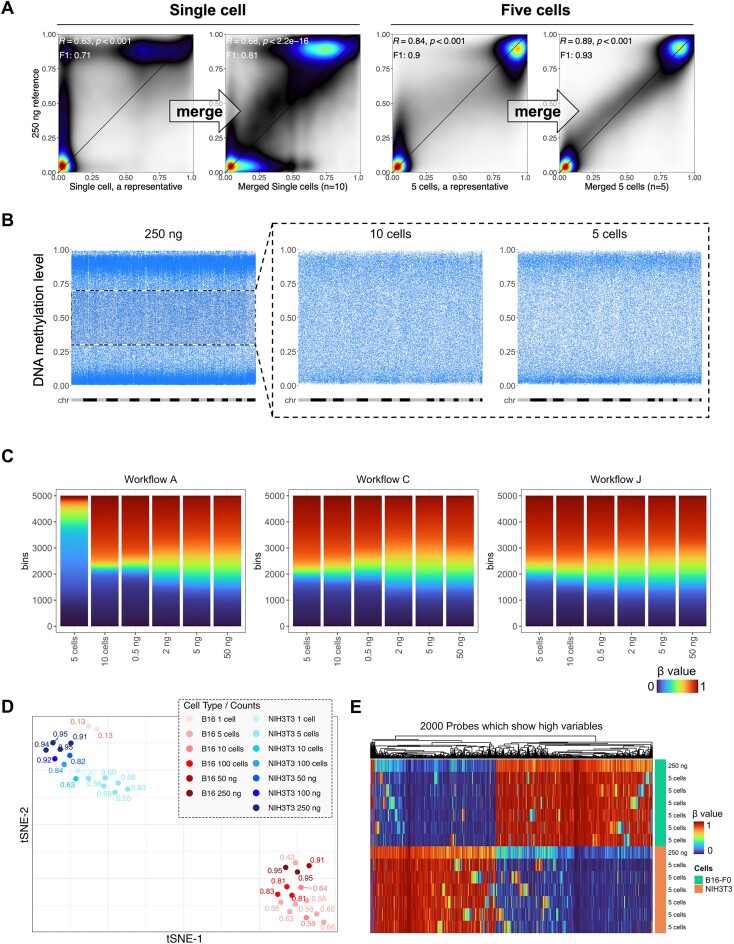
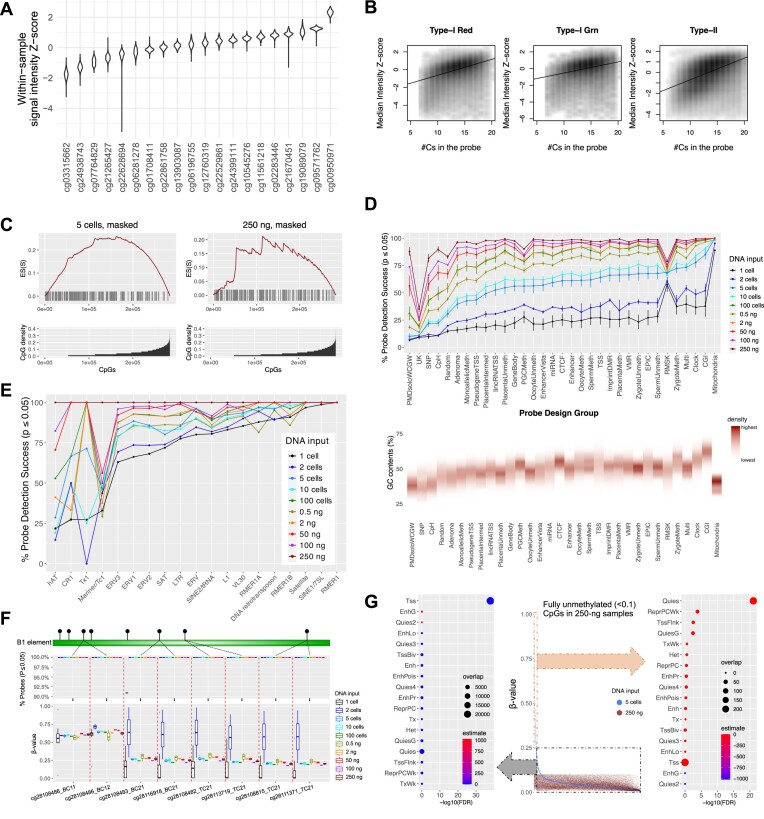
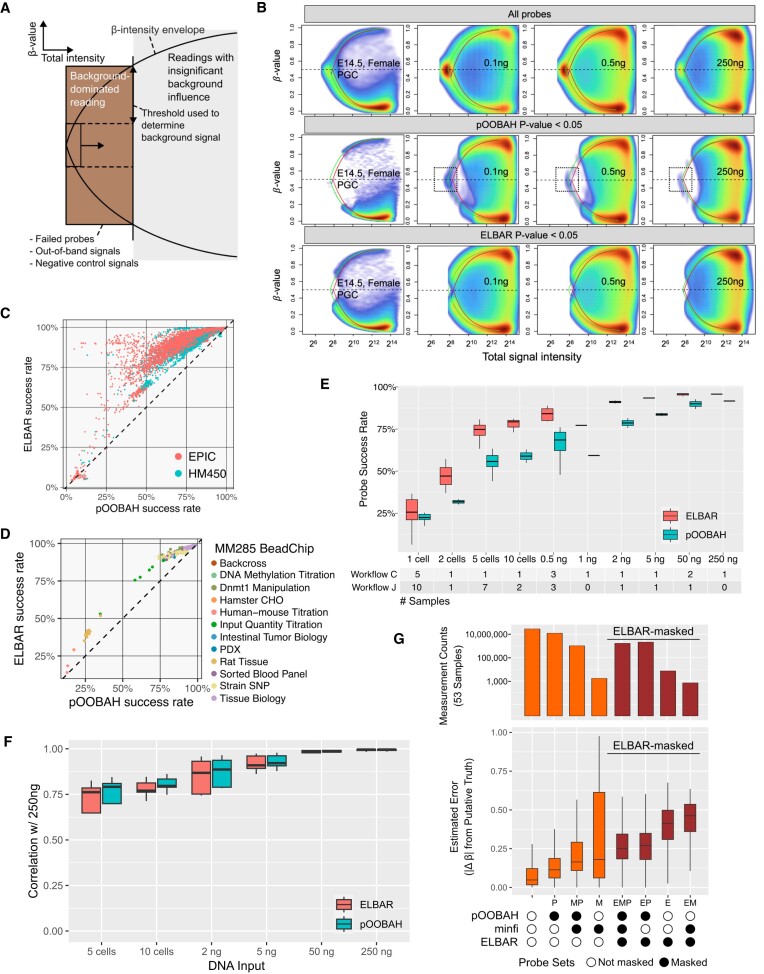
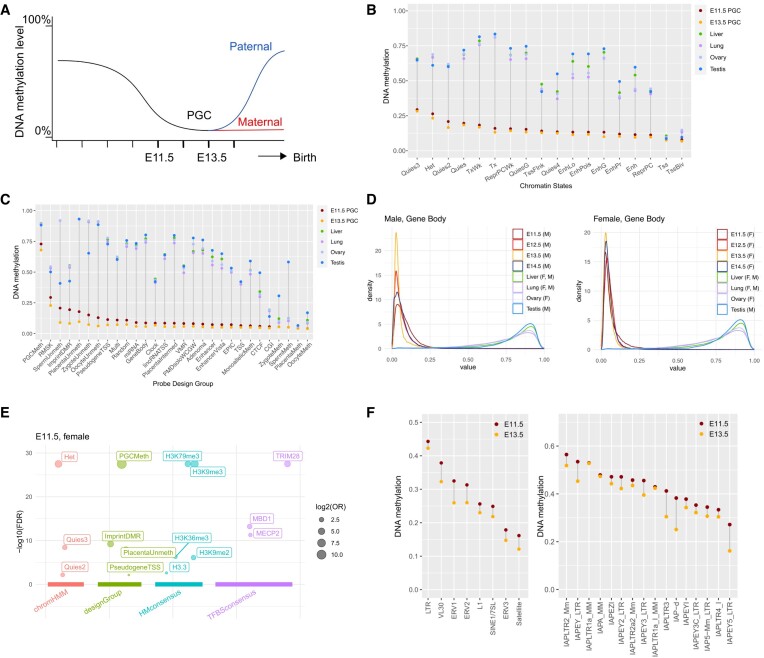
The Infinium BeadChip is the most widely used DNA methylome assay technology for population-scale epigenome profiling. However, the standard workflow requires over 200 ng of input DNA, hindering its application to small cell-number samples, such as primordial germ cells. We developed experimental and analysis workflows to extend this technology to suboptimal input DNA conditions, including ultra-low input down to single cells. DNA preamplification significantly enhanced detection rates to over 50% in five-cell samples and ∼25% in single cells. Enzymatic conversion also substantially improved data quality. Computationally, we developed a method to model the background signal's influence on the DNA methylation level readings. The modified detection P-value calculation achieved higher sensitivities for low-input datasets and was validated in over 100 000 public diverse methylome profiles. We employed the optimized workflow to query the demethylation dynamics in mouse primordial germ cells available at low cell numbers. Our data revealed nuanced chromatin states, sex disparities, and the role of DNA methylation in transposable element regulation during germ cell development. Collectively, we present comprehensive experimental and computational solutions to extend this widely used methylation assay technology to applications with limited DNA.


Figures

Graphical Abstract
Graphical Abstract
Figure 1.
Figure 1.
Lower input arrays exhibit lower signal intensity and lower probe success rates. (A) The probe success rate in 105475 public Infinium methylation BeadChip array data sets. (B) Schematic showing the dependence of beta value on the probe's total signal intensity. The x-axis represents the total signal intensity, and the y-axis represents beta values. (C) The intensity-beta plot compares different DNA sources and (D) input amounts in ng. The green and red curves denote the beta value envelopes defined by the green and the red channel background signal, respectively. (E) The probe detection rate of FFPE and cfDNA samples at different genomic regions from HM450 (left) array data and (right) EPIC array data.
Figure 2.
Figure 2.
Infinium BeadChip performance in ultra-low input ranges. (A) A summary table of workflows used in this study. Workflow A is the Illumina standard workflow. (B) Box plots were used to visualize the probe success rates (top) and the F1 score (bottom). The number of samples for each experiment was displayed next to each box. (C, D) Comparison of four main preparation methods based on (C) probe success rate and (D) F1 score. The number on the top right corner of each tile indicates the number of samples analyzed in each experiment. See also Supplementary Figure S2. (E, F) Smooth scatterplots for the comparison of workflows A, C, J, and M with (E) 2 ng and (F) 0.5 ng of DNA input (R: spearman's rho, P: P-value). The dashed squares indicate intermediate beta values (0.25–0.75) on both axes.
Figure 3.
Figure 3.
Low input methylation array data uncovered sample-to-sample heterogeneity. (A) Smooth scatter plots for methylomes from a representative single-cell dataset, the merged single-cell dataset (N = 10), a representative 5-cell dataset, and the merged five-cell dataset (N = 5), respectively, against the 250-ng input. (B) Distribution of intermediate methylation (0.3–0.7, dashed black square) of CpGs in the 250-ng methylome in 10- and 5-cell datasets. Each blue dot represents a CpG, and the X-axes were arranged in the order from chromosome 1 to chromosome Y, with each chromosome displayed in alternating gray and black colors. (C) DNA methylation level distribution of 5 cells to 50 ng with different workflows. (D) tSNE cluster of NIH3T3 and B16 using 2000 probes most variable in the methylation level. Fractions labeled in the plot are probe success rates for each dataset. All B16-F0, NIH3T3, and PGCs except 50, 100 and 250 ng were whole genomes amplified by Workflow I or J. (E) Heatmap showing array performance comparison of 5-cell methylomes of B16-F0 and NIH3T3 with 250-ng methylomes. 2000 highly variable CpGs with the highest standard deviations of DNA methylation value among samples were used.
Figure 4.
Figure 4.
Low-input Infinium array preferentially loses detection on GC-sparse genome but retains detection on mitochondria and TEs. (A) Violin plot for intensity Z-score of representative HM450 autosomal probes across 749 normal samples from the TCGA cohort. (B) Correlation of signal intensities with the number of Cs in the probe sequence. (C) CpG density enrichment analysis for NIH3T3 5-cell and 250-ng datasets. (Bottom) The x-axis represents probes (N = 297 415) organized in ascending order based on their CpG density. Y-axis indicates the CpG density for each probe. (Top) The x-axis aligns with the bottom plot, and the y-axis exhibits the enrichment score (ES). Each bar in the figure depicts the location of a pOOBAH-masked probe, arranged in ascending order of CpG density within a ±75 bp range of the flanking region surrounding the CpG target for each probe. (D) The mean and standard deviation (with error bars) of the probe success rate of probe design groups (a complete description of the definition of each probe design group is listed in the legend of supplementary Figure S4) (top). Flanking GC content ratios of probes on mouse methylation array within a range of ± 50 bp, categorized by probe design groups (bottom). (E) the mean of the probe success rate of TEs for varying DNA input amounts, ranging from single-cell to 250 ng datasets. The x-axes are organized in ascending sequence according to the probe success rates for five cells in (D) and single cells in (E). (F) (top) The probe detection rates of eight CpG probes targeting B1 elements ranged from single cells to 250 ng, and (bottom) corresponding beta values cover the same range. (G) The beta value distribution of CpGs in the 5 cells of NIH3T3 with blue dots, emphasizing fully unmethylated (less than 0.1 of beta values) in the 250-ng sample, represented by red dots (center). The x-axis was organized in descending order of beta values of the 5 cells. Dot plots for enriched chromatin states (75) for CpGs within the dashed gray square with delta beta less than 0.25 between the two samples (left), and CpGs within the dashed orange square with delta beta greater than 0.25 (right). Estimate: log2 of Odds ratio; overlap: number of curated CpG probes for each term of chromatin state.
Figure 5.
Figure 5.
ELBAR detection preserves more probes with biological signals. (A) A schematic illustration of the ELBAR algorithm. The x-axis represents the total signal intensity, and the y-axis represents beta values. (B) Performance of ELBAR in eliminating background-dominated reading probes compared to pOOBAH and unfiltered in PGCs, 0.1-, 0.5- and 250-ng-input datasets. Dashed boxes illustrate the artificial, background-dominated readings left by pOOBAH masking. The green and red curves denote the beta value envelopes defined by the green and the red channel background signal, respectively. (C, D) ELBAR performance regarding the probe success rates for public human (C) and mouse (D) array datasets. (E, F) Comparison of ELBAR performance with pOOBAH regarding probe success rate (E, P-value = 2.7E-8, t-test of method difference in a multiple linear regression) and Spearman's rho (F, P-value = 0.71, t-test of method difference in a multiple linear regression) in low-input datasets with DNA input ranging from single cell to 250 ng. (G) Comparisons of three probe masking methods: (top) the total number of readings surviving detection masking from 53 FFPE samples, and (bottom) the methylation reading deviation from putative ground truths in these 53 samples.
Figure 6.
Figure 6.
Low-input Infinium array data reveals epigenetic dynamics of primordial germ cell development. (A) Expected DNA methylation dynamics during primordial germ cell developments. E11.5 and E13.5 refer to embryonic days after fertilization. (B, C) DNA demethylation patterns in PGCs and tissues stratified by ChromHMM states (B) and mouse array probe design groups (C). (D) DNA methylation distribution in gene body regions in PGCs and tissues. M: male; F: female. (E) Enriched genomic features by CpGs that retain methylation level (over 0.5) in the three female E11.5 PGCs. The size of each circle represents the log2 odds ratio (OR) of individual curated CpG sets, and the y-axis indicates the -log10 of the false discovery rate (FDR) for each curated CpG set. Arranged from left to right along the x-axis are four distinct sets of databases: chromatin states, probe design group, histone modification consensus, and transcription factor binding site consensus motif. (F) DNA demethylation patterns in TEs (left) and IAP elements (right) across PGCs and tissues.

Update of

References

    1. Greenberg M.V.C., Bourc’his D The diverse roles of DNA methylation in mammalian development and disease. Nat. Rev. Mol. Cell Biol. 2019; 20:590–607. - PubMed
    1. Bibikova M., Barnes B., Tsan C., Ho V., Klotzle B., Le J.M., Delano D., Zhang L., Schroth G.P., Gunderson K.L. et al. . High density DNA methylation array with single CpG site resolution. Genomics. 2011; 98:288–295. - PubMed
    1. Maden S.K., Thompson R.F., Hansen K.D., Nellore A. Human methylome variation across Infinium 450K data on the Gene Expression Omnibus. NAR Genom. Bioinform. 2021; 3:lqab025. - PMC - PubMed
    1. Hawe J.S., Wilson R., Schmid K.T., Zhou L., Lakshmanan L.N., Lehne B.C., Kuhnel B., Scott W.R., Wielscher M., Yew Y.W. et al. . Genetic variation influencing DNA methylation provides insights into molecular mechanisms regulating genomic function. Nat. Genet. 2022; 54:18–29. - PMC - PubMed
    1. Min J.L., Hemani G., Hannon E., Dekkers K.F., Castillo-Fernandez J., Luijk R., Carnero-Montoro E., Lawson D.J., Burrows K., Suderman M. et al. . Genomic and phenotypic insights from an atlas of genetic effects on DNA methylation. Nat. Genet. 2021; 53:1311–1321. - PMC - PubMed

Publication types