. 2024 Feb 26;108(1):236.
doi: 10.1007/s00253-024-13032-6.

Correlation study on microbial communities and volatile flavor compounds in cigar tobacco leaves of diverse origins

Affiliations

Correlation study on microbial communities and volatile flavor compounds in cigar tobacco leaves of diverse origins

Haiqing Wang et al. Appl Microbiol Biotechnol. .

Abstract

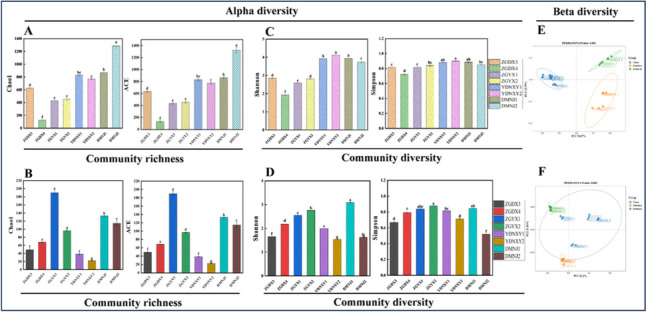
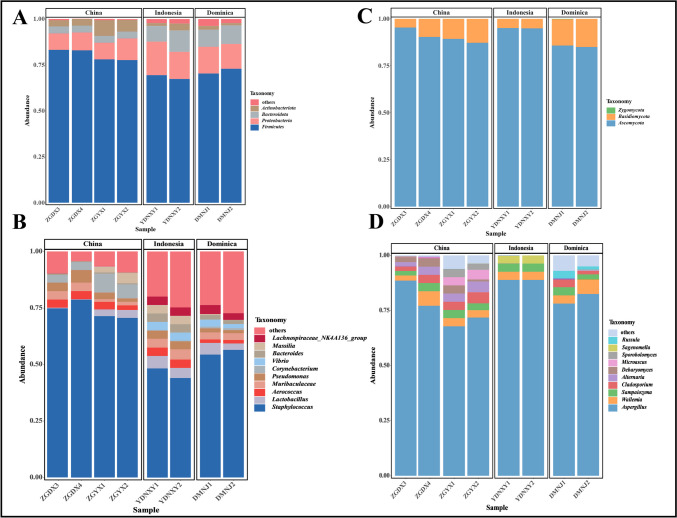
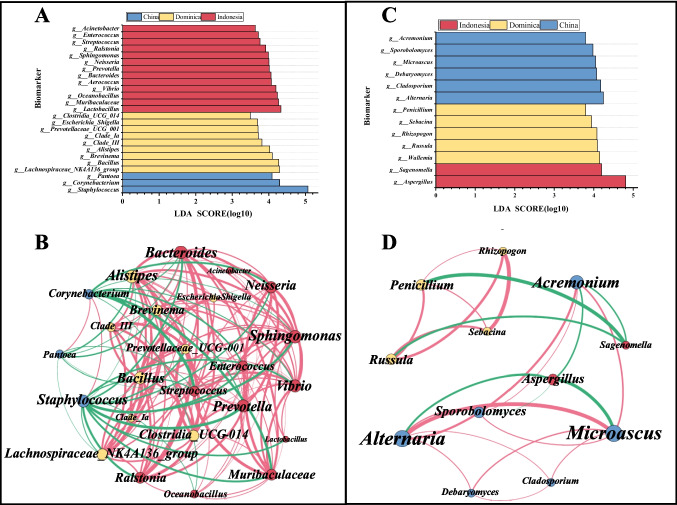
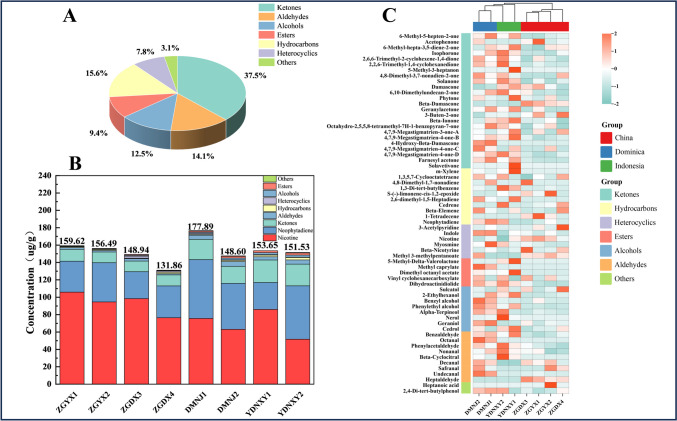
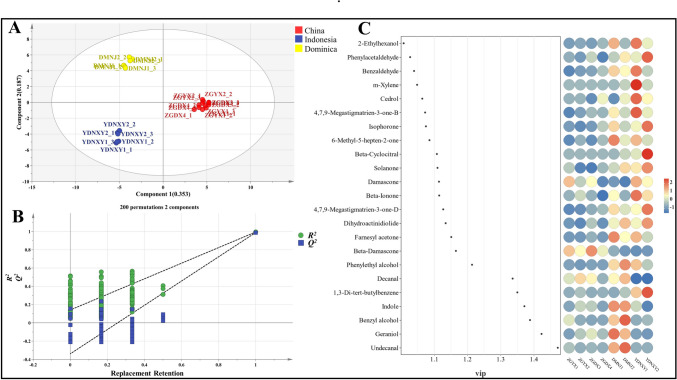
To elucidate the significant influence of microorganisms on geographically dependent flavor formation by analyzing microbial communities and volatile flavor compounds (VFCs) in cigar tobacco leaves (CTLs) obtained from China, Dominica, and Indonesia. Microbiome analysis revealed that the predominant bacteria in CTLs were Staphylococcus, Aerococcus, Pseudomonas, and Lactobacillus, while the predominant fungi were Aspergillus, Wallemia, and Sampaiozyma. The microbial communities of CTLs from different origins differed to some extent, and the diversity and abundance of bacteria were greater than fungi. Metabolomic analysis revealed that 64 VFCs were identified, mainly ketones, of which 23 VFCs could be utilized to identify the geographical origins of CTLs. Sixteen VFCs with OAV greater than 1, including cedrol, phenylacetaldehyde, damascone, beta-damascone, and beta-ionone, play important roles in shaping the flavor profile of CTLs from different origins. Combined with the correlation analysis, bacterial microorganisms were more closely related to key VFCs and favored a positive correlation. Bacillus, Vibrio, and Sphingomonas were the main flavor-related bacteria. The study demonstrated that the predominant microorganisms were essential for the formation of key flavor qualities in CTLs, which provided a theoretical reference for flavor control of CTLs by microbial technology. KEY POINTS: • It is the high OAV VFCs that determine the flavor profile of CTLs. • The methylerythritol phosphate (MEP) pathway and the carotenoid synthesis pathway are key metabolic pathways for the formation of VFCs in CTLs. • Microbial interactions influence tobacco flavor, with bacterial microorganisms contributing more to the flavor formation of CTLs.

Keywords: Bacteria, Fungi; Cigar tobacco leaves; Flavor; Volatile flavor compounds.


Conflict of interest statement

The authors declare no competing interests.

Figures

Fig. 1
Fig. 1
Microbial community diversity in CTLs from diverse origins. Bacteria alpha diversity (A, C) and fungal alpha diversity (B, D) of CTLs from diverse origins are determined based on the Chao1 index, the ACE index, the Shannon index, and the Simpson index. Considerable differences among various CTL samples are denoted by lowercase letters at the 0.05 level (p < 0.05). Bray–Curtis distance is employed to calculate the beta diversity of bacteria (E) and fungi (F)
Fig. 2
Fig. 2
Microbial community composition in CTLs from diverse origins. Columnar stack diagrams at the phylum level for bacteria (A) and fungi (C). Columnar stack diagrams at the genus level for bacteria (B) and fungi (D)
Fig. 3
Fig. 3
Difference of microbial species in CTLs from diverse origins. Bacteria (A) and fungi (C) LDA value distribution bar plot at the genus level. Color represents species with notable variations in abundance across several groups; the length of the bars on the graph depicts the size of the influence of various species (p < 0.01, LDA score > 3). Network analysis of bacterial (B) and fungal (D) communities in CTLs. The interaction with absolute correlation coefficient |r|> 0.7 and p < 0.05 is selected to draw the network analysis diagram, positive correlations are marked in red, and negative correlations are marked in green. The thickness of the line indicates the size of the interaction, and the thicker the line, the stronger the interaction
Fig. 4
Fig. 4
Composition analysis of VFCs in CTLs from diverse origins. A Pie chart of the proportion of VFCs in CTLs. B Accumulation map of VFCs types and contents in CTLs. C Cluster heat map of VFCs in CTLs, color represents the relative expression level of this metabolite in this group of samples; the matching relationship between color gradient and numerical size is displayed by the gradient color block
Fig. 5
Fig. 5
Analysis on the difference of VFCs in CTLs from diverse origins. A PLS-DA analysis of VFCs in CTLs from different origins, Rx2 is 0.54, Ry2 is 0.986, and Q2 is 0.97. B Permutation test of permutation test of PLS-DA model. C Point-and-stick heat map of 23 different VFCs (p < 0.05, VIP > 1.0). A VIP bubble map of the metabolites is displayed on the left, ordered from top to bottom by VIP value; the X-axis is the projection of the variable importance of each VFC based on the PLS-DA model (VIP > 1.0); the metabolite expression is shown on the right; the color denotes the metabolite’s relative expression level in this sample set. The link between color gradient and numerical size is demonstrated by the color gradient block
Fig. 6
Fig. 6
Correlation analysis of VFCs with bacterial (A) and fungal (B) communities. Through calculating the Spearman correlation coefficient, the interaction with absolute correlation coefficient |r|> 0.7 and p < 0.05 is selected to draw the network correlation graph; blue denotes a negative correlation, whereas red denotes a positive correlation. Circles represent microorganisms and VFCs; the larger the circle, the stronger the correlation between microorganisms and VFCs
Fig. 7
Fig. 7
The key metabolic pathways involved in different VFCs in CTLs (the carotenoid biosynthesis pathway and its transcriptional control). The pathway in the blue rectangle above represents the production of substrates for carotenoid synthesis through the MEP pathway. The pathway in the gray rectangle and green ellipse represents carotenoids’ creation and breakdown in plastids. The abundance of enzymes is indicated by heat map

Similar articles

Cited by

References

    1. Bancalari E, Montanari C, Levante A, Alinovi M, Neviani E, Gardini F, Gatti M (2020) Lactobacillus paracasei 4341 as adjunct culture to enhance flavor in short ripened Caciotta-type cheese. Food Res Int 135:109284. 10.1016/j.foodres.2020.109284 - PubMed
    1. Bastian M, Heymann S, Jacomy M (2009) Gephi: an open source software for exploring and manipulating networks. Proc Int AAAI Conf Web Soc Media 3(1):361–362. 10.1609/icwsm.v3i1.13937
    1. Bolger AM, Lohse M, Usadel B (2014) Trimmomatic: a flexible trimmer for Illumina sequence data. Bioinformatics 30(15):2114–2120. 10.1093/bioinformatics/btu170 - PMC - PubMed
    1. Costa OYA, De Hollander M, Pijl A, Liu B, Kuramae EE (2020) Cultivation-independent and cultivation-dependent metagenomes reveal genetic and enzymatic potential of microbial community involved in the degradation of a complex microbial polymer. Microbiome 8(1):76. 10.1186/s40168-020-00836-7 - PMC - PubMed
    1. Di Giacomo M, Paolino M, Silvestro D, Vigliotta G, Imperi F, Visca P, Alifano P, Parente D (2007) Microbial community structure and dynamics of dark Fire-Cured tobacco fermentation. Appl Environ Microbiol 73(3):825–837. 10.1128/AEM.02378-06 - PMC - PubMed

LinkOut - more resources