

Effect of kilovoltage and quality reference mAs on CT-based attenuation correction in 177Lu SPECT/CT imaging: a phantom study
- PMID: 38407672
- PMCID: PMC11266317
- DOI: 10.1186/s40658-024-00622-6
Effect of kilovoltage and quality reference mAs on CT-based attenuation correction in 177Lu SPECT/CT imaging: a phantom study
Abstract
Introduction: CT-based attenuation correction (CT-AC) plays a major role in accurate activity quantification by SPECT/CT imaging. However, the effect of kilovoltage peak (kVp) and quality-reference mAs (QRM) on the attenuation coefficient image (μ-map) and volume CT dose index (CTDIvol) have not yet been systematically evaluated. Therefore, the aim of this study was to fill this gap and investigate the influence of kVp and QRM on CT-AC in 177Lu SPECT/CT imaging.
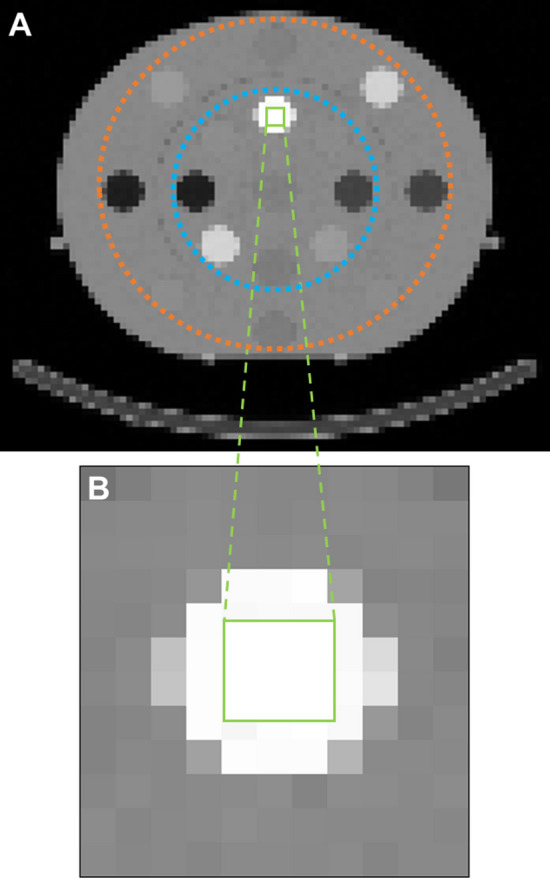
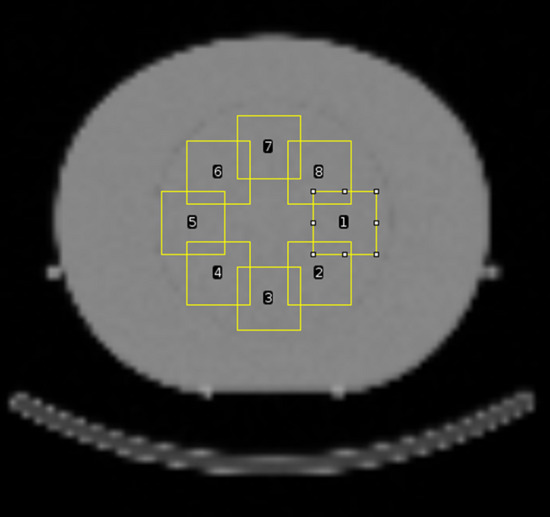
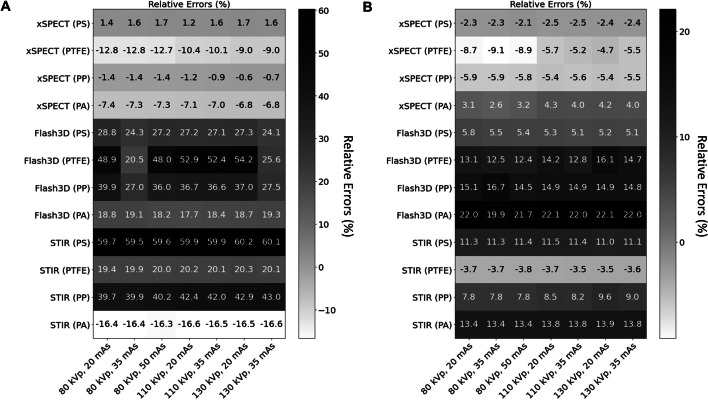
Methods: Seventy low-dose CT acquisitions of an Electron Density Phantom (seventeen inserts of nine tissue-equivalent materials) were acquired using various kVp and QRM combinations on a Siemens Symbia Intevo Bold SPECT/CT system. Using manufacturer reconstruction software, 177Lu μ-maps were generated for each CT image, and three low-dose CT related aspects were examined. First, the μ-map-based attenuation values (μmeasured) were compared with theoretical values (μtheoretical). Second, changes in 177Lu activity expected due to changes in the μ-map were calculated using a modified Chang method. Third, the noise in the μ-map was assessed by measuring the coefficient of variation in a volume of interest in the homogeneous section of the Electron Density Phantom. Lastly, two phantoms were designed to simulate attenuation in four tissue-equivalent materials for two different source geometries (1-mL and 10-mL syringes). 177Lu SPECT/CT imaging was performed using three different reconstruction algorithms (xSPECT Quant, Flash3D, STIR), and the SPECT-based activities were compared against the nominal activities in the sources.
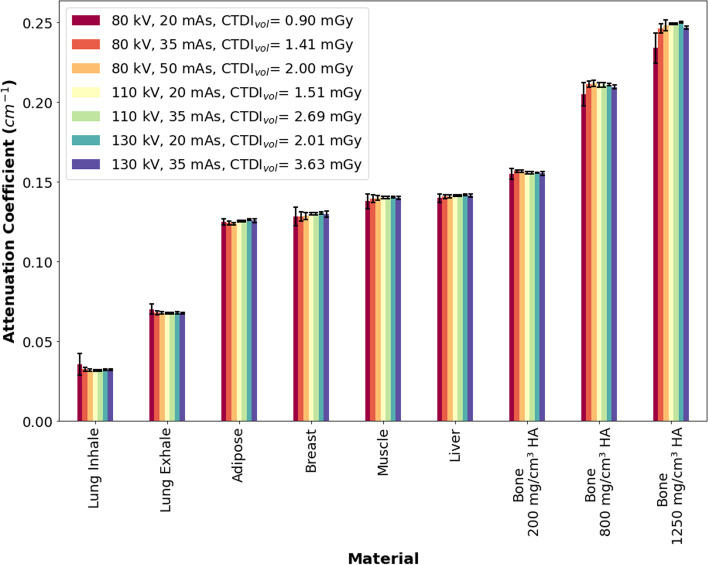
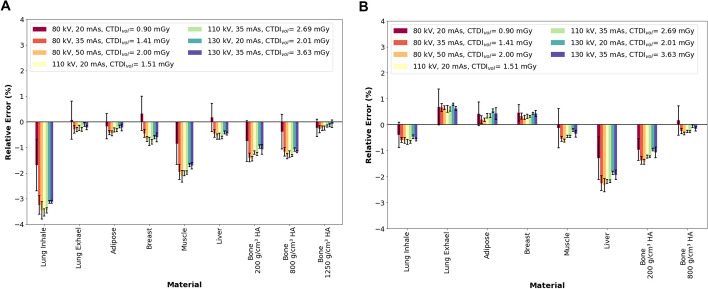
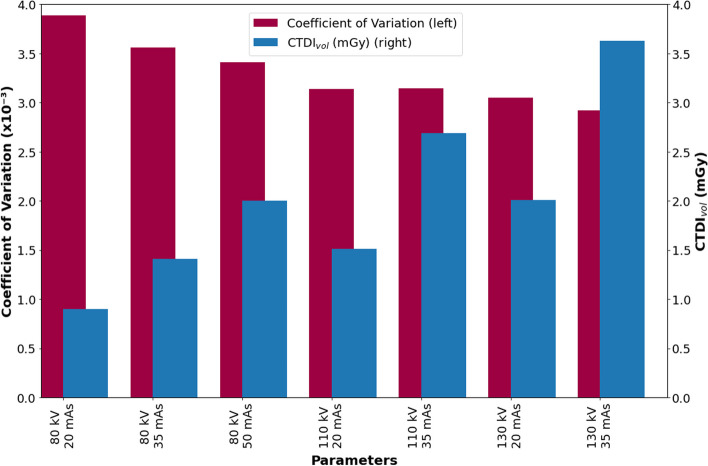
Results: The largest relative errors between μmeasured and μtheoretical were observed in the lung inhale insert (range: 18%-36%), while it remained below 6% for all other inserts. The resulting changes in 177Lu activity quantification were -3.5% in the lung inhale insert and less than -2.3% in all other inserts. Coefficient of variation and CTDIvol ranged from 0.3% and 3.6 mGy (130 kVp, 35 mAs) to 0.4% and 0.9 mGy (80 kVp, 20 mAs), respectively. The SPECT-based activity quantification using xSPECT Quant reconstructions outperformed all other reconstruction algorithms.
Conclusion: This study shows that kVp and QRM values in low-dose CT imaging have a minimum effect on quantitative 177Lu SPECT/CT imaging, while the selection of low values of kVp and QRM reduce the CTDIvol.
Keywords: 177Lu SPECT/CT; Attenuation correction; CTDIvol; Quantitative SPECT/CT.
© 2024. The Author(s).
Conflict of interest statement
M. Lassmann has received institutional grants by IPSEN Pharma, Nordic Nanovector, Novartis, and Pentixapharm. No other potential conflicts of interest relevant to this article exist.
Figures


Similar articles
-
Optimizing Image Quantification for 177Lu SPECT/CT Based on a 3D Printed 2-Compartment Kidney Phantom.J Nucl Med. 2018 Apr;59(4):616-624. doi: 10.2967/jnumed.117.200170. Epub 2017 Nov 2. J Nucl Med. 2018. PMID: 29097409
-
Characterization of Noise and Resolution for Quantitative 177Lu SPECT/CT with xSPECT Quant.J Nucl Med. 2019 Jan;60(1):50-59. doi: 10.2967/jnumed.118.211094. Epub 2018 Jul 5. J Nucl Med. 2019. PMID: 29976698
-
Implications of CT noise and artifacts for quantitative 99mTc SPECT/CT imaging.Med Phys. 2014 Apr;41(4):042502. doi: 10.1118/1.4868511. Med Phys. 2014. PMID: 24694155
-
Dosimetry and adequacy of CT-based attenuation correction for pediatric PET: phantom study.Radiology. 2007 Apr;243(1):96-104. doi: 10.1148/radiol.2431060696. Epub 2007 Feb 9. Radiology. 2007. PMID: 17293575
-
Dual energy CT for attenuation correction with PET/CT.Med Phys. 2014 Jan;41(1):012501. doi: 10.1118/1.4828838. Med Phys. 2014. PMID: 24387525 Free PMC article.
Cited by
-
Position dependence of recovery coefficients in 177Lu-SPECT/CT reconstructions - phantom simulations and measurements.EJNMMI Phys. 2024 Jun 28;11(1):52. doi: 10.1186/s40658-024-00662-y. EJNMMI Phys. 2024. PMID: 38937408 Free PMC article.
References
-
- International commission on radiation U, measurements. ICRU Report No. 87: Radiation dose and image-quality assessment in computed tomography. J ICRU. 2012; 12(1): 1–149. - PubMed
-
- Vija H, Desh V, inventors; siemens medical solutions USA Inc assignee. Method for converting ct data to linear attenuation coefficient map data. USA2005.
-
- Kinahan PE, Alessio AM, Lewellen TK, Vesselle HJ, inventors; University of Washington assignee. Method for enhancing the accuracy of PET/CT images. USA2007.
Grants and funding
LinkOut - more resources
Full Text Sources
Research Materials
Miscellaneous
