The Danish Nationwide Electrocardiogram (ECG) Cohort
- PMID: 38407726
- PMCID: PMC10995054
- DOI: 10.1007/s10654-024-01105-9
The Danish Nationwide Electrocardiogram (ECG) Cohort
Abstract
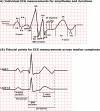
The electrocardiogram (ECG) is a non-invasive diagnostic tool holding significant clinical importance in the diagnosis and risk stratification of cardiac disease. However, access to large-scale, population-based digital ECG data for research purposes remains limited and challenging. Consequently, we established the Danish Nationwide ECG Cohort to provide data from standard 12-lead digital ECGs in both pre- and in-hospital settings, which can be linked to comprehensive Danish nationwide administrative registers on health and social data with long-term follow-up. The Danish Nationwide ECG Cohort is an open real-world cohort including all patients with at least one digital pre- or in-hospital ECG in Denmark from January 01, 2000, to December 31, 2021. The cohort includes data on standardized and uniform ECG diagnostic statements and ECG measurements including global parameters as well as lead-specific measures of waveform amplitudes, durations, and intervals. Currently, the cohort comprises 2,485,987 unique patients with a median age at the first ECG of 57 years (25th-75th percentiles, 40-71 years; males, 48%), resulting in a total of 11,952,430 ECGs. In conclusion, the Danish Nationwide ECG Cohort represents a novel and extensive population-based digital ECG dataset for cardiovascular research, encompassing both pre- and in-hospital settings. The cohort contains ECG diagnostic statements and ECG measurements that can be linked to various nationwide health and social registers without loss to follow-up.
Keywords: Danish nationwide administrative registers; ECG; Electrocardiogram; In-hospital; Population-based; Pre-hospital.
© 2024. The Author(s).
Conflict of interest statement
Dr. Polcwiartek has received research grant support from the Danish Cardiovascular Academy (grant number: CPD5Y-2021003-DCA), funded by the Novo Nordisk Foundation (grant number: NNF20SA0067242) and the Danish Heart Foundation. Dr. Kragholm has received research grant support from GE Healthcare. All other authors have no relevant financial or non-financial interests to disclose.
Figures


References
-
- Kligfield P, Gettes LS, Bailey JJ, et al. Recommendations for the standardization and interpretation of the electrocardiogram: part I: the electrocardiogram and its technology: a scientific statement from the American Heart Association Electrocardiography and Arrhythmias Committee, Council on Clinical Cardiology; the American College of Cardiology Foundation; and the Heart Rhythm Society: endorsed by the International Society for Computerized Electrocardiology. Circulation. 2007;115(10):1306–24. doi: 10.1161/CIRCULATIONAHA.106.180200. - DOI - PubMed
-
- Hancock EW, Deal BJ, Mirvis DM, et al. AHA/ACCF/HRS recommendations for the standardization and interpretation of the electrocardiogram: part V: electrocardiogram changes associated with cardiac chamber hypertrophy: a scientific statement from the American Heart Association Electrocardiography and Arrhythmias Committee, Council on Clinical Cardiology; the American College of Cardiology Foundation; and the Heart Rhythm Society: endorsed by the International Society for Computerized Electrocardiology. Circulation. 2009;119(10):e251–e61. doi: 10.1161/CIRCULATIONAHA.108.191097. - DOI - PubMed
-
- Surawicz B, Childers R, Deal BJ, et al. AHA/ACCF/HRS recommendations for the standardization and interpretation of the electrocardiogram: part III: intraventricular conduction disturbances: a scientific statement from the American Heart Association Electrocardiography and Arrhythmias Committee, Council on Clinical Cardiology; the American College of Cardiology Foundation; and the Heart Rhythm Society: endorsed by the International Society for Computerized Electrocardiology. Circulation. 2009;119(10):e235–e40. doi: 10.1161/CIRCULATIONAHA.108.191095. - DOI - PubMed
MeSH terms
LinkOut - more resources
Full Text Sources
Medical

