

Racial and Geographic Variation of Prenatal Care Coordination Receipt in the State of Wisconsin, 2010-2019
- PMID: 38407757
- PMCID: PMC11305971
- DOI: 10.1007/s10900-024-01338-5
Racial and Geographic Variation of Prenatal Care Coordination Receipt in the State of Wisconsin, 2010-2019
Abstract
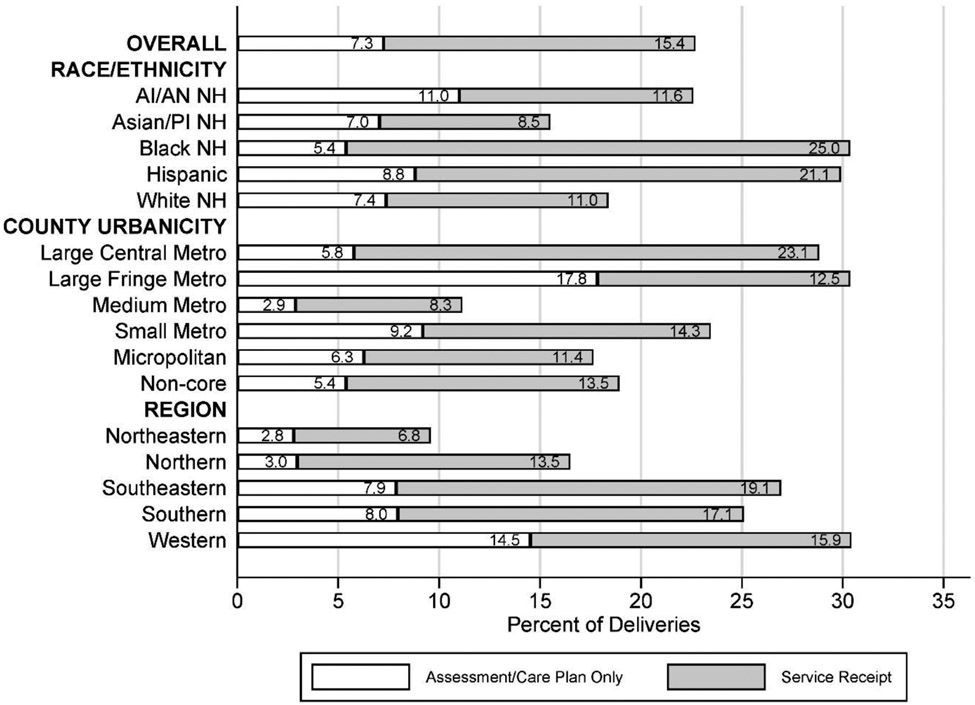
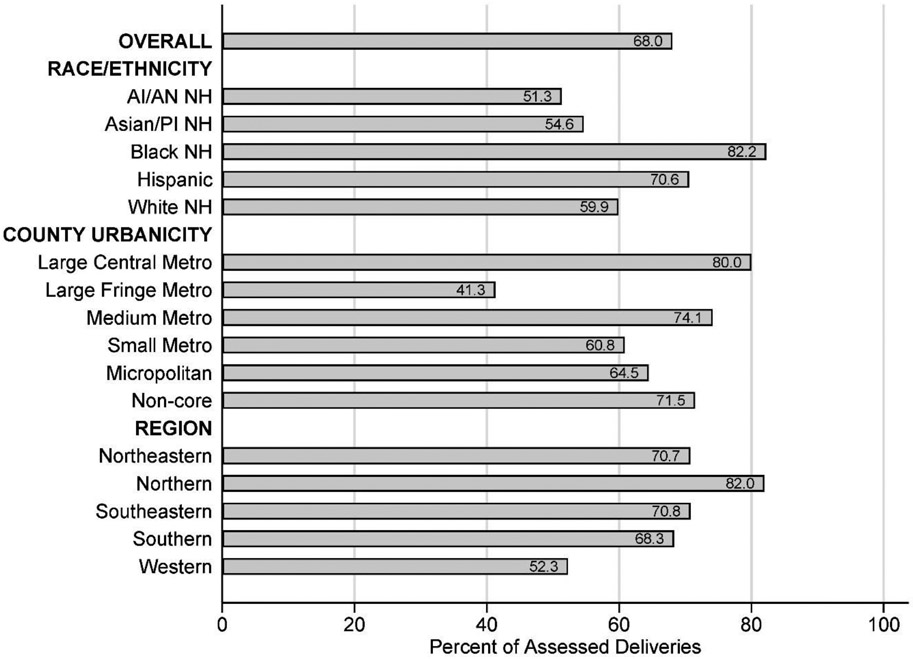
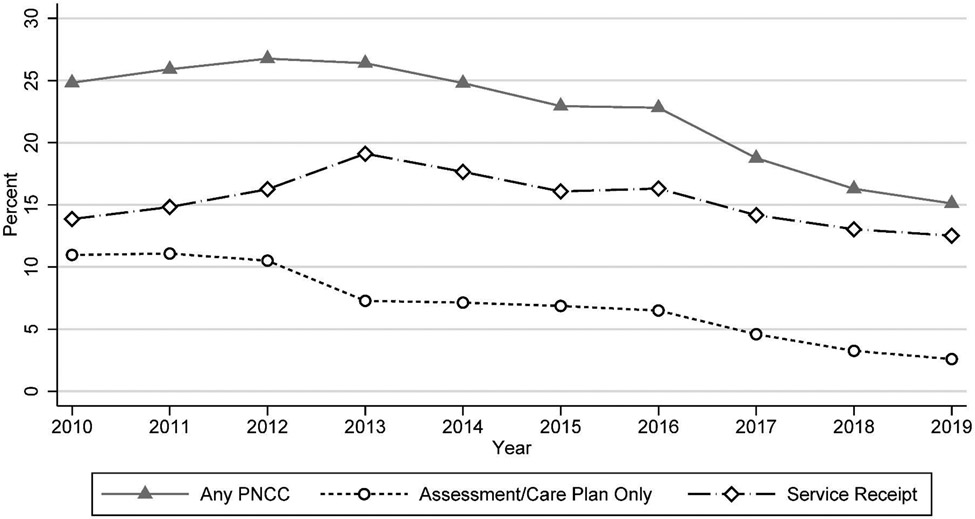
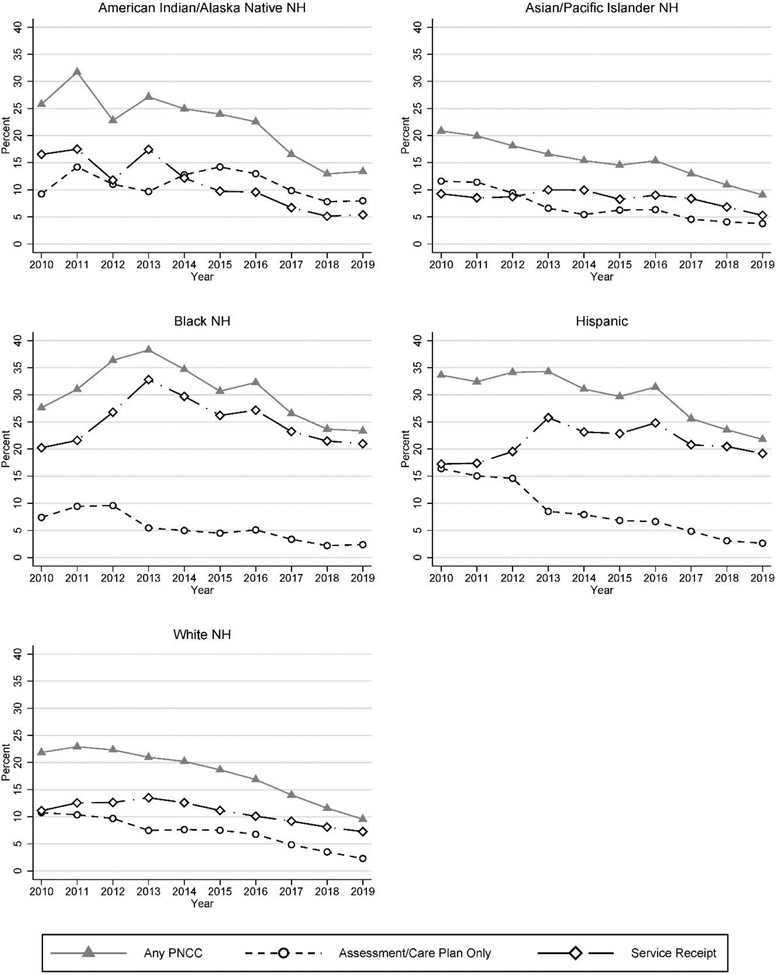
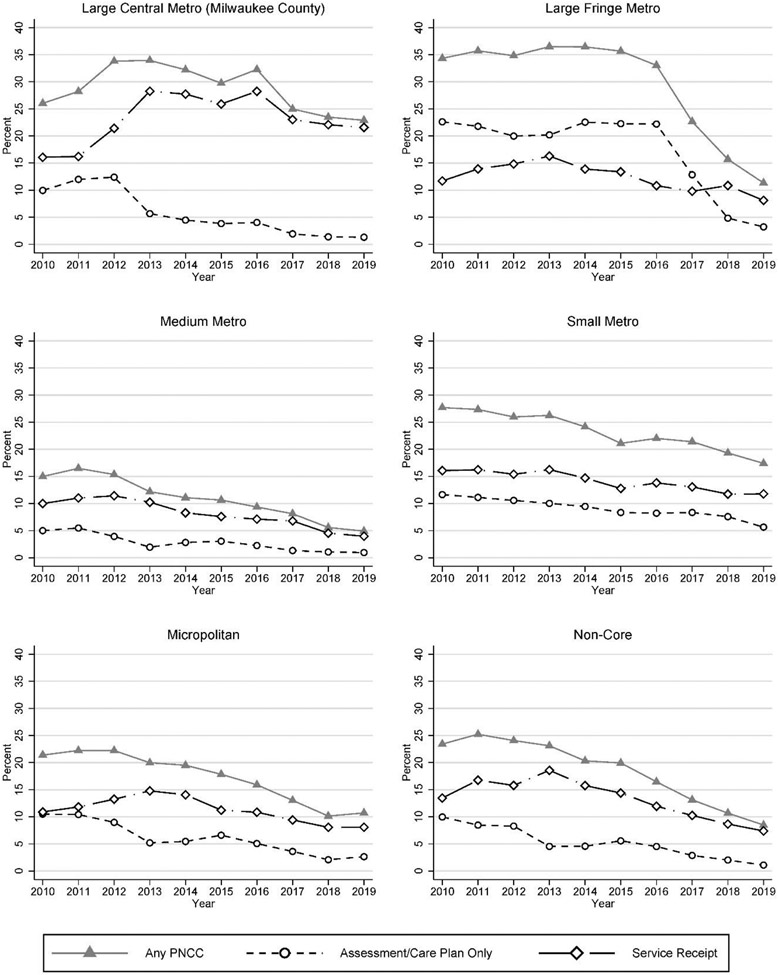
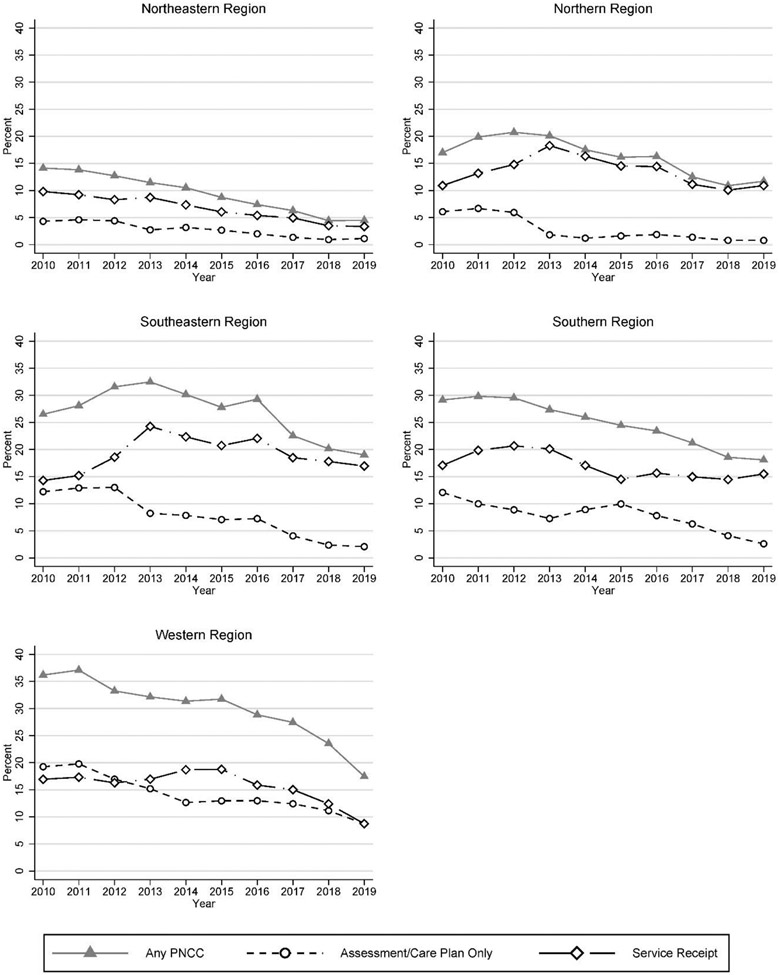
Medicaid-funded obstetric care coordination programs supplement prenatal care with tailored services to improve birth outcomes. It is uncertain whether these programs reach populations with elevated risks of adverse birth outcomes-namely non-white, highly rural, and highly urban populations. This study evaluates racial and geographic variation in the receipt of Wisconsin Medicaid's Prenatal Care Coordination (PNCC) program during 2010-2019. We sample 250,596 Medicaid-paid deliveries from a cohort of linked Wisconsin birth records and Medicaid claims. We measure PNCC receipt during pregnancy dichotomously (none; any) and categorically (none; assessment/care plan only; service receipt), and we stratify the sample on three maternal characteristics: race/ethnicity, urbanicity of residence county; and region of residence county. We examine annual trends in PNCC uptake and conduct logistic regressions to identify factors associated with assessment or service receipt. Statewide PNCC outreach decreased from 25% in 2010 to 14% in 2019, largely due to the decline in beneficiaries who only receive assessments/care plans. PNCC service receipt was greatest and persistent in Black and Hispanic populations and in urban areas. In contrast, PNCC service receipt was relatively low and shrinking in American Indian/Alaska Native, Asian/Pacific Islander, and white populations and in more rural areas. Additionally, being foreign-born was associated with an increased likelihood of getting a PNCC assessment in Asian/Pacific Islander and Hispanic populations, but we observed the opposite association in Black and white populations. Estimates signal a gap in PNCC receipt among some at-risk populations in Wisconsin, and findings may inform policy to enhance PNCC outreach.
Keywords: Care coordination; Medicaid; Prenatal care; Regionalization..
© 2024. The Author(s), under exclusive licence to Springer Science+Business Media, LLC, part of Springer Nature.
Conflict of interest statement
Figures
Similar articles
-
Preventing Infant Mortality Through Medicaid-Administered Prenatal Care Coordination: Evidence From Wisconsin.Health Serv Res. 2025 Apr;60 Suppl 2(Suppl 2):e14437. doi: 10.1111/1475-6773.14437. Epub 2025 Jan 14. Health Serv Res. 2025. PMID: 39807028 Free PMC article.
-
Estimating the effect of Prenatal Care Coordination in Wisconsin: A sibling fixed effects analysis.Health Serv Res. 2020 Feb;55(1):82-93. doi: 10.1111/1475-6773.13239. Epub 2019 Nov 7. Health Serv Res. 2020. PMID: 31701531 Free PMC article.
-
Variable Uptake of Medicaid-Covered Prenatal Care Coordination: The Relevance of Treatment Level and Service Context.J Community Health. 2019 Feb;44(1):32-43. doi: 10.1007/s10900-018-0550-9. J Community Health. 2019. PMID: 30022418 Free PMC article.
-
Prenatal Care Coordination and Well-Child Visit Receipt in Early Childhood.J Am Board Fam Med. 2025 Aug 11. doi: 10.3122/jabfm.2024.240302R2. Online ahead of print. J Am Board Fam Med. 2025. PMID: 40789623
-
Race and Ethnicity Representation in Phase 2/3 Oncology Clinical Trial Publications: A Systematic Review.JAMA Health Forum. 2024 Jun 7;5(6):e241388. doi: 10.1001/jamahealthforum.2024.1388. JAMA Health Forum. 2024. PMID: 38848090 Free PMC article.
Cited by
-
Social and geographical inequalities in prenatal care coverage in Colombia: a multilevel analysis of individual heterogeneity and discriminatory accuracy (MAIHDA).BMJ Glob Health. 2025 Aug 14;10(8):e019608. doi: 10.1136/bmjgh-2025-019608. BMJ Glob Health. 2025. PMID: 40813097 Free PMC article.
-
Preventing Infant Mortality Through Medicaid-Administered Prenatal Care Coordination: Evidence From Wisconsin.Health Serv Res. 2025 Apr;60 Suppl 2(Suppl 2):e14437. doi: 10.1111/1475-6773.14437. Epub 2025 Jan 14. Health Serv Res. 2025. PMID: 39807028 Free PMC article.
-
Global Trends in the Incidence and Primary Causes of Femoral Fractures, Excluding Femoral Neck Fractures: A Global Epidemiological Study.Risk Manag Healthc Policy. 2025 Jan 11;18:117-129. doi: 10.2147/RMHP.S498918. eCollection 2025. Risk Manag Healthc Policy. 2025. PMID: 39816786 Free PMC article.
References
-
- March of Dimes (2022, January). Preterm Birth. Retrieved December 1, 2023, from https://www.marchofdimes.org/peristats/data?reg=99&top=3&stop=63&lev=1&s...
-
- March of Dimes (2022, January). Birthweight. Retrieved December 1, 2023, from https://www.marchofdimes.org/peristats/data?reg=99&top=4&stop=45&lev=1&s...
-
- Martin JA, Hamilton BE, Osterman MJK, Curtin SC, & Mathews TJ (2015). Births: Final data for 2013. National Vital Statistics Reports, 64(1), 1–68. - PubMed
-
- Martin JA, Hamilton BE, Osterman MJK, Driscoll AK, & Mathews TJ (2017). Births: Final data for 2015. National Vital Statistics Reports, 66(1), 1–70. - PubMed
-
- Osterman MJK, Hamilton BE, Martin JA, Driscoll AK, & Valenzuela CP (2023). Births: Final data for 2021. National Vital Statistics Reports, 72(1), 1–53. - PubMed
MeSH terms
Grants and funding
LinkOut - more resources
Full Text Sources
Medical
Miscellaneous
