. 2024 Mar;44(3):408-432.
doi: 10.1002/cac2.12525. Epub 2024 Feb 26.

Targeting autophagy overcomes cancer-intrinsic resistance to CAR-T immunotherapy in B-cell malignancies

Affiliations

Targeting autophagy overcomes cancer-intrinsic resistance to CAR-T immunotherapy in B-cell malignancies

Lu Tang et al. Cancer Commun (Lond). 2024 Mar.

Abstract

Background: Chimeric antigen receptor T (CAR-T) therapy has substantially revolutionized the clinical outcomes of patients with hematologic malignancies, but the cancer-intrinsic mechanisms underlying resistance to CAR-T cells remain yet to be fully understood. This study aims to explore the molecular determinants of cancer cell sensitivity to CAR-T cell-mediated killing and to provide a better understanding of the underlying mechanisms and potential modulation to improve clinical efficacy.

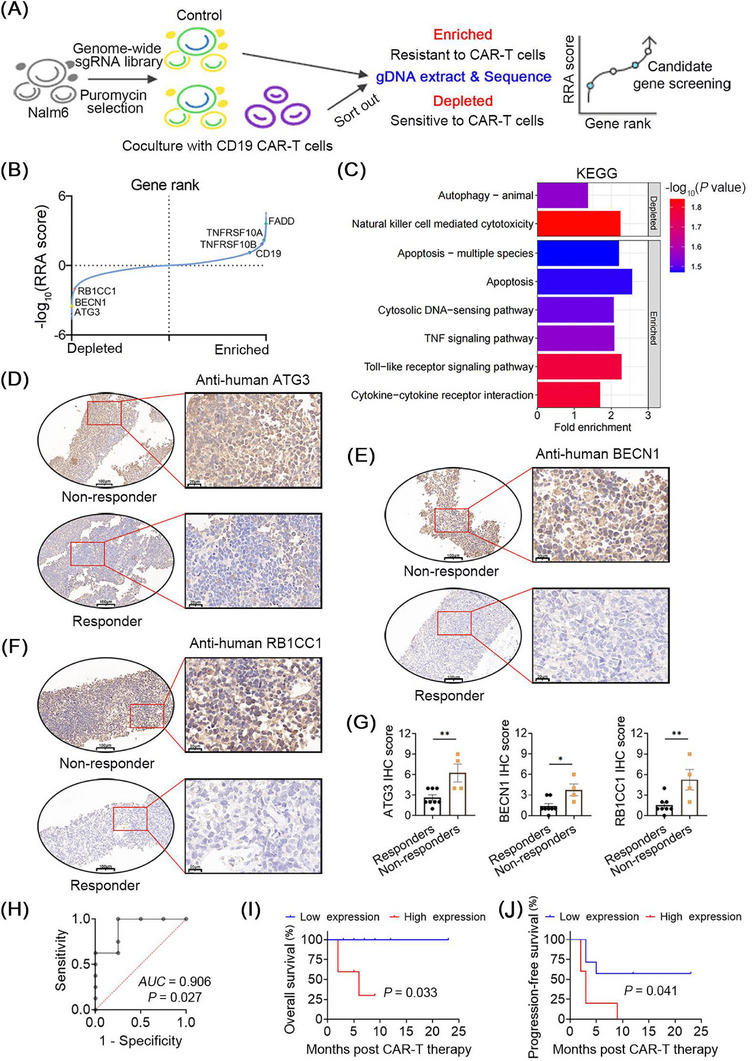
Methods: The human whole-genome CRISPR/Cas9-based knockout screening was conducted to identify key genes that enable cancer cells to evade CD19 CAR-T-cell-mediated killing. The in vitro cytotoxicity assays and evaluation of tumor tissue and bone marrow specimens were further conducted to confirm the role of the key genes in cancer cell susceptibility to CAR-T cells. In addition, the specific mechanisms influencing CAR-T cell-mediated cancer clearance were elucidated in mouse and cellular models.

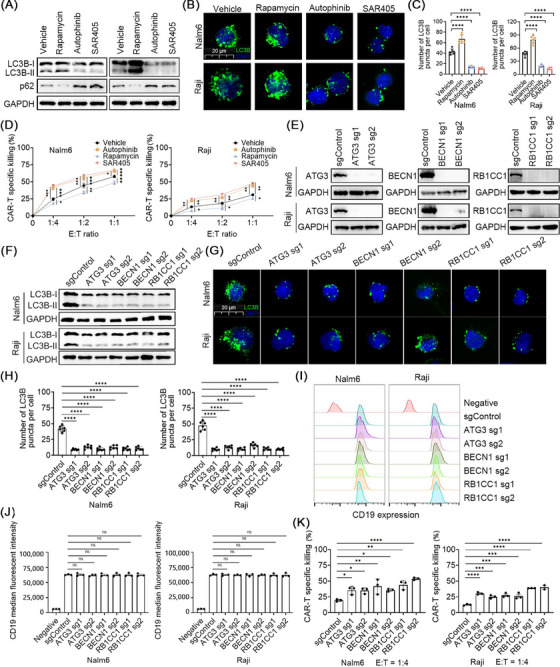
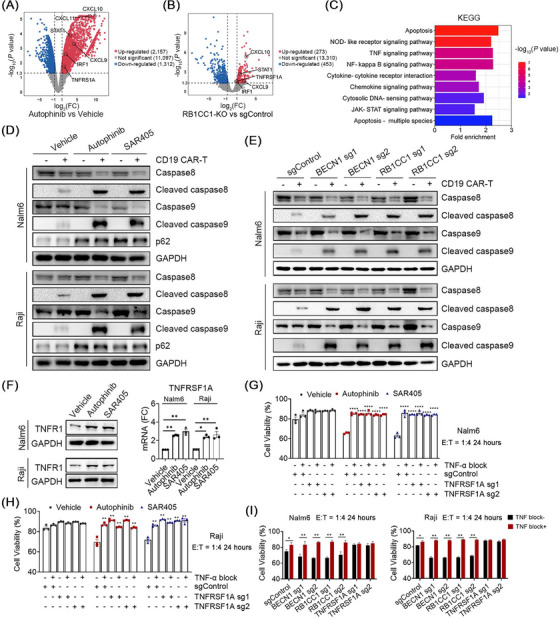
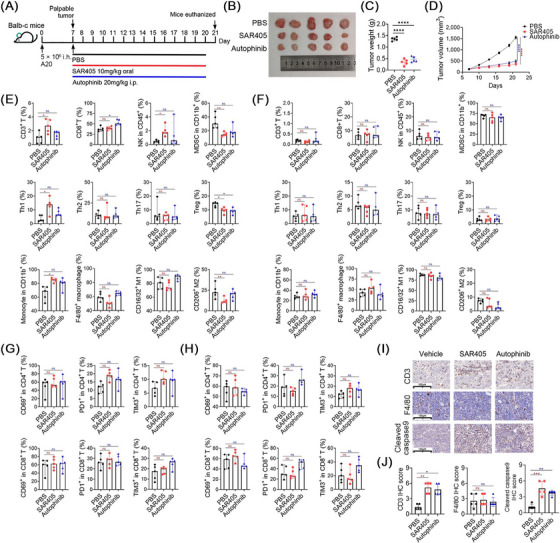
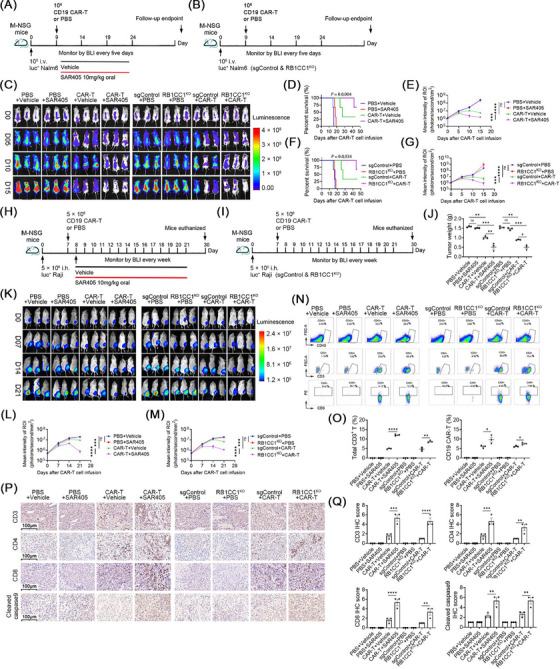
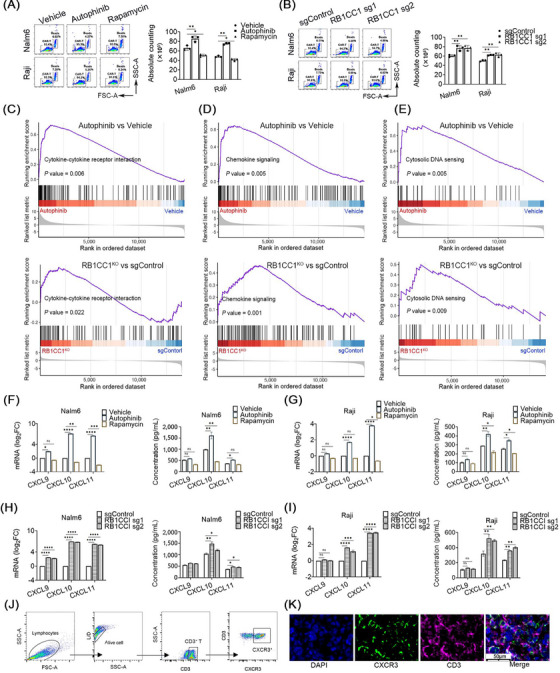
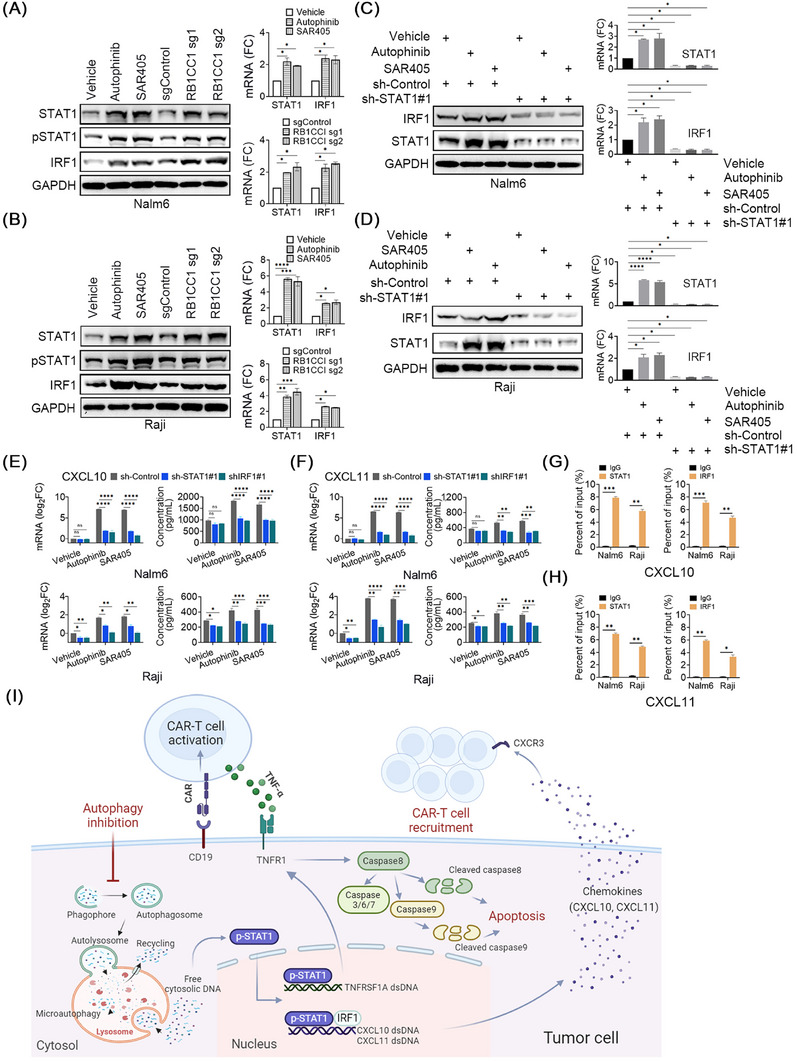
Results: The CRISPR/Cas9-based knockout screening showed that the enrichment of autophagy-related genes (ATG3, BECN1, and RB1CC1) provided protection of cancer cells from CD19 CAR-T cell-mediated cytotoxicity. These findings were further validated by in vitro cytotoxicity assays in cells with genetic and pharmacological inhibition of autophagy. Notably, higher expression of the three autophagy-related proteins in tumor samples was correlated with poorer responsiveness and worse survival in patients with relapsed/refractory B-cell lymphoma after CD19 CAR-T therapy. Bulk RNA sequencing analysis of bone marrow samples from B-cell leukemia patients also suggested the clinical relevance of autophagy to the therapeutic response and relapse after CD19 CAR-T cell therapy. Pharmacological inhibition of autophagy and knockout of RB1CC1 could dramatically sensitize tumor cells to CD19 CAR-T cell-mediated killing in mouse models of both B-cell leukemia and lymphoma. Moreover, our study revealed that cancer-intrinsic autophagy mediates evasion of CAR-T cells via the TNF-α-TNFR1 axis-mediated apoptosis and STAT1/IRF1-induced chemokine signaling activation.

Conclusions: These findings confirm that autophagy signaling in B-cell malignancies is essential for the effective cytotoxic function of CAR-T cells and thereby pave the way for the development of autophagy-targeting strategies to improve the clinical efficacy of CAR-T cell immunotherapy.

Keywords: Apoptosis; Autophagy; CAR‐T resistance; Chemotaxis; Immune evasion.


Conflict of interest statement

No potential conflicts of interest were disclosed.

Figures

FIGURE 1
FIGURE 1
Genome‐wide CRISPR screening identifies essential genes mediating resistance to CAR‐T cells. (A) Schematic of pooled CRISPR knockout screening for Nalm6 cell sensitivity to the killing mediated by CD19 CAR‐T cells. (B) Ranking diagram showing genes that either promote (enriched sgRNAs) or suppress (depleted sgRNAs) tumor cell killing. (C) KEGG pathway enrichment analysis of most differentially‐expressed genes identified in CRISPR screening. (D‐F) Representative images of IHC staining for high and low protein expression of ATG3, BECN1 and RB1CC1 in R/R B‐cell lymphoma before treatment with CD19 CAR‐T cell therapy. The outlined areas in the left images are magnified on the right. Scale bars, 50μm. (G) IHC scores in tumor samples from responders (n = 8) and non‐responders (n = 4). Values are shown as the mean ± SD. The unpaired Student's t test was used to analyze the differences between two groups. (H) The ROC showing the strong correlation between high expression of the three proteins in tumor samples and poor responsiveness to CAR‐T cell infusion. (I‐J) Kaplan–Meier plots of overall survival and progression‐free survival between two groups B‐cell lymphoma patients with low and high expression of ATG3, BECN1 and RB1CC1 as evaluated by IHC. Log‐rank tests were used to analyze the significance between the two groups. *P < 0.05; **P < 0.01. Abbreviations: CAR‐T chimeric antigen receptor T; CRISPR clustered regularly interspaced short palindromic repeat; KEGG Kyoto Encyclopedia of Genes and Genomes; ROC receiver operating curve; IHC immunohistochemistry; R/R relapsed/refractory; RRA robust rank aggregation; sgRNA single‐guide RNA.
FIGURE 2
FIGURE 2
Autophagy protects B‐cell malignancies from CAR‐T cell‐mediated cytotoxicity in vitro. (A) Western blotting showing the expression levels of p62 and LC3B proteins 72 hours after the addition of vehicle (as control), rapamycin, SAR405 and autophinib in Nalm6 and Raji cell lines. GAPDH was used as a loading control. (B‐C) Representative images of LC3B immunofluorescent staining of Nalm6 and Raji cells treated with vehicle (as control), rapamycin, SAR405 and autophinib. Number of LC3B puncta per cell was compared between the three groups (n = 6). Values are shown as the mean ± SD. Differences among groups were calculated with one‐way ANOVA tests. (D) Cytotoxic analysis of vehicle, rapamycin, SAR405 and autophinib pre‐treated Nalm6 and Raji cell lines when co‐cultured with CD19 CAR‐T cells at different E:T ratios (0:1, 1:4, 1:2, 1:1) at 37 °C for 24 hours (n = 3). Values are shown as the mean ± SD. Differences among groups were calculated with two‐way ANOVA tests. (E) Western blotting showing the expression levels of three autophagy‐related (ATG3, BECN1 and RB1CC1) proteins in the sgControl and indicated gene‐KO groups in Nalm6 and Raji cell lines. GAPDH was used as a loading control. (F) Western blotting showing the expression levels of LC3B proteins in the sgControl and indicated gene‐KO groups in Nalm6 and Raji cell lines. GAPDH was used as a loading control. (G‐H) Representative images of LC3B immunofluorescent staining of Nalm6 and Raji cells with sgControl and indicated gene‐KO. Number of LC3B puncta per cell was compared between the groups (n = 6). Values are shown as the mean ± SD. Differences among groups were calculated with one‐way ANOVA tests. (I‐J) Flow cytometry showing the level of CD19 expression in negative control, sgControl and indicated gene‐KO Nalm6 and Raji cell lines. (K) Cytotoxic analysis of sgControl and indicated geneKO Nalm6 and Raji cells co‐cultured with CD19 CAR‐T cells (E:T ratio = 1:4) at 37 °C for 24 hours (n = 3). Values are shown as the mean ± SD. Statistical differences are calculated with one‐way ANOVA with tests. *P < 0.05; **P < 0.01; ***P < 0.001; ****P < 0.0,001; ns: not significant. Abbreviations: ANOVA analysis of variance; CAR‐T chimeric antigen receptor T; E:T effector: target; KO knockout; ns: not significant; SD standard deviation; sgRNA single‐guide RNA.
FIGURE 3
FIGURE 3
Autophagy limits CAR‐T cell‐mediated cytotoxicity by suppressing TNF‐α induced apoptosis. (A) Volcano plot showing varied genes in Nalm6 cells with the addition of vehicle (as control) and autophinib (log2FC > 1 and P < 0.05). (B) Volcano plot showing varied genes between sgControl and indicated RB1CC1KO Nalm6 cells (log2FC > 1 and P < 0.05). (C) KEGG pathway enrichment analysis of varied genes identified in RNA sequencing for Nalm6 cells treated with vehicle (as control) and autophinib. (D) Western blotting showing the expression levels of Caspase‐8, Cleaved caspase‐8, Caspase‐9, Cleaved caspase‐9 and p62 proteins after the addition of vehicle (as control), autophinib and SAR405 in Nalm6 and Raji cells when co‐cultured with or without CD19 CAR‐T cells. GAPDH was used as a loading control. (E) Western blotting showing the expression levels of Caspase‐8, Cleaved caspase‐8, Caspase‐9, Cleaved caspase‐9 and p62 proteins in sgControl and indicated gene‐KO (sgBECN1, sgRB1CC1) Nalm6 and Raji cells when co‐cultured with or without CD19 CAR‐T cells. GAPDH was used as a loading control. (F) Expression of TNFRSF1A mRNA by RT‐qPCR and TNFR1 protein by western blotting in Nalm6 and Raji cells after addition of vehicle (as control), autophinib and SAR405 (n = 3). Values are shown as the mean ± SD. Statistical differences among three groups in each cell line are calculated with one‐way ANOVA with tests. (G‐H) Cytotoxic analysis of sgControl and indicated gene‐KO (sgTNFRSF1A) Nalm6 and Raji cells co‐cultured with CD19 CAR‐T cells (E:T ratio = 1:4) when treated with vehicle (as control), autophinib and SAR405 and then with or without TNF‐block (n = 3). Values are shown as the mean ± SD. Statistical differences are calculated with two‐way ANOVA with tests. (I) Cytotoxic analysis of sgControl and indicated gene‐KO (sgBECN1, sgRB1CC1, sgTNFRSF1A) Nalm6 and Raji cells co‐cultured with CD19 CAR‐T cells (E: T ratio = 1: 4) when treated with or without TNF block (n = 3). Values are shown as the mean ± SD. Statistical differences are calculated with two‐way ANOVA with tests. *P < 0.05; **P < 0.01; ***P < 0.001; ****P < 0.0,001; ns: not significant. Abbreviations: ANOVA analysis of variance; CAR‐T chimeric antigen receptor T; E:T effector:target; FC fold change; FC fold change; KO knockout; KEGG Kyoto Encyclopedia of Genes and Genomes; RT‐qPCR real‐time quantitative polymerase chain reaction; ns: not significant; SD standard deviation; sg single guide; TNF tumor necrosis factor; TNFR1 tumor necrosis factor receptor 1.
FIGURE 4
FIGURE 4
Autophagy targeting suppresses tumor growth and promotes T cell infiltration in mice. (A) Schematic of in vivo experiment to evaluate the impact of vehicle (as control), autophinib and SAR405 on tumor growth and tumor weight in A20 B‐cell lymphoma mouse model (Balb‐c mice, n = 5). (B‐C) Representative tumor images and weight in grams in A20 tumor‐bearing mice treated with PBS (control), SAR405 or autophinib. Values are shown as the mean ± SD. Differences among groups were calculated with one‐way ANOVA tests. (D) Tumor growth curves in A20 tumor‐bearing mice treated with PBS (control), SAR405 or autophinib. Values are shown as the mean ± SD. Differences among groups were calculated with two‐way ANOVA tests. (E‐F) Flow cytometry quantification of various immune cell subsets infiltrating in A20 tumors and bone marrow when treated with PBS (control), SAR405 or autophinib. Values are shown as the median with range. Differences among groups were calculated with the Kruskal–Wallis test. (G‐H) Flow cytometry quantification of the expression of CD69, PD‐1 and TIM3 in CD4+ T and CD8+ T cells infiltrating in A20 tumors and bone marrow when treated with PBS (control), SAR405 or autophinib. Values are shown as the median with range. Differences among groups were calculated with the Kruskal–Wallis test. (I‐J) IHC staining on tumor sections showing the expression of CD3, F4/80 and Cleaved‐caspase9 proteins. Scale bar: 100 μm. Values are shown as the mean ± SD. Statistical differences are calculated with one‐way ANOVA tests. *P < 0.05; **P < 0.01; ***P < 0.001; ****P < 0.0,001; ns: not significant. Abbreviations: ANOVA analysis of variance; i.h. hypodermic injection; i.p. intraperitoneal injection; IHC immunohistochemistry staining; MDSCs myeloid‐derived suppressor cells; NK natural killer; ns: not significant. PBS phosphate buffer solution; SD standard deviation; Th T helper; Tregs regulatory T cells.
FIGURE 5
FIGURE 5
Autophagy targeting improves CAR‐T cell killing in leukemia and lymphoma mouse models. (A‐B) Schematic of in vivo experiment to evaluate the impact of autophagy targeting in luc+ Nalm6 leukemia‐bearing M‐NSG mouse model (n = 3). (C‐E) Leukemia progression was evaluated by bioluminescence imaging and quantitated by mean intensity among groups: i) mice inoculated with luc+ Nalm6 cells treated with vehicle alone, SAR405 alone, the combination of vehicle and CD19 CAR‐T cells, and combination of SAR405 and CD19 CAR‐T cells; ii) mice inoculated with luc+ Nalm6 cells treated with sgControl or RB1CC1KO Nalm6 cells and treated with or without CD19 CAR‐T cells. Values are shown as the mean ± SD. Statistical differences among groups were calculated with two‐way ANOVA tests. (F‐G) As for survival analysis, Log‐rank tests were used to analyze the statistical differences between four groups. (H‐I) Schematic of in vivo experiment to evaluate the impact of autophagy targeting in luc+ Raji lymphoma‐bearing M‐NSG mouse model (n = 3). (J) Lymphoma progression was evaluated by tumor weight. Values are shown as the mean ± SD. Differences among groups were calculated with one‐way ANOVA tests. (K‐M) Lymphoma progression was evaluated by bioluminescence imaging and quantitated by mean intensity among groups: i) mice inoculated with luc+ Raji cells treated with vehicle alone, SAR405 alone, the combination of vehicle and CD19 CAR‐T cells, and combination of SAR405 and CD19 CAR‐T cells; ii) mice inoculated with luc+ Raji cells treated with sgControl or RB1CC1KO Raji cells and treated with or without CD19 CAR‐T cells. Values are shown as the mean ± SD. Statistical differences among groups were calculated with one‐way ANOVA tests. (N‐P) Flow cytometry quantification of total CD3+ T and CD19 CAR‐T cells infiltrating in Raji tumors. Values are shown as the mean ± SD. Statistical differences are calculated with one‐way ANOVA tests. (Q) IHC staining on tumor sections showing the expression of CD3, CD4, CD8 and Cleaved‐caspase9 proteins. Scale bar: 100 μm. (R‐U) IHC scores of CD3, CD4, CD8 and cleaved‐caspase9 proteins in Raji‐tumor samples. Values are shown as the mean± SD. Statistical differences are calculated with one‐way ANOVA with tests. *P < 0.05; **P < 0.01; ***P < 0.001; ****P < 0.0,001; ns: not significant. Abbreviations: ANOVA analysis of variance; CAR‐T chimeric antigen receptor T; i.h. hypodermic injection; i.v. intravenous injection; IHC immunohistochemistry; KO knockout; luc+ luciferase positive; BLI bioluminescence imaging; ns: not significant; PBS phosphate buffer solution; ROI region of Interest; SD standard deviation; sg single guide.
FIGURE 6
FIGURE 6
Inhibition of autophagy enhances the chemotaxis ability of CAR‐T cells by promoting the production and secretion of CXCL10 and CXCL11. (A‐B) Chemotaxis assay and cell counting by flow cytometry showing the chemotaxis ability of CD19 CAR‐T cells with pharmacological targeting of autophagy and knockout of RB1CC1 in Nalm6 and Raji cells in vitro (n = 3). Values are shown as the mean ± SD. Statistical differences between three groups in each cell line are calculated with one‐way ANOVA tests. (C‐E) GSEA analysis of the most differentially expressed genes between Nalm6 cells treated with vehicle and autophinib for 72 hours. (F‐G) Expression of CXCL9, CXCL10 and CXCL11 mRNA by RT‐qPCR and ELISA quantification of CXCL9, CXCL10 and CXCL11 protein levels in the supernatants of Nalm6 cells and Raji cells with the addition of vehicle (as control), autophinib and SAR405 (n = 3). Values are shown as the mean ± SD. Statistical differences are calculated with one‐way ANOVA tests. (H‐I) Expression of CXCL9, CXCL10 and CXCL11 mRNA by RT‐qPCR and ELISA quantification of CXCL9, CXCL10 and CXCL11 protein levels in the supernatants of sgControl and RB1CC1KO Nalm6 and Raji cells (n = 3). Values are shown as the mean ± SD. Statistically significant differences are calculated with two‐way ANOVA tests. (J) Flow cytometry showing the expression of CXCR3 in CAR‐T cells. (K) Immunofluorescent staining on tumor sections showing the expression of CXCR3 in CAR‐T cells. Scale bar: 50 μm. *P < 0.05; **P < 0.01; ***P < 0.001; ****P < 0.0,001; ns: not significant. Abbreviations: CAR‐T chimeric antigen receptor T; CXCL CXC chemokine ligand;ANOVA analysis of variance; ELISA enzyme‐linked immunosorbent assay; FC fold change; GSEA gene set enrichment analysis; ns: not significant; PBS phosphate buffer solution; RT‐qPCR real‐time quantitative polymerase chain reaction; SD standard deviation.
FIGURE 7
FIGURE 7
STAT1/IRF1 axis mediates the upregulation of CXCL10 and CXCL11 induced by autophagy targeting. (A‐B) Western blotting showing the expression levels of STAT1, pSTAT1, and IRF1 proteins in Nalm6 and Raji cells after the addition of autophagy inhibitors or the knockout of RB1CC1 (n = 3). GAPDH was used as a loading control. The histograms showing the expression of STAT1 and IRF1 mRNA by RT‐qPCR quantification. Values are shown as the mean ± SD. Statistical differences are calculated with one‐way ANOVA tests. (C‐D) Western blotting showing the expression levels of STAT1 and IRF1 proteins in Nalm6 and Raji cells after the addition of autophagy inhibitors and the silencing of STAT1 (n = 3). GAPDH was used as a loading control. The histograms showing the expression of STAT1 and IRF1 mRNA by RT‐qPCR quantification. Values are shown as the mean ± SD. Statistical differences are calculated with one‐way ANOVA tests. (E‐F) Expression of CXCL10 and CXCL11 mRNA by RT‐qPCR and ELISA quantification of CXCL10 and CXCL11 protein levels in the supernatants of shControl, shSTAT1 and shIRF1 Nalm6 and Raji cells (n = 3). Values are shown as the mean ± SD. Statistical differences are calculated with two‐way ANOVA tests. (G‐H) ChIP‐qPCR showing the binding of STAT1 and IRF1 to the promoter region of CXCL10 and CXCL11 (n = 3). Values are shown as the mean ± SD. Statistical differences for each cell line are calculated with unpaired Student's t tests. (I) Graphic abstract: in the proposed model, inhibition of cancer cell‐autonomous autophagy leads to accumulation of cytosolic DNA, which thereby not only suppresses cancer cell survival by inducing TNFR1‐TNF‐α mediated apoptosis but also promotes the CAR‐T cell recruitment in tumor microenvironment via STAT1/IRF1‐dependent activation of chemokine signaling. *P < 0.05; **P < 0.01; ***P < 0.001; ****P < 0.0,001; ns: not significant. Abbreviations: ANOVA analysis of variance; CAR‐T, chimeric antigen receptor T; ChIP, chromatin immunoprecipitation; CXCL CXC, chemokine ligand; ELISA, enzyme‐linked immunosorbent assay; FC, fold change; IRF, interferon regulatory factor; ns: not significant; RT‐qPCR, real‐time quantitative polymerase chain reaction; SD, standard deviation; sh short hairpin; STAT, signal transducers and activators of transcription.

Similar articles

Cited by

References

    1. Salter AI, Pont MJ, Riddell SR. Chimeric antigen receptor‐modified T cells: CD19 and the road beyond. Blood. 2018;131(24):2621‐9. - PMC - PubMed
    1. Maude SL, Laetsch TW, Buechner J, Rives S, Boyer M, Bittencourt H, et al. Tisagenlecleucel in Children and Young Adults with B‐Cell Lymphoblastic Leukemia. N Engl J Med. 2018;378(5):439‐48. - PMC - PubMed
    1. Park JH, Rivière I, Gonen M, Wang X, Sénéchal B, Curran KJ, et al. Long‐Term Follow‐up of CD19 CAR Therapy in Acute Lymphoblastic Leukemia. N Engl J Med. 2018;378(5):449‐59. - PMC - PubMed
    1. Larson RC, Maus MV. Recent advances and discoveries in the mechanisms and functions of CAR T cells. Nat Rev Cancer. 2021;21(3):145‐61. - PMC - PubMed
    1. Fraietta JA, Lacey SF, Orlando EJ, Pruteanu‐Malinici I, Gohil M, Lundh S, et al. Determinants of response and resistance to CD19 chimeric antigen receptor (CAR) T cell therapy of chronic lymphocytic leukemia. Nat Med. 2018;24(5):563‐71. - PMC - PubMed

Substances