

Mapping the functional form of the trade-off between infection resistance and reproductive fitness under dysregulated immune signaling
- PMID: 38408106
- PMCID: PMC10919860
- DOI: 10.1371/journal.ppat.1012049
Mapping the functional form of the trade-off between infection resistance and reproductive fitness under dysregulated immune signaling
Abstract
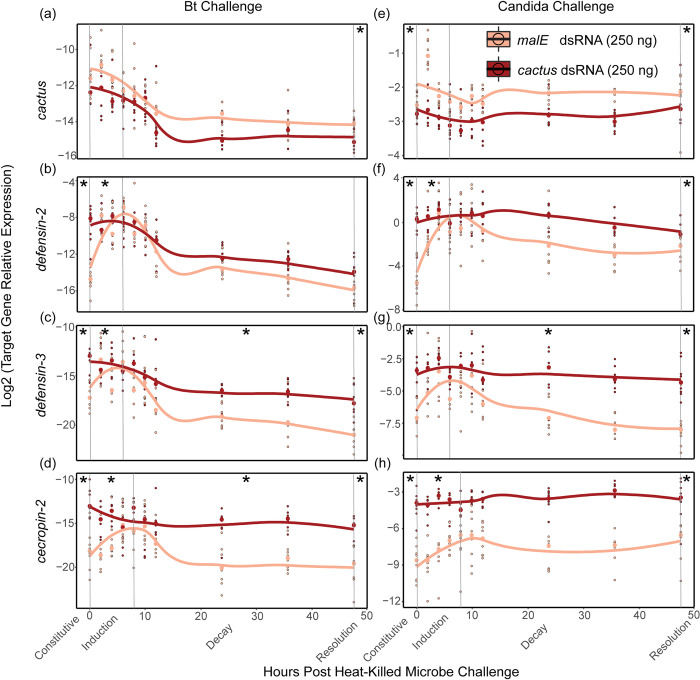
Immune responses benefit organismal fitness by clearing parasites but also exact costs associated with immunopathology and energetic investment. Hosts manage these costs by tightly regulating the induction of immune signaling to curtail excessive responses and restore homeostasis. Despite the theoretical importance of turning off the immune response to mitigate these costs, experimentally connecting variation in the negative regulation of immune responses to organismal fitness remains a frontier in evolutionary immunology. In this study, we used a dose-response approach to manipulate the RNAi-mediated knockdown efficiency of cactus (IκBα), a central regulator of Toll pathway signal transduction in flour beetles (Tribolium castaneum). By titrating cactus activity across four distinct levels, we derived the shape of the relationship between immune response investment and traits associated with host fitness, including infection susceptibility, lifespan, fecundity, body mass, and gut homeostasis. Cactus knock-down increased the overall magnitude of inducible immune responses and delayed their resolution in a dsRNA dose-dependent manner, promoting survival and resistance following bacterial infection. However, these benefits were counterbalanced by dsRNA dose-dependent costs to lifespan, fecundity, body mass, and gut integrity. Our results allowed us to move beyond the qualitative identification of a trade-off between immune investment and fitness to actually derive its functional form. This approach paves the way to quantitatively compare the evolution and impact of distinct regulatory elements on life-history trade-offs and fitness, filling a crucial gap in our conceptual and theoretical models of immune signaling network evolution and the maintenance of natural variation in immune systems.
Copyright: © 2024 Critchlow et al. This is an open access article distributed under the terms of the Creative Commons Attribution License, which permits unrestricted use, distribution, and reproduction in any medium, provided the original author and source are credited.
Conflict of interest statement
The authors have declared that no competing interests exist.
Figures


Update of
-
Mapping the functional form of the trade-off between infection resistance and reproductive fitness under dysregulated immune signaling.bioRxiv [Preprint]. 2023 Aug 14:2023.08.10.552815. doi: 10.1101/2023.08.10.552815. bioRxiv. 2023. Update in: PLoS Pathog. 2024 Feb 26;20(2):e1012049. doi: 10.1371/journal.ppat.1012049. PMID: 37645726 Free PMC article. Updated. Preprint.
Similar articles
-
Mapping the functional form of the trade-off between infection resistance and reproductive fitness under dysregulated immune signaling.bioRxiv [Preprint]. 2023 Aug 14:2023.08.10.552815. doi: 10.1101/2023.08.10.552815. bioRxiv. 2023. Update in: PLoS Pathog. 2024 Feb 26;20(2):e1012049. doi: 10.1371/journal.ppat.1012049. PMID: 37645726 Free PMC article. Updated. Preprint.
-
Natural variation in the contribution of microbial density to inducible immune dynamics.Mol Ecol. 2019 Dec;28(24):5360-5372. doi: 10.1111/mec.15293. Epub 2019 Nov 21. Mol Ecol. 2019. PMID: 31674070
-
Are there genetic trade-offs between immune and reproductive investments in Tribolium castaneum?Infect Genet Evol. 2013 Oct;19:45-50. doi: 10.1016/j.meegid.2013.06.007. Epub 2013 Jun 14. Infect Genet Evol. 2013. PMID: 23770144
-
The role of fecundity and reproductive effort in defining life-history strategies of North American freshwater mussels.Biol Rev Camb Philos Soc. 2013 Aug;88(3):745-66. doi: 10.1111/brv.12028. Epub 2013 Feb 28. Biol Rev Camb Philos Soc. 2013. PMID: 23445204 Review.
-
Constraints, Trade-offs and the Currency of Fitness.J Mol Evol. 2016 Mar;82(2-3):117-27. doi: 10.1007/s00239-016-9730-3. Epub 2016 Feb 26. J Mol Evol. 2016. PMID: 26920684 Review.
Cited by
-
A within-host infection model to explore tolerance and resistance.Elife. 2025 Feb 13;14:e104052. doi: 10.7554/eLife.104052. Elife. 2025. PMID: 39945508 Free PMC article.
-
Resources Modulate Developmental Shifts but Not Infection Tolerance Upon Co-Infection in an Insect System.Mol Ecol. 2025 Mar 20:e17726. doi: 10.1111/mec.17726. Online ahead of print. Mol Ecol. 2025. PMID: 40109235
-
mosGILT controls innate immunity and germ cell development in Anopheles gambiae.BMC Genomics. 2024 Jan 9;25(1):42. doi: 10.1186/s12864-023-09887-0. BMC Genomics. 2024. PMID: 38191283 Free PMC article.
-
Resources modulate developmental shifts but not infection tolerance upon coinfection in an insect system.bioRxiv [Preprint]. 2024 Aug 5:2024.08.01.606236. doi: 10.1101/2024.08.01.606236. bioRxiv. 2024. Update in: Mol Ecol. 2025 Mar 20:e17726. doi: 10.1111/mec.17726. PMID: 39149267 Free PMC article. Updated. Preprint.
References
-
- Graham AL, Allen JE, Read AF. Evolutionary Causes and Consequences of Immunopathology. 2005;36: 373–397. doi: 10.1146/ANNUREV.ECOLSYS.36.102003.152622 - DOI
MeSH terms
Grants and funding
LinkOut - more resources
Full Text Sources
Miscellaneous
