. 2024 May;23(5):e14108.
doi: 10.1111/acel.14108. Epub 2024 Feb 26.

Histone deficiency and hypoacetylation in the aging retinal pigment epithelium

Affiliations

Histone deficiency and hypoacetylation in the aging retinal pigment epithelium

Sushil K Dubey et al. Aging Cell. 2024 May.

Abstract

Histones serve as a major carrier of epigenetic information in the form of post-translational modifications which are vital for controlling gene expression, maintaining cell identity, and ensuring proper cellular function. Loss of histones in the aging genome can drastically impact the epigenetic landscape of the cell leading to altered chromatin structure and changes in gene expression profiles. In this study, we investigated the impact of age-related changes on histone levels and histone acetylation in the retinal pigment epithelium (RPE) and retina of mice. We observed a global reduction of histones H1, H2A, H2B, H3, and H4 in aged RPE/choroid but not in the neural retina. Transcriptomic analyses revealed significant downregulation of histones in aged RPE/choroid including crucial elements of the histone locus body (HLB) complex involved in histone pre-mRNA processing. Knockdown of HINFP, a key HLB component, in human RPE cells induced histone loss, senescence, and the upregulation of senescence-associated secretory phenotype (SASP) markers. Replicative senescence and chronological aging in human RPE cells similarly resulted in progressive histone loss and acquisition of the SASP. Immunostaining of human retina sections revealed histone loss in RPE with age. Acetyl-histone profiling in aged mouse RPE/choroid revealed a specific molecular signature with loss of global acetyl-histone levels, including H3K14ac, H3K56ac, and H4K16ac marks. These findings strongly demonstrate histone loss as a unique feature of RPE aging and provide critical insights into the potential mechanisms linking histone dynamics, cellular senescence, and aging.

Keywords: HINFP; aging; epigenetics; histone acetylation; histones; replicative senescence; retinal pigment epithelium.


Conflict of interest statement

The authors declare no competing interests.

Figures
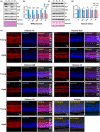
FIGURE 1
FIGURE 1
Loss of histone protein in aged mouse RPE/choroid. (a) Representative images of Western blot analysis of histones H1, H2A, H2B, H3, and H4, along with GAPDH loading control, in RPE/choroid from young and aged mice (n = 6–8 per group). Ponceau‐S stained blot confirmed equal loading across samples. (b) Densitometry analysis showed a significant loss of core and linker histones, normalized to GAPDH, in RPE/choroid of aged mice. (c) Representative Western blots of neural retina from the young and aged mice (n = 6 per group) of all five histones along with GAPDH loading control. Ponceau‐S stained blots confirmed equal loading across samples. (d) Histone levels were quantified by densitometry, revealing no significant changes between young and aged mice. The statistical significance of densitometry data was determined by Mann–Whitney U test (*p < 0.05, **p < 0.01, ***p < 0.001, ns: nonsignificant). The averages (mean ± SEM) of the three independent experiments are shown. (e) Representative fluorescence images of retinal cross‐sections of young and aged mice showing the distribution of histones across different layers of the retina. Intense staining for H1, H2A, H2B, H3, and H4 histones (red) was found across the neural retina in young and aged RPE. Nuclei are stained with Hoechst (blue) in both the young and aged retina. Merged images of overlapping red and blue channels with brightfield showed the localization of histones in the RPE layer. The RPE layer of aged mice showed weak staining for all histones (white arrows) compared to the young mice. The isotype panel showed no immunostaining and served as a negative control. GCL, ganglion cell layer; IPL, inner plexiform layer; INL, inner nuclear layer; OPL, outer plexiform layer; ONL, outer nuclear layer; PRL, photoreceptor layer, RPE; retinal pigment epithelium. Scale bar: 25 μm.
FIGURE 2
FIGURE 2
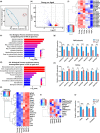
Transcriptome analysis and histone profiling in young and aged mouse RPE/choroid. (a) PCA plot generated using the whole transcriptome dataset showed distinct clustering of young and aged RPE/choroid along the first principal component (PC1), accounting for the highest total variance (58.2%). Blue and red ellipses represent young and aged mice RPE, respectively. Data are from three biologically independent replicates. (b) Volcano plots showing differentially expressed genes (DEGs) as log2 fold change (FC) between young and aged mice RPE along the x‐axis and the y‐axis shows the statistical significance of the differences (log10 adjusted p‐value). Red dots represent the upregulated genes, and blue dots represent the downregulated genes in young RPE. The horizontal dotted gray line represents adj. p‐value <0.05, and the vertical dotted gray lines represent log2FC values of −1 and + 1. (c and d) The top 10 enriched terms from GO analysis of top 100 up‐ (c) and down‐regulated (d) genes in young versus aged mice RPE/choroid. The x‐axis represents the ‐log10 scale for adjusted p‐value of each GO term. (e) Hierarchical clustering and heatmap analysis of selected SASP markers in the RPE/choroid of young and aged mice. Blue to red represents low to high gene expression. (f) Hierarchical clustering and heatmap of 20 histone variants found to be significantly downregulated (adj p‐value <0.05) in aged RPE/choroid. Blue to red represents low to high gene expression. (g and h) Relative expression levels of selected histone genes validated by qPCR in mouse (n = 5) RPE/choroid (g) and neural retina (h). (i) Hierarchical clustering and heatmap analysis showed the expression profile of HLB components. *Represent genes that are significantly downregulated in aged RPE. (j) qPCR analysis of Hinfp, Npat, and Casp8ap2 genes in young and aged RPE/choroid (n = 4–6). GAPDH was used for normalization, and statistical analysis was performed using the Mann–Whitney U test (*p < 0.05, **p < 0.01, ***p < 0.001) in g, h, and j. Results presented as mean ± SEM.
FIGURE 3
FIGURE 3
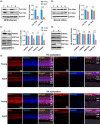
Reduced histone levels and accelerated hRPE senescence after HINFP knockdown. (a) Evaluation of relative HINFP level by qPCR in hRPE cells treated with control‐ and HINFP‐siRNAs. (b) Western blot of HINFP siRNA‐treated hRPE cells showed a significant knockdown of HINFP compared to scramble siRNA‐treated controls. (c) qPCR analysis of selected histone isoforms in control and HINFP KD hRPE cells (n = 3 isolates). (d) Representative images of Western blot analysis of histones H1, H2A, H2B, H3, H4, and GAPDH loading control in HINFP KD and control hRPE cells. Ponceau‐S stained blot indicated equal sample loading. (e) Densitometry analysis showed a significant loss of core and linker histones in hRPE cells treated with HINFP siRNA compared to scramble siRNA‐treated controls (n = 3 isolates). (f) MTT assay was used to measure cell proliferation in control and HINFP KD hRPE cells. The results are shown as the mean ± SD of three independent experiments performed in triplicate. (g) SASP markers were analyzed by qPCR analysis in control and HINFP KD hRPE cells. (h) Representative images of control and HINFP KD hRPE cells showing cellular senescence by SA‐β‐Gal staining (blue) and eosin counterstain (red). GAPDH was used for normalization and results were presented as mean ± SEM in a, c, e, and g. Statistical analysis was performed using either Mann–Whitney U test as in c, e, or unpaired t‐test as in a, f, and g (*p < 0.05, **p < 0.01, ***p < 0.001, ns: nonsignificant).
FIGURE 4
FIGURE 4
Evaluation of histones in the replicative senescence model of human RPE. (a) Cell proliferation rates of hRPE isolates (n = 3) in early (e), late (L), and senescent (S) cells were measured using MTT assay. (b) Representative fluorescence images showed localization of RPE65 (Red) in the cytoplasm of hRPE cells with Hoechst‐positive (Blue) nucleus in both E and S cells. (c) SASP markers were analyzed by qPCR and normalized with GAPDH. (d) SA‐β‐Gal activity in hRPE cells from E, L, and S passages. SA‐β‐Gal cells in three random fields were quantified with results expressed as a percentage of stained cells in total cells counted. (e) qPCR analysis of histone isoforms from E, L, and S hRPE cells (n = 3). (F and G) Western blot and densitometry analysis showed progressive loss of all five histones in L and S cells compared to E hRPE cells. GAPDH is used for normalization in c, e, and g. Data are presented as the mean ± SEM in a, c, d, e, and g. Statistical significance was assessed using unpaired t‐test (*p < 0.05, **p < 0.01, ***p < 0.001, ns: nonsignificant) in a, c, d, e, and g.
FIGURE 5
FIGURE 5
Immunohistochemical analysis of histone expression in the human RPE tissue. (a) Immunostaining for histone H1, H2B, H3, and H4 on FFPE human eye sections (n = 2 young; n = 3 adult; n = 3 aged, representative of 5–13 y.o., 36–48 y.o., and 60–82 y.o. eyes shown) demonstrated markedly decreased expression of histones (white arrows) in the RPE layer (solid black arrow) of aged compared to young and adult donor eyes. Isotype controls showed no staining. Scale bar 25 μm.
FIGURE 6
FIGURE 6
Acetylated histone H3 and H4 levels in RPE/choroid of young and aged mice. (a) Representative Western blots of RPE/choroid cell lysates from young and aged mice showing pan‐acetyl H3, pan‐acetyl H4, and GAPDH loading control. Densitometry values for H3ac and H4ac showed significant depletion of acetylation in aged RPE/choroid (n = 4–6 per group). (b) Western blots of pan‐acetyl H3, pan‐acetyl H4, and GAPDH from retinal cell lysates of young and aged mice. Densitometry values for H3ac and H4ac showed no significant changes in acetylation levels between young and aged neural retinas (n = 4–6 per group). (c and d) Western blots of histone extracts using acetyl‐specific antibodies show the acetylation status of H3K9/K14/K27/K56 (c) and H4K5/K8/K12/K16 (d) in RPE/choroid of young and aged mice. Densitometry analysis of Western blots for specific acetylation marks on H3 and H4 showed a significant loss of acetylation at H3K14/K56 and H4K16 marks (n = 3–4 per group). (e) Representative fluorescence images of H3 and H4 acetylation in RPE of young and aged mice. Staining for pan‐H3ac and ‐H4ac (red) was stronger in the RPE (white arrows) of young mice compared to aged mice. Nuclei are stained with Hoechst (blue) in both young and aged retina. Merged images of overlapping red and blue channels with brightfield showed localization of H3ac and H4ac in the RPE layer. Scale bar: 25 μm. Data were normalized to GAPDH (in a and b), H3 (in c), and H4 (in d). Statistical testing was performed using the unpaired t‐test (*p < 0.05, **p < 0.01, ***p < 0.001, ns: nonsignificant) and data were presented as mean ± SEM.

Similar articles

Cited by

References

    1. Barcaroli, D. , Bongiorno‐Borbone, L. , Terrinoni, A. , Hofmann, T. G. , Rossi, M. , Knight, R. A. , Matera, A. G. , Melino, G. , & De Laurenzi, V. (2006). FLASH is required for histone transcription and S‐phase progression. Proceedings of the National Academy of Sciences of the United States of America, 103(40), 14808–14812. 10.1073/pnas.0604227103 - DOI - PMC - PubMed
    1. Berdasco, M. , Gomez, A. , Rubio, M. J. , Catala‐Mora, J. , Zanon‐Moreno, V. , Lopez, M. , Hernández, C. , Yoshida, S. , Nakama, T. , Ishikawa, K. , Ishibashi, T. , Boubekeur, A. M. , Louhibi, L. , Pujana, M. A. , Sayols, S. , Setien, F. , Corella, D. , de Torres, C. , Parareda, A. , … Esteller, M. (2017). DNA methylomes reveal biological networks involved in human eye development, functions and associated disorders. Scientific Reports, 7(1), 11762. 10.1038/s41598-017-12084-1 - DOI - PMC - PubMed
    1. Blake, J. A. , Baldarelli, R. , Kadin, J. A. , Richardson, J. E. , Smith, C. L. , Bult, C. J. , & Mouse Genome Database Group . (2021). Mouse genome database (MGD): Knowledgebase for mouse‐human comparative biology. Nucleic Acids Research, 49(D1), D981–D987. 10.1093/nar/gkaa1083 - DOI - PMC - PubMed
    1. Bok, D. (1993). The retinal pigment epithelium: A versatile partner in vision. Journal of Cell Science. Supplement, 17, 189–195. 10.1242/jcs.1993.supplement_17.27 - DOI - PubMed
    1. Bonilha, V. L. (2008). Age and disease‐related structural changes in the retinal pigment epithelium. Clinical Ophthalmology, 2(2), 413–424. 10.2147/opth.s2151 - DOI - PMC - PubMed

Publication types