. 2024 Mar 5;121(10):e2317735121.
doi: 10.1073/pnas.2317735121. Epub 2024 Feb 26.

Enhancing chimeric antigen receptor T cell therapy by modulating the p53 signaling network with Δ133p53α

Affiliations

Enhancing chimeric antigen receptor T cell therapy by modulating the p53 signaling network with Δ133p53α

Christopher Roselle et al. Proc Natl Acad Sci U S A. .

Abstract

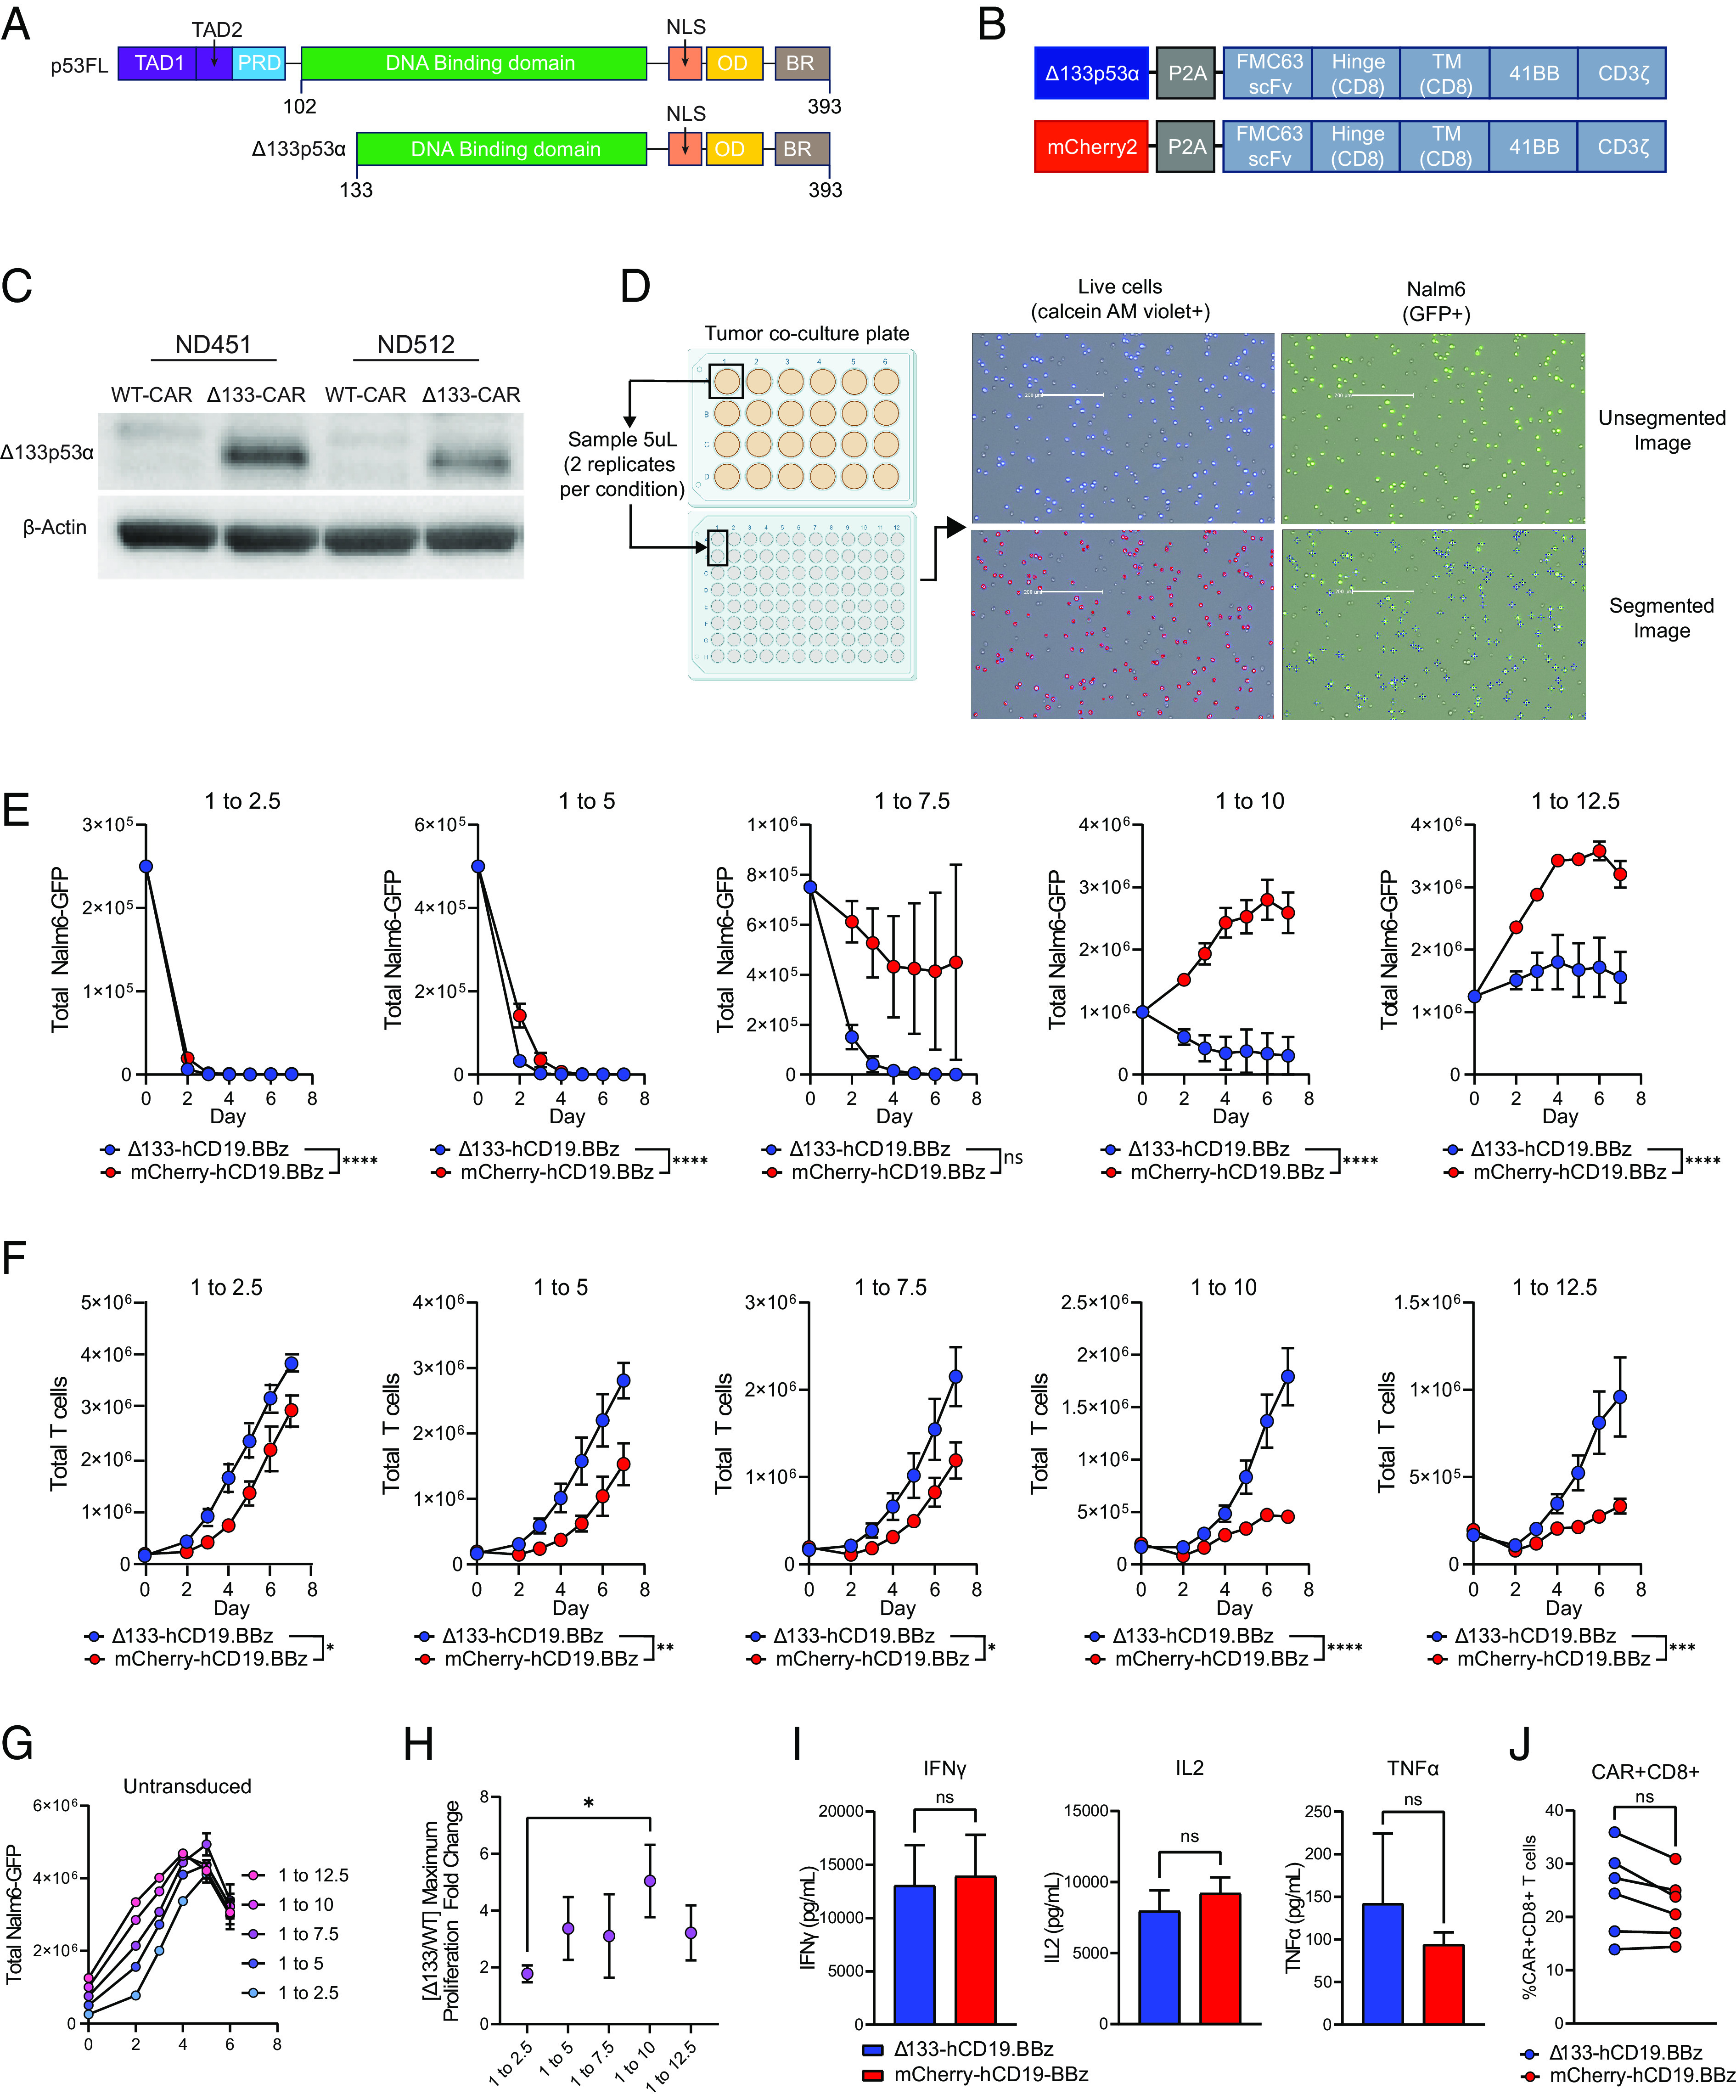
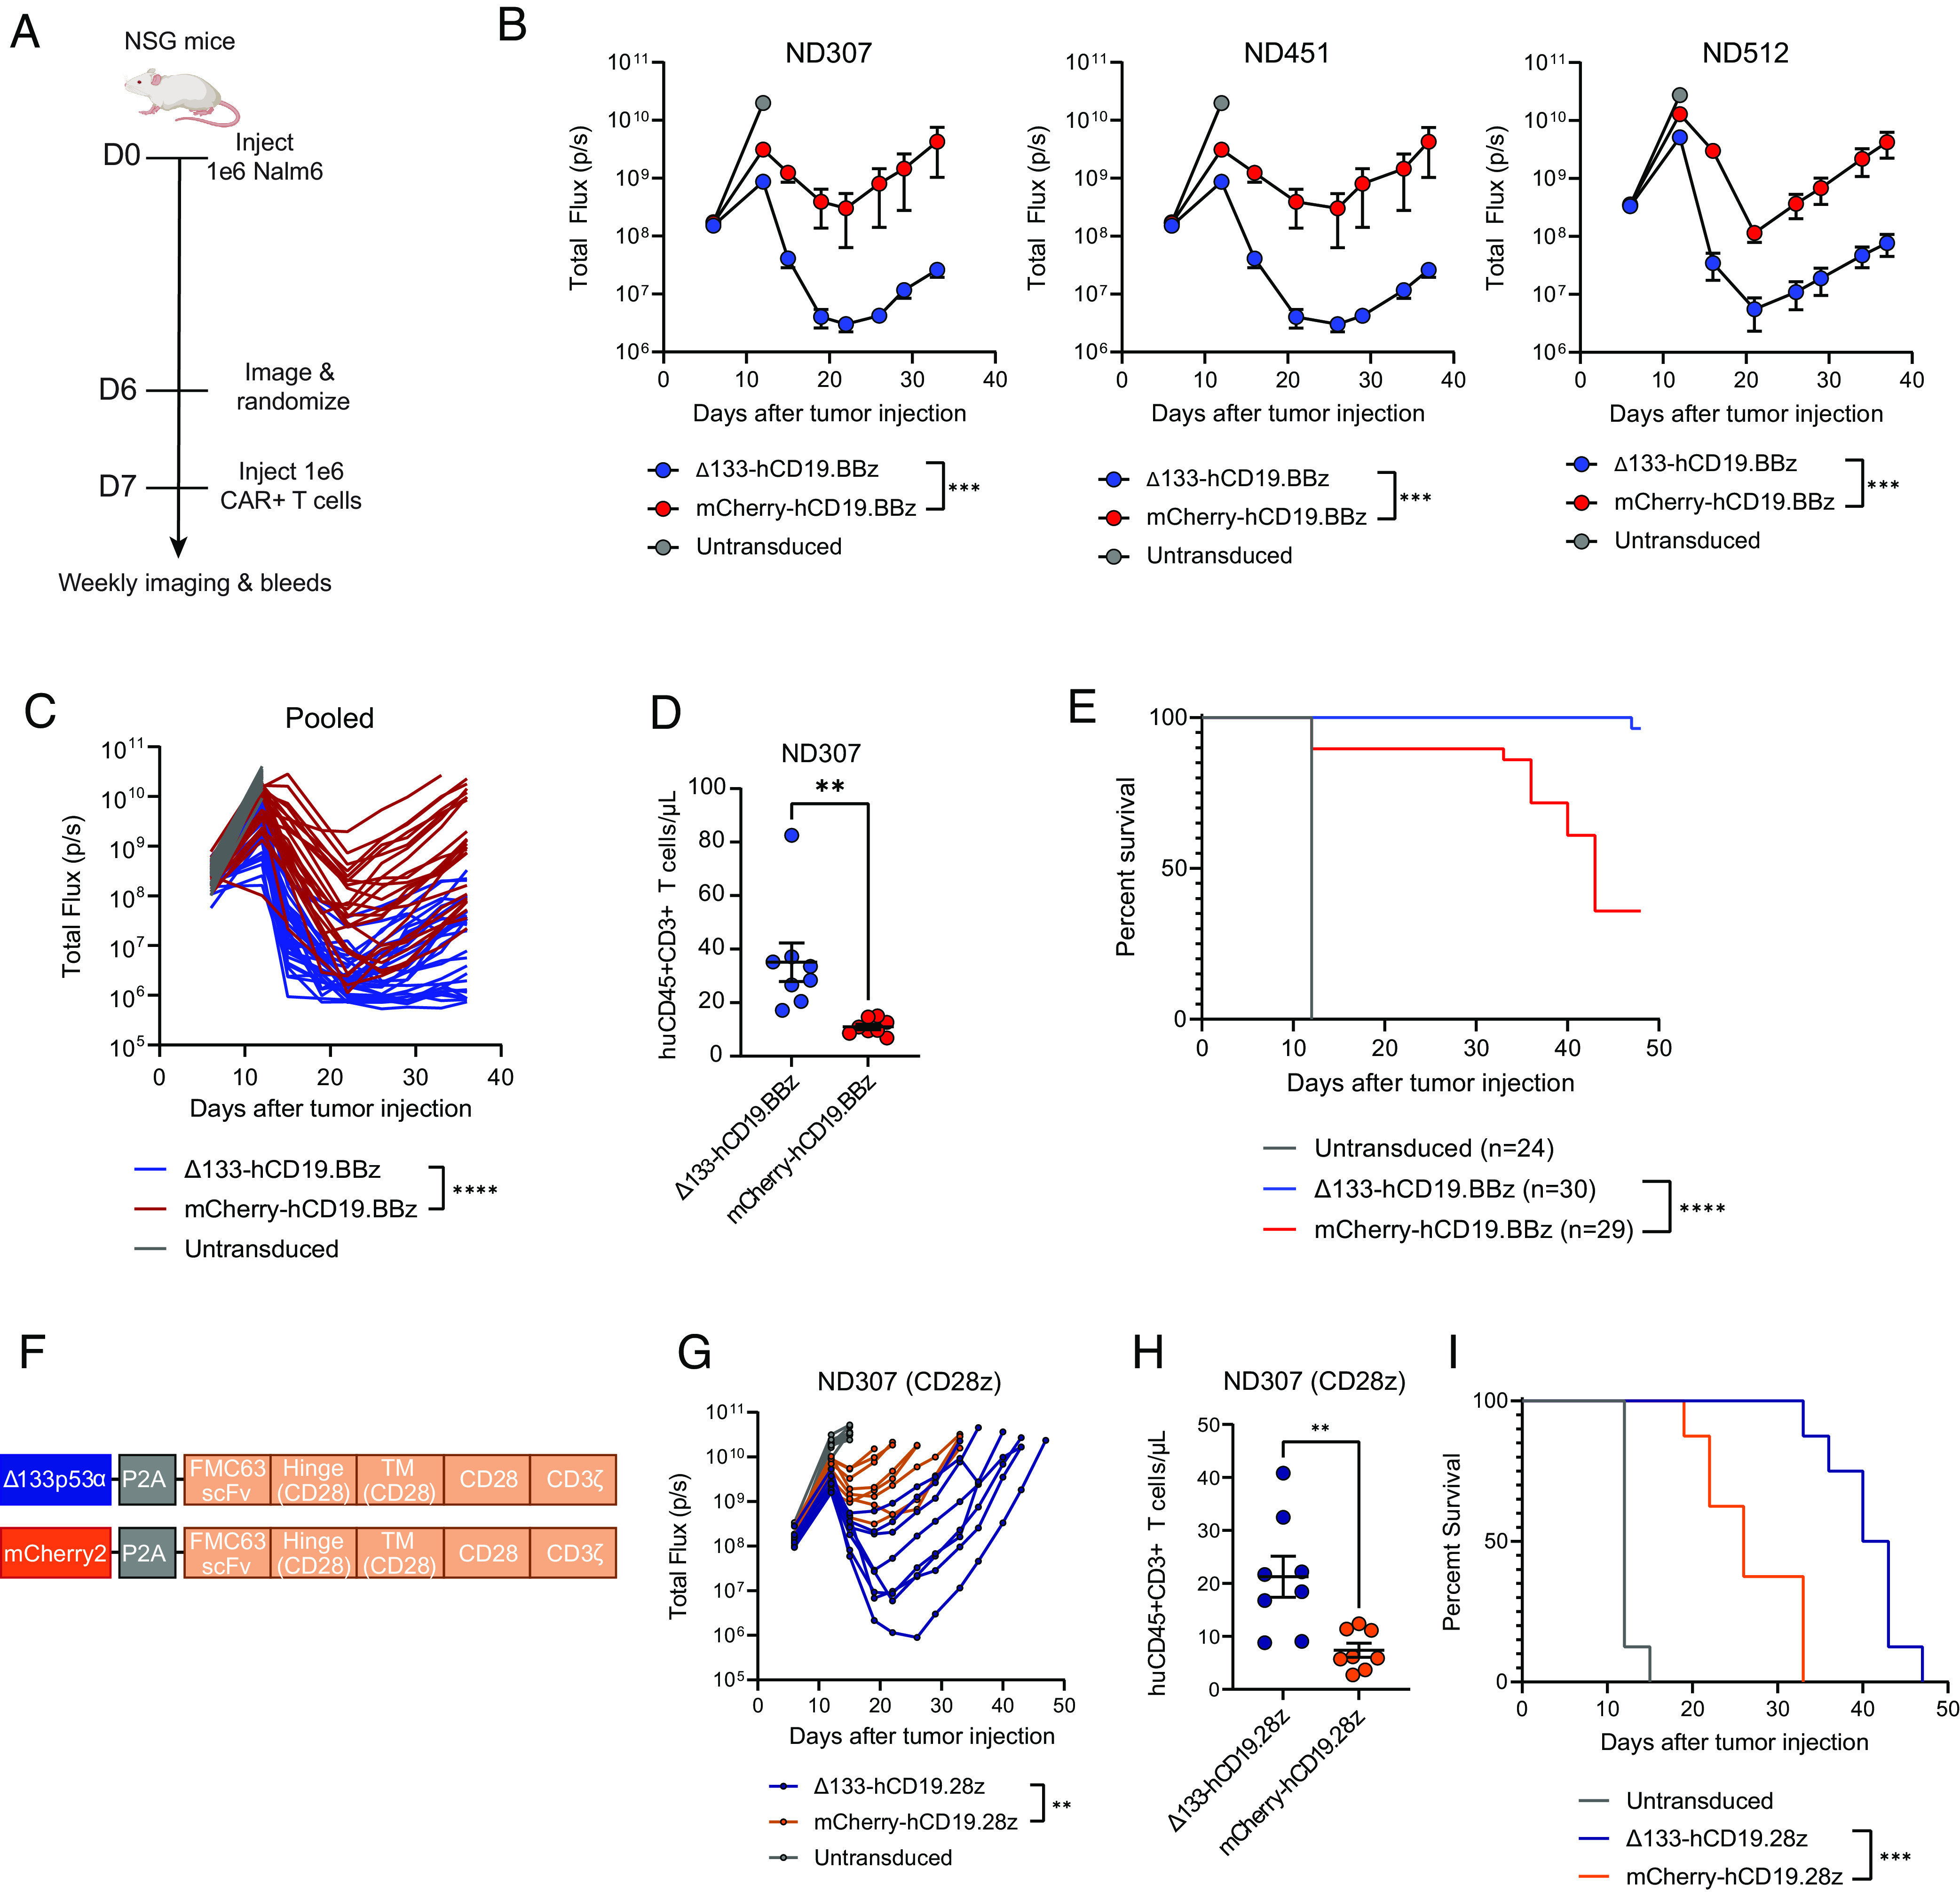
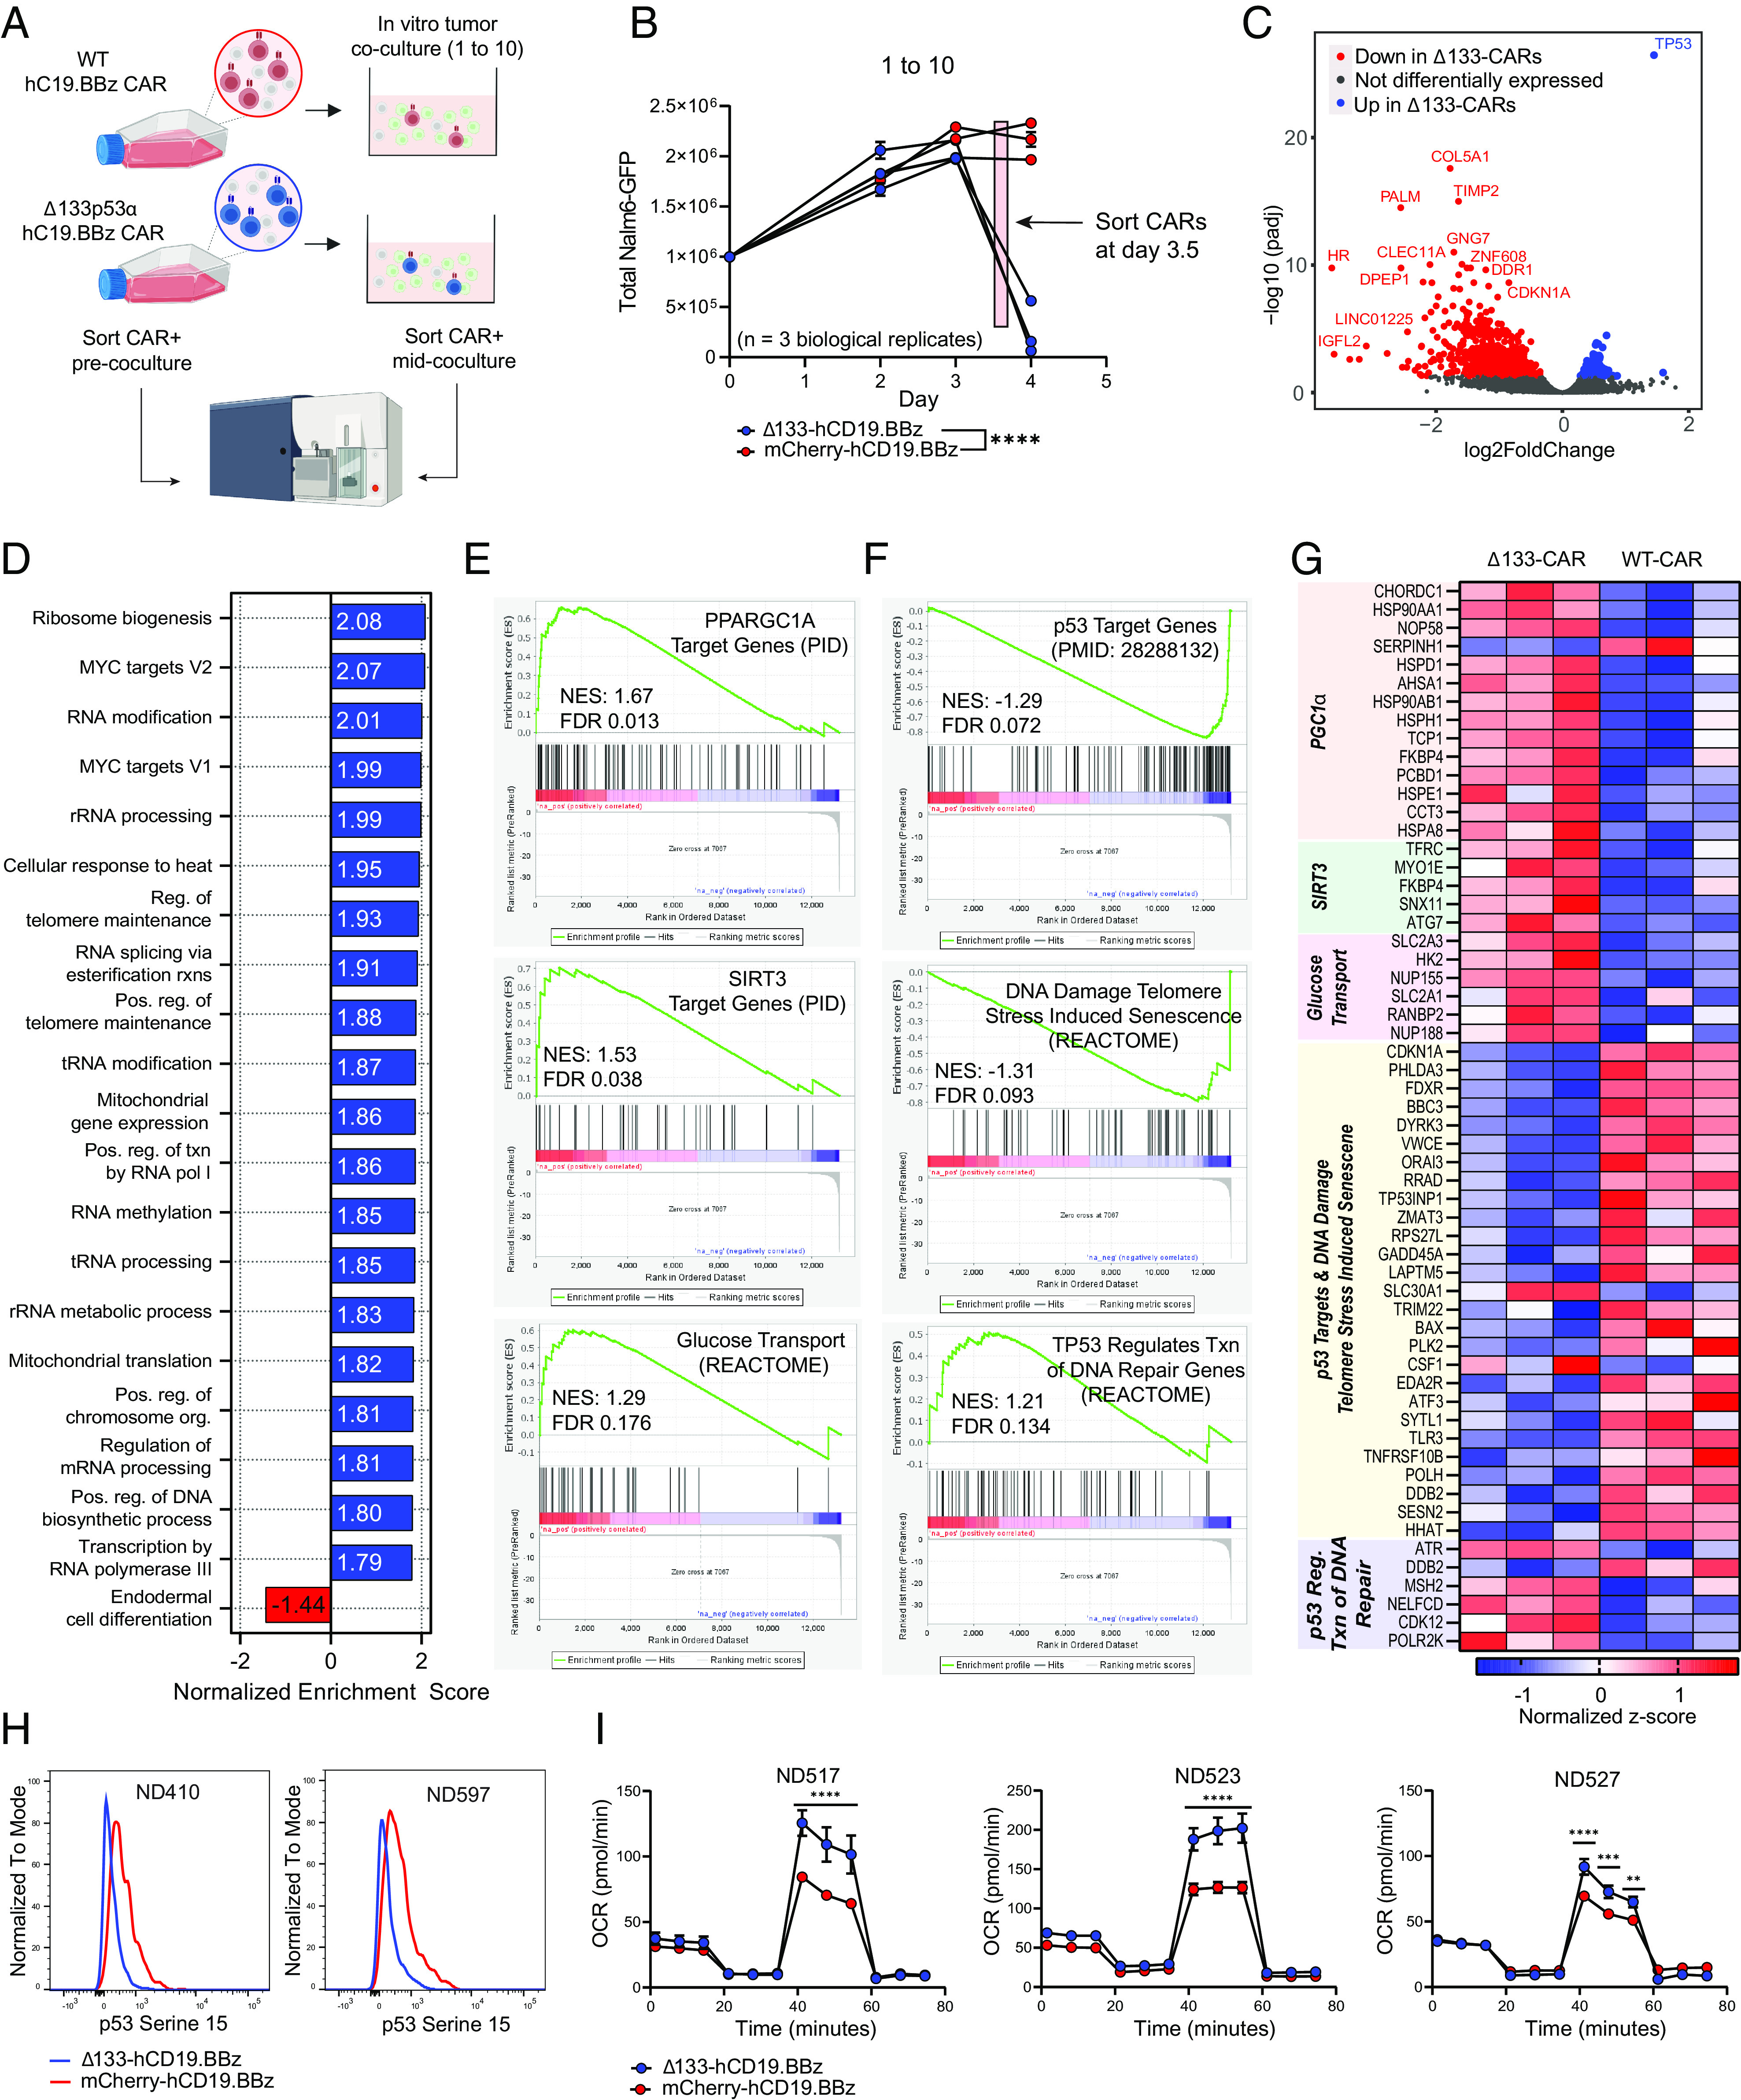
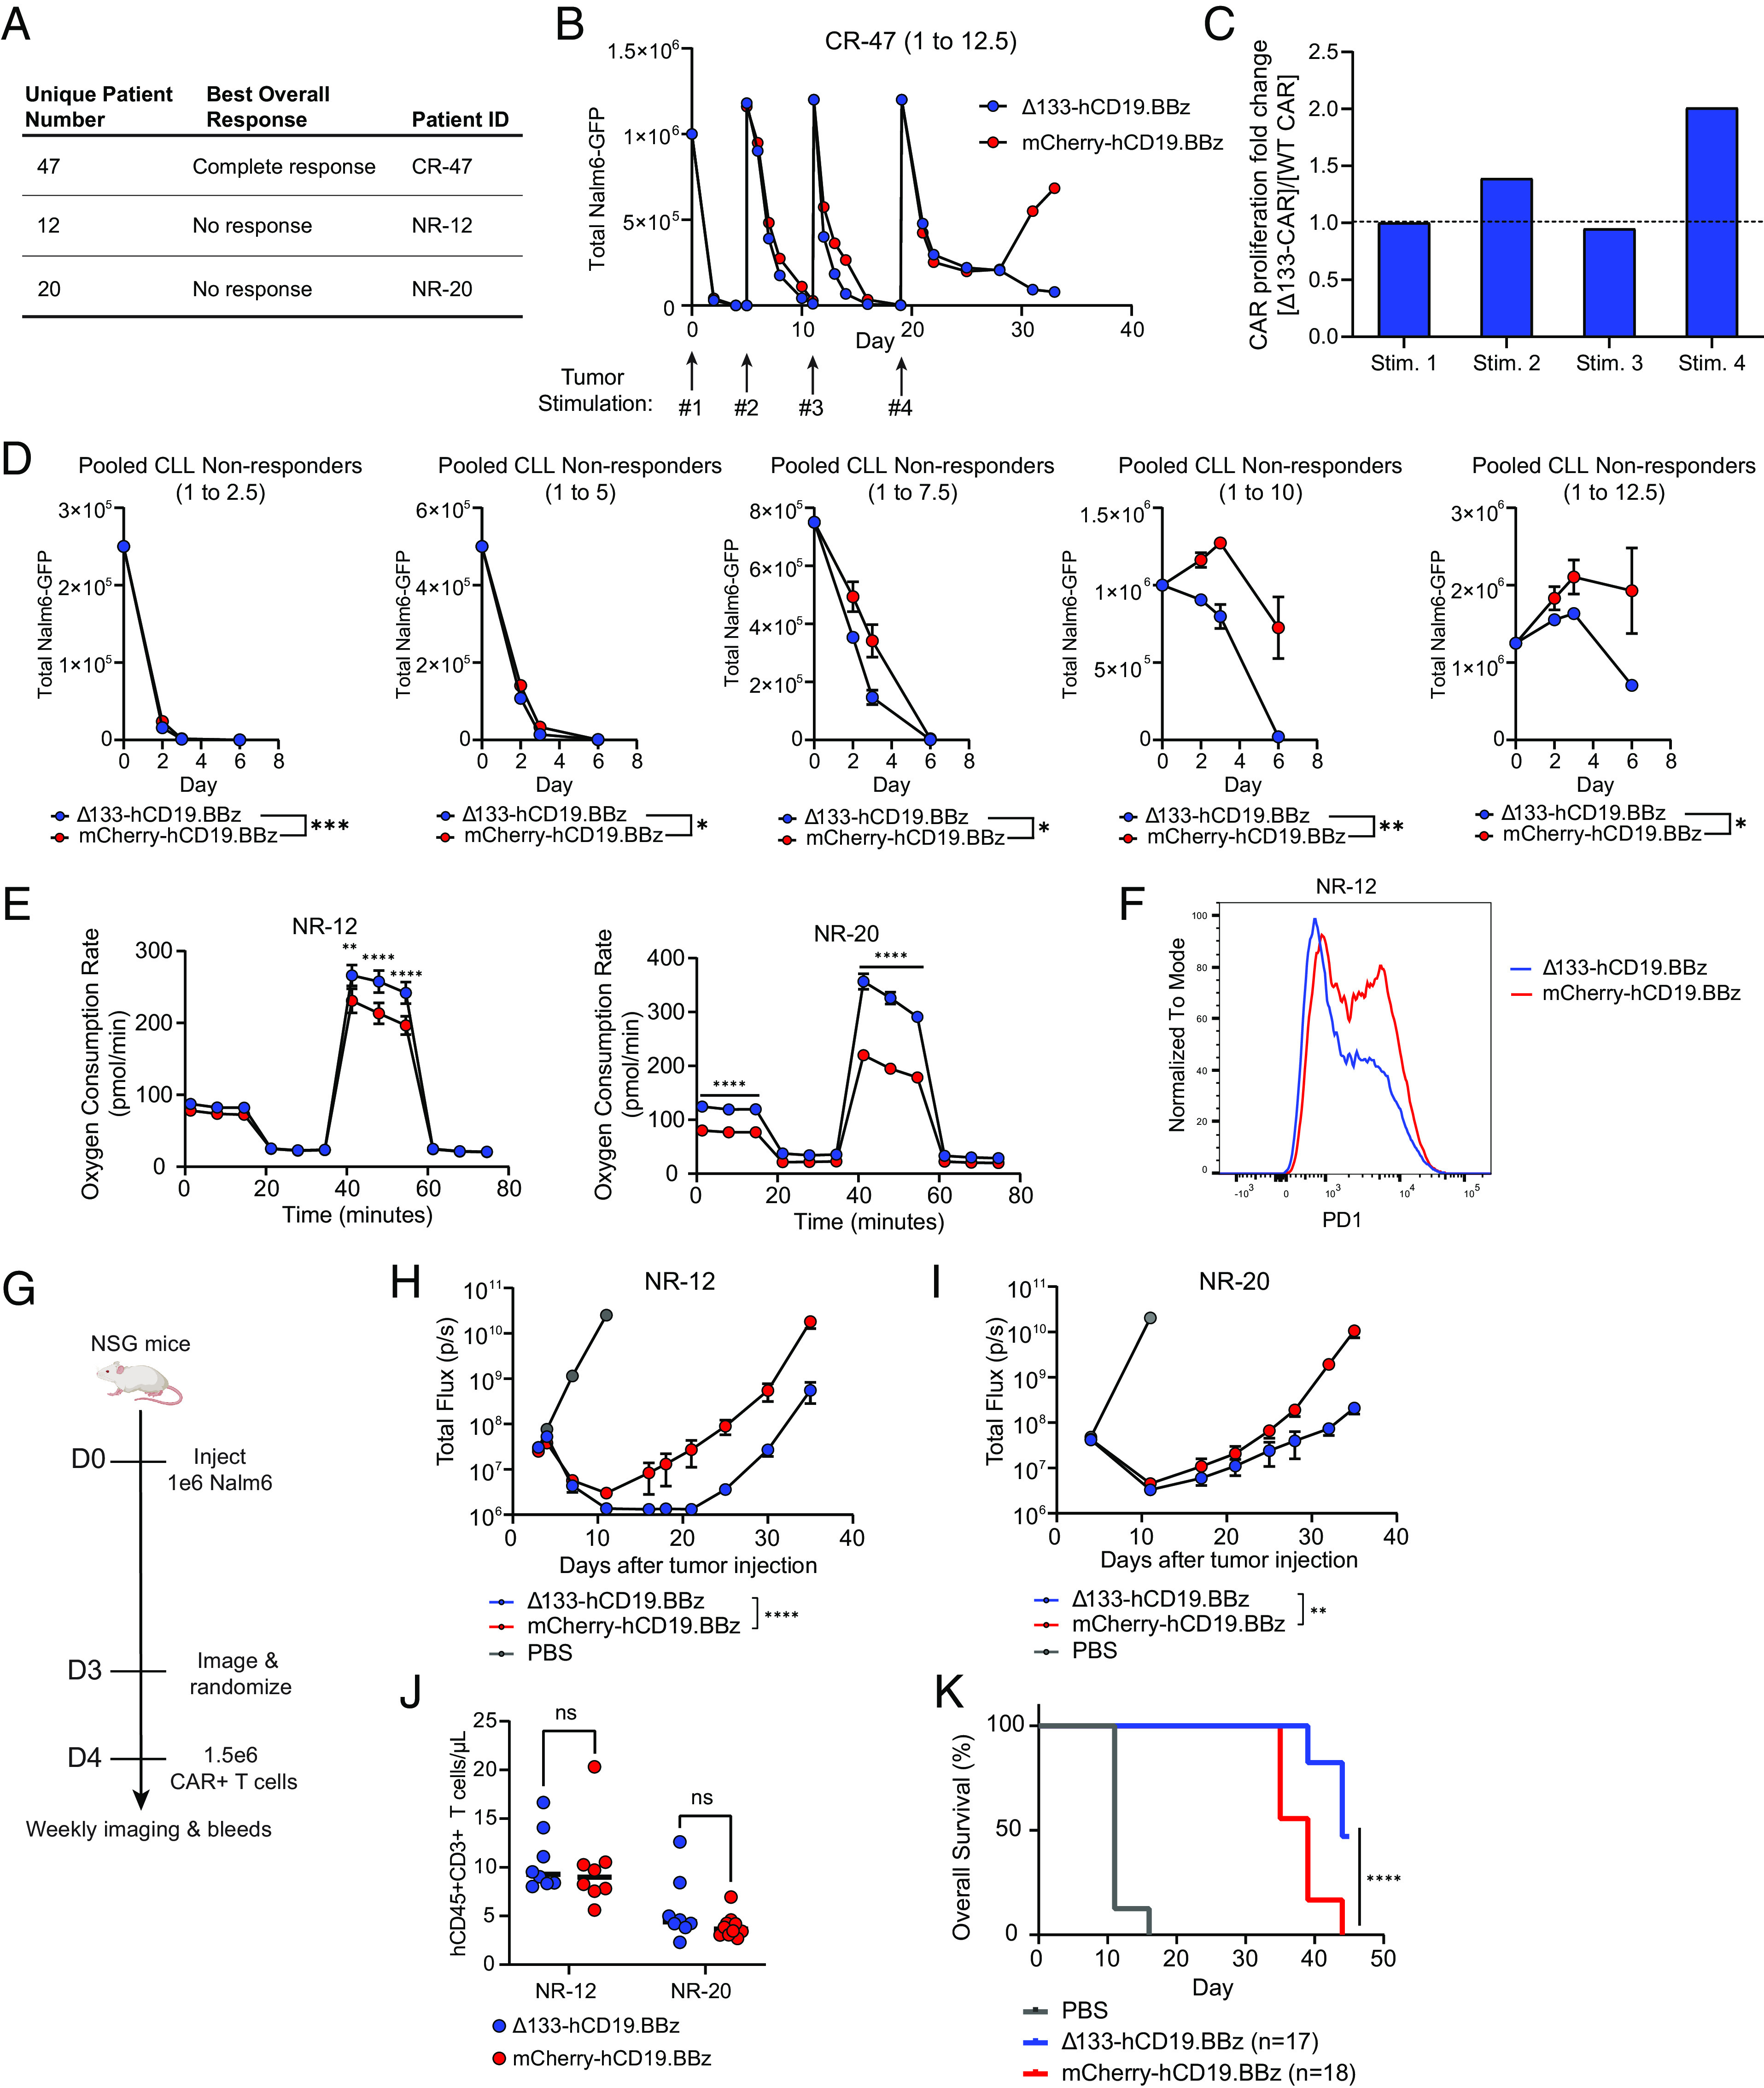
Chimeric antigen receptor (CAR) T cell dysfunction is a major barrier to achieving lasting remission in hematologic cancers, especially in chronic lymphocytic leukemia (CLL). We have shown previously that Δ133p53α, an endogenous isoform of the human TP53 gene, decreases in expression with age in human T cells, and that reconstitution of Δ133p53α in poorly functional T cells can rescue proliferation [A. M. Mondal et al., J. Clin. Invest. 123, 5247-5257 (2013)]. Although Δ133p53α lacks a transactivation domain, it can form heterooligomers with full-length p53 and modulate the p53-mediated stress response [I. Horikawa et al., Cell Death Differ. 24, 1017-1028 (2017)]. Here, we show that constitutive expression of Δ133p53α potentiates the anti-tumor activity of CD19-directed CAR T cells and limits dysfunction under conditions of high tumor burden and metabolic stress. We demonstrate that Δ133p53α-expressing CAR T cells exhibit a robust metabolic phenotype, maintaining the ability to execute effector functions and continue proliferating under nutrient-limiting conditions, in part due to upregulation of critical biosynthetic processes and improved mitochondrial function. Importantly, we show that our strategy to constitutively express Δ133p53α improves the anti-tumor efficacy of CAR T cells generated from CLL patients that previously failed CAR T cell therapy. More broadly, our results point to the potential role of the p53-mediated stress response in limiting the prolonged antitumor functions required for complete tumor clearance in patients with high disease burden, suggesting that modulation of the p53 signaling network with Δ133p53α may represent a translationally viable strategy for improving CAR T cell therapy.

Keywords: T cell; cancer therapy; senescence.


Conflict of interest statement

Competing interests statement:C.H.J. is an inventor of patents related to the CAR therapy product which is the subject of this paper, as well as other CAR therapy products, and may be eligible to receive a select portion of royalties paid from Kite to the University of Pennsylvania. C.H.J. is a scientific co-founder and holds equity in Capstan Therapeutics, Dispatch Biotherapeutics and Bluewhale Bio. C.H.J. serves on the board of AC Immune and is a scientific advisor to BluesphereBio, Cabaletta, Carisma, Cartography, Cellares, Cellcarta, Celldex, Danaher, Decheng, ImmuneSensor, Kite, Marble Therapeutics, Poseida, Verismo, Viracta, and WIRB-Copernicus group. C.H.J., R.M.Y., and J.S. are inventors on patents and/or patent applications licensed to Novartis Institutes of Biomedical Research and Kite and may receive license revenue from such licenses. R.O.C. is an inventor on patents licensed to Novartis of Biomedical Research and has equity in Nucleus Biologics and Stoic Bio. R.O.C. is also a scientific advisor to Nucleus Biologics. C.R. consults for Marble Therapeutics and is a scientific advisor to Boston Labs.

Figures

Fig. 1.
Fig. 1.
Δ133p53α-CAR T cells improve in vitro cytotoxicity and proliferation during high tumor burden conditions. (A) Schematic of human full-length p53 (p53FL) and Δ133p53α. TAD, transactivation domain; PRD, proline-rich domain; NLS, nuclear localization signal; OD, oligomerization domain; BR, basic region. (B) CAR expression vectors for Δ133p53α-expressing and WT, mCherry-expressing CARs. TM, transmembrane domain; WT, wild type. (C) Western blot for Δ133p53α expression in Δ133p53α CAR T cells and WT CAR T cells at day 10 of primary expansion from two normal donors. Δ133, Δ133p53α. (D) Schematic outlining in vitro co-culture assay setup and accompanying tumor and T cell measurements. Representative images show GFP+ tumor cells (Nalm6-GFP) and corresponding segmented images used for quantification by Celigo software. Live cells are identified by detection of fluorescent calcein AM violet, with total T cells being calculated by subtracting the number of GFP+ cells from the total number of live cells. Representative images showing segmentation and counting performed by Celigo software are shown. (E) Tumor measurements over time from in vitro co-culture assay described in D from six separate normal donors. Co-cultures were run at 5 effector to target ratios, indicated by the number over each graph. Data are mean ± SEM. Statistical significance was assessed using a two-way ANOVA, with reported values representing the interacting term of CAR treatment over time. (F) T cell proliferation during tumor co-culture from the same experiments shown in E. Data are from replicate experiments with six healthy donors. Statistical significance was assessed using a two-way ANOVA, with reported values representing the interacting term of CAR treatment over time. (G) Representative untransduced T cells co-cultured with Nalm6-GFP tumor cells, included as a negative control. (H) Ratio between maximum proliferation of Δ133p53α-CARs and wild-type CARs at each effector to target ratio. Maximum proliferation for each condition was determined as the maximum fold-change from baseline CAR T cells. Statistical significance was calculated using multiple t tests. (I) Cytokine secretion at 24-h time point of in vitro co-culture at 1 to 7.5 effector to target ratio. (J) Proportion of CAR+CD8+ T cells in each comparator group for each healthy donor used for data generated in EH. Statistical significance for I and J was assessed using paired t tests. ns = not significant, *P 0.05, **P 0.01, ***P 0.001, ****P 0.0001.
Fig. 2.
Fig. 2.
Δ133-CAR T cells exhibit superior tumor clearance in a B cell leukemia xenograft mouse model. (A) NSG mice were injected intravenously with 1 × 10⁶ Nalm6 leukemia cells transduced with GFP-P2A-CBG on day 0. Mice were imaged on day 6 and randomized into three groups, including both treatment groups and an untransduced T cell control. Either 1 × 10⁶ freshly thawed CAR+ T cells or a matched total number of untransduced T cells were injected intravenously on day 7. (B) Tumor progression for mice administered CARs from three healthy donors was monitored using bioluminescent imaging. Data are mean ± SEM of n = 8 to 11 mice depending on the donor. In each graph, data are reported up to the timepoint when the first mouse was lost in the WT or Δ133-CAR group. Statistical significance was determined via two-way ANOVA and is based on the CAR treatment X time interaction term. (C) Time course of tumor progression in individual mice across three experiments shown in B. Statistical significance was determined via two-way ANOVA and is based on the CAR treatment X time interaction term. (D) T cell engraftment on day 12 after injection. Statistical significance was calculated using an unpaired t test. Data not shown for ND451 and ND512 due to sample mishandling preventing measurement at day 12. (E) Kaplan–Meier curves of mice pooled from all experiments showing survival of each group over time. Data were analyzed using a log rank Mantel–Cox test. (F) CD19-directed CAR expression vector with CD28 co-stimulatory domain used in GI. (G) Tumor progression for mice administered hCD19.28z CARs. Data represent tumor progression for each individual mouse. Statistical significance was determined via two-way ANOVA and is based on the CAR treatment X time interaction term. (H) T cell engraftment at initial bleed measurement. Statistical significance was calculated using an unpaired t test. (I) Kaplan–Meier curves showing survival of each group of mice over time. Data were analyzed using a log rank Mantel–Cox test. ns = not significant, *P 0.05, **P 0.01, ***P 0.001, ****P 0.0001.
Fig. 3.
Fig. 3.
Transcriptomic analysis of Δ133-CAR T cells under stress reveals differences in transcription of p53 targets and key metabolic genes. (A) Schematic of sample generation for RNAseq analysis. CAR+ T cells were isolated prior to co-culture (day 0) and again mid-coculture, approximately 8 h prior to day 4 measurement. CAR T cells from the same three healthy donors were used for both isolations. (B) Tumor co-culture experiment used to generate CARs for RNAseq analysis. An effector to target ratio of 1 to 10 was used. Each data point represents the mean ± SEM of two technical replicates for each healthy donor. Statistical significance was determined via two-way ANOVA and is based on the CAR treatment X time interaction term. (C) Volcano plot showing differentially expressed genes in WT CAR T cells and Δ133-CAR T cells isolated mid-coculture. All genes with an adjusted P-value ≤ 0.05 are colored either red or blue, if upregulated in WT or Δ133-CARs, respectively. (D) Summary of results for GSEA of all Hallmark and GO Biological Process gene sets. For Δ133-CARs, only the top 20 of the 80 gene sets with FDR < 0.1, ranked by normalized enrichment score are shown. (E) Additional gene sets identified during targeted GSEA for metabolic gene sets relevant for CAR T cell function. (F) Additional gene sets identified during targeted GSEA for p53 transcriptional activity. (G) Heatmap of individual genes from gene sets in E and F with adjusted P-values ≤ 0.05. Corresponding gene sets for each gene are highlighted in vertical text. (H) Phospho-p53 (Serine 15) staining of CAR T cells on day 3 of tumor co-culture for two healthy donors measured by flow cytometry. (I) Oxygen consumption rate (OCR) as measured by Seahorse extracellular flux analysis. Each of the three healthy donors was evaluated following tumor co-culture. Data points for each time series represent mean oxygen consumption rate ± SEM for eight replicates. Statistical significance was determined using multiple unpaired t tests for each time point. ns = not significant, *P 0.05, **P 0.01, ***P 0.001, ****P 0.0001.
Fig. 4.
Fig. 4.
Δ133p53α expression in non-responding leukemia patient CAR T cells improves in vitro and in vivo efficacy. (A) Table outlining CLL patient T cells used for CAR manufacturing alongside clinical response to initial CD19-directed CAR T cell therapy. (B) In vitro tumor co-culture data for CR-47. Data shown are for an effector to target ratio of 1 to 12.5, with the timing of fresh tumor stimulations indicated by arrows. For each tumor restimulation, the number of CARs was normalized between treatment groups prior to tumor addition. Data are mean ± SEM of two technical replicates. (C) Ratio of population doublings between Δ133-CARs and WT CARs at the end of each tumor stimulation for CR-47. (D) Pooled tumor measurements over time from in vitro co-culture from NR-12 and NR-20. Co-cultures were run at 5 effector to target ratios, as indicated by the number over each graph. Data are mean ± SEM. Statistical significance was assessed using a two-way ANOVA, with reported values representing the interacting term of CAR treatment over time. (E) Oxygen consumption rate as measured by Seahorse extracellular flux analysis following co-culture at 1 to 4 E:T ratio. Data points for each time series represent mean oxygen consumption rate ± SEM for eight replicates. Statistical significance was determined using multiple unpaired t tests for each time point. (F) Surface PD1 staining of CAR T cells from NR-12 on day 5 of tumor co-culture at an effector to target ratio of 1 to 8 measured by flow cytometry. (G) NSG mice were injected intravenously with 1 × 10⁶ Nalm6 leukemia cells transduced with GFP-P2A-CBG on day 0. Mice were imaged on day 3 and randomized into three groups, including both treatment groups and a PBS control. Then, 1.5 × 10⁶ freshly thawed CAR+ T cells were injected intravenously on day 4. (H) Tumor progression for mice administered CARs from NR-12 monitored using bioluminescent imaging. Data are mean ± SEM of n = 8 mice. Statistical significance was determined via two-way ANOVA and is based on the CAR treatment X time interaction term. (I) Tumor progression for mice administered CARs from patient NR-20 monitored using bioluminescent imaging. Data are mean ± SEM of n = 8 mice. Statistical significance was determined via two-way ANOVA and is based on the CAR treatment X time interaction term. (J) T cell engraftment 1-week post-CAR injection for NR-12 and NR-20. Statistical significance was determined using a paired t test. (K) Kaplan–Meier curves showing survival of mice from both NR-12 and NR-20 over time. Data were analyzed using a log rank Mantel–Cox test. ns = not significant, *P 0.05, **P 0.01, ***P 0.001, ****P 0.0001.

Comment in

Similar articles

Cited by

References

    1. Kalos M., et al. , T cells with chimeric antigen receptors have potent antitumor effects and can establish memory in patients with advanced leukemia. Sci. Transl. Med. 3, 95ra73 (2011). - PMC - PubMed
    1. Maude S. L., et al. , Chimeric antigen receptor T cells for sustained remissions in leukemia. N. Engl. J. Med. 371, 1507–1517 (2014). - PMC - PubMed
    1. Melenhorst J. J., et al. , Decade-long leukaemia remissions with persistence of CD4+ CAR T cells. Nature 602, 503–509 (2022). - PMC - PubMed
    1. Porter D. L., et al. , Chimeric antigen receptor T cells persist and induce sustained remissions in relapsed refractory chronic lymphocytic leukemia. Sci. Trans. Med. 7, 303ra139 (2015). - PMC - PubMed
    1. Lamble A. J., et al. , Preinfusion factors impacting relapse immunophenotype following CD19 CAR T cells. Blood Adv. 7, 575–585 (2023). - PMC - PubMed

MeSH terms

Substances