Structures of AT8 and PHF1 phosphomimetic tau: Insights into the posttranslational modification code of tau aggregation
- PMID: 38408247
- PMCID: PMC10927509
- DOI: 10.1073/pnas.2316175121
Structures of AT8 and PHF1 phosphomimetic tau: Insights into the posttranslational modification code of tau aggregation
Abstract
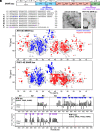
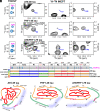
The microtubule-associated protein tau aggregates into amyloid fibrils in Alzheimer's disease and other neurodegenerative diseases. In these tauopathies, tau is hyperphosphorylated, suggesting that this posttranslational modification (PTM) may induce tau aggregation. Tau is also phosphorylated in normal developing brains. To investigate how tau phosphorylation induces amyloid fibrils, here we report the atomic structures of two phosphomimetic full-length tau fibrils assembled without anionic cofactors. We mutated key Ser and Thr residues to Glu in two regions of the protein. One construct contains three Glu mutations at the epitope of the anti-phospho-tau antibody AT8 (AT8-3E tau), whereas the other construct contains four Glu mutations at the epitope of the antibody PHF1 (PHF1-4E tau). Solid-state NMR data show that both phosphomimetic tau mutants form homogeneous fibrils with a single set of chemical shifts. The AT8-3E tau rigid core extends from the R3 repeat to the C terminus, whereas the PHF1-4E tau rigid core spans R2, R3, and R4 repeats. Cryoelectron microscopy data show that AT8-3E tau forms a triangular multi-layered core, whereas PHF1-4E tau forms a triple-stranded core. Interestingly, a construct combining all seven Glu mutations exhibits the same conformation as PHF1-4E tau. Scalar-coupled NMR data additionally reveal the dynamics and shape of the fuzzy coat surrounding the rigid cores. These results demonstrate that specific PTMs induce structurally specific tau aggregates, and the phosphorylation code of tau contains redundancy.
Keywords: Alzheimer’s disease; helical reconstruction; magic-angle spinning; phosphorylation; solid-state NMR.
Conflict of interest statement
Competing interests statement:The authors declare no competing interest.
Figures


Similar articles
-
Structures of ΔD421 Truncated Tau Fibrils.J Mol Biol. 2025 May 15;437(10):169051. doi: 10.1016/j.jmb.2025.169051. Epub 2025 Feb 26. J Mol Biol. 2025. PMID: 40021051
-
Proline-directed pseudo-phosphorylation at AT8 and PHF1 epitopes induces a compaction of the paperclip folding of Tau and generates a pathological (MC-1) conformation.J Biol Chem. 2008 Nov 14;283(46):32066-76. doi: 10.1074/jbc.M805300200. Epub 2008 Aug 25. J Biol Chem. 2008. PMID: 18725412
-
Impact of Lysine Acetylation Mutations on the Structure of Full-Length Tau Fibrils.ACS Chem Neurosci. 2025 Jul 16;16(14):2617-2628. doi: 10.1021/acschemneuro.5c00149. Epub 2025 Jul 2. ACS Chem Neurosci. 2025. PMID: 40599054
-
Amyloidogenesis of Tau protein.Protein Sci. 2017 Nov;26(11):2126-2150. doi: 10.1002/pro.3275. Epub 2017 Sep 13. Protein Sci. 2017. PMID: 28833749 Free PMC article. Review.
-
Degradation or aggregation: the ramifications of post-translational modifications on tau.BMB Rep. 2018 Jun;51(6):265-273. doi: 10.5483/bmbrep.2018.51.6.077. BMB Rep. 2018. PMID: 29661268 Free PMC article. Review.
Cited by
-
Inducers and modulators of protein aggregation in Alzheimer's disease - Critical tools for understanding the foundations of aggregate structures.Neurotherapeutics. 2025 Apr;22(3):e00512. doi: 10.1016/j.neurot.2024.e00512. Epub 2025 Jan 3. Neurotherapeutics. 2025. PMID: 39755501 Free PMC article. Review.
-
Pseudo-Phosphorylated Tau Forms Paired Helical Filaments in the Presence of High-Curvature Cholesterol-Containing Lipid Membranes.J Am Chem Soc. 2025 Jan 22;147(3):2510-2522. doi: 10.1021/jacs.4c13772. Epub 2025 Jan 9. J Am Chem Soc. 2025. PMID: 39782001 Free PMC article.
-
Cryo-EM and solid state NMR together provide a more comprehensive structural investigation of protein fibrils.Protein Sci. 2024 Oct;33(10):e5168. doi: 10.1002/pro.5168. Protein Sci. 2024. PMID: 39276003
-
Circadian timing and entrainment properties of the SCN pacemaker in the PS19 mouse model of tau pathology.bioRxiv [Preprint]. 2025 Jun 8:2025.06.06.655835. doi: 10.1101/2025.06.06.655835. bioRxiv. 2025. PMID: 40642115 Free PMC article. Preprint.
-
Phosphoryl group wires stabilize pathological tau fibrils as revealed by multiple quantum spin counting NMR.bioRxiv [Preprint]. 2024 Aug 17:2024.08.14.606685. doi: 10.1101/2024.08.14.606685. bioRxiv. 2024. PMID: 39185239 Free PMC article. Preprint.
References
-
- Wang Y., Mandelkow E., Tau in physiology and pathology. Nat. Rev. Neurosci. 17, 5–21 (2016). - PubMed
-
- Ballatore C., Lee V. M., Trojanowski J. Q., Tau-mediated neurodegeneration in Alzheimer’s disease and related disorders. Nat. Rev. Neurosci. 8, 663–672 (2007). - PubMed
-
- Braak H., Thal D. R., Ghebremedhin E., Del Tredici K., Stages of the pathologic process in Alzheimer disease: Age categories from 1 to 100 years. J. Neuropathol. Exp. Neurol. 70, 960–969 (2011). - PubMed
-
- Braak H., Braak E., Neuropathological stageing of Alzheimer-related changes. Acta Neuropathol. 82, 239–259 (1991). - PubMed
MeSH terms
Substances
Grants and funding
LinkOut - more resources
Full Text Sources
Medical
Miscellaneous

