. 2024 Apr;628(8007):391-399.
doi: 10.1038/s41586-024-07204-7. Epub 2024 Feb 26.

A patterned human neural tube model using microfluidic gradients

Affiliations

A patterned human neural tube model using microfluidic gradients

Xufeng Xue et al. Nature. 2024 Apr.

Abstract

The human nervous system is a highly complex but organized organ. The foundation of its complexity and organization is laid down during regional patterning of the neural tube, the embryonic precursor to the human nervous system. Historically, studies of neural tube patterning have relied on animal models to uncover underlying principles. Recently, models of neurodevelopment based on human pluripotent stem cells, including neural organoids1-5 and bioengineered neural tube development models6-10, have emerged. However, such models fail to recapitulate neural patterning along both rostral-caudal and dorsal-ventral axes in a three-dimensional tubular geometry, a hallmark of neural tube development. Here we report a human pluripotent stem cell-based, microfluidic neural tube-like structure, the development of which recapitulates several crucial aspects of neural patterning in brain and spinal cord regions and along rostral-caudal and dorsal-ventral axes. This structure was utilized for studying neuronal lineage development, which revealed pre-patterning of axial identities of neural crest progenitors and functional roles of neuromesodermal progenitors and the caudal gene CDX2 in spinal cord and trunk neural crest development. We further developed dorsal-ventral patterned microfluidic forebrain-like structures with spatially segregated dorsal and ventral regions and layered apicobasal cellular organizations that mimic development of the human forebrain pallium and subpallium, respectively. Together, these microfluidics-based neurodevelopment models provide three-dimensional lumenal tissue architectures with in vivo-like spatiotemporal cell differentiation and organization, which will facilitate the study of human neurodevelopment and disease.


Figures

Extended Data Figure 1.
Extended Data Figure 1.. Development of R-C patterned μNTLS.
a. (Left) Side view of a Carnegie Stage (CS) 12 human embryo, showing its head-to-tail length of about 4 mm. Image reproduced from Reference. During human embryogenesis, both rostral and caudal neuropores close at around CS12, leading to a completely closed NT structure at around CS12. (Right) Transverse sectional image of a CS12 human embryo through somite 3, marked by the dashed red line shown on the left. Image reproduced from Endowment for the Human Development website, with permission from Dr. Raymond Gasser. Height of NT along the D-V axis is about 200 μm. b. Schematic of microfluidic device, containing top, central, and bottom microchannels, with both ends of each channel connected with medium reservoirs. In the device center marked by a red rectangle, the three channels are separated by two linear arrays of circular support posts, which defines a patterning region in the central channel marked by a dashed red rectangle. Within the patterning region, stable gradients of chemical signals are established along the length of the central channel (R-C axis) by supplementing different concentrations of chemical factors in the two reservoirs of the central channel. Similarly, through passive diffusion from the top and bottom channels, stable gradients of dorsalizing and ventralizing factors are established perpendicular to the central channel (D-V axis). In the schematic, an array of rectangular colonies of hPSCs is formed in the patterning region. c. Microfluidic device design. All microchannels have a height of 150 μm. Central channel has a width of 4 mm. Circular support posts have a diameter of 100 μm and an edge-to-edge distance of 50 μm. Patterning region in the central channel is defined by a 4 mm × 4 mm square as indicated in b. d. Photograph showing microfluidic devices generated through batch fabrication. e. Schematics and brightfield and confocal images showing microcontact printing to generate rectangular Geltrex adhesive islands, microfluidic device assembly, cell and gel loading into the device, and lumenogenesis of hPSC colonies to form μNTLS. Specifically, rectangular Geltrex adhesive islands (length: 4 mm; width: 100 μm) are printed onto a coverslip using microcontact printing with a polydimethylsiloxane (PDMS) stamp. A PDMS structural layer is then attached onto the coverslip with Geltrex islands aligned with the patterning region of the central channel. On Day 0, dissociated single hPSCs are loaded into the central channel and allowed to adhere to Geltrex islands. One hour after cell seeding, floating hPSCs not attached to Geltrex islands are flushed away gently. On Day 1, 100% Geltrex is loaded into the central channel, and a neural induction medium (NIM), comprising basal medium and dual SMAD inhibitors (DSi; see Methods 1), is added into the two medium reservoirs of the central channel. Colonies of hPSCs self-organize and undergo lumenogenesis, with small lumens, demarcated by ZO-1, emerging on Day 2 (see Supplementary Video 1). These lumens grow over time and coalesce with each other. By Day 3, hPSC colonies, which still express OCT4, form an elongated tubular structure containing a single continuous, central apical lumen. Zoom-in views of some marked regions are provided. Arrowheads mark small apical lumens demarcated by ZO-1. f. Protocol for generating R-C patterned μNTLS. hPSCs are seeded into the central channel on Day 0 using mTeSR (Step 1). After gel loading on Day 1, culture medium in the central channel is switched to NIM (Step 2). From Day 2 to Day 5, CHIR99021 (CHIR, 3 μM), FGF8 (200 ng mL−1) and retinoic acid (RA, 500 nM) are added into the right reservoir of the central channel in addition to NIM (Step 3). From Day 5 to Day 7, all caudalizing factors are removed, and only NIM is added into the two medium reservoirs of the central channel (Step 4). g. Representative brightfield images showing a single μNTLS on different days as indicated. Zoom-in views of a marked region are provided. h. Representative stitched confocal images showing an array of R-C patterned μNTLS on Day 7 from a single microfluidic device stained for HOXB1, HOXB4, and HOXC9. i. Intensity maps showing relative mean expression levels of indicated markers as a function of relative R-C position in R-C patterned μNTLS on Day 7. nOTX2 = 12, nHOXB1 = 22, nHOXB4 = 22, nHOXC9 = 12, and nexperiment = 3. j. (Left) Protocol for generating μNTLS with a default dorsal forebrain identity. hPSCs are seeded into the central channel on Day 0 using mTeSR (Step 1). After gel loading on Day 1, culture medium is switched to NIM from Day 1 onwards (Step 2). μNTLS are analyzed on Day 7. (Right) Representative stitched confocal micrographs showing μNTLS on Day 7 stained for ZO-1, PAX6, OTX2, and EdU, as indicated. Micrographs on the right show y-z planes of selected regions in μNTLS. k. Representative confocal micrographs showing x-y and y-z planes of selected regions in R-C patterned μNTLS on Day 7 stained for ZO-1, ADP-ribosylation factor-like protein 13B (ARL 13B), EdU, and phospho-histone H3 (pH3), respectively. Arrowheads mark ARL 13B-enriched cilia on μNTLS apical surfaces. l. Schematic showing dissection of R-C patterned μNTLS on Day 7 using a surgical scissor into four tissue segments of equal lengths for downstream RT-qPCR analysis. m. Dorsal view of human NT and expression pattern of HOX family genes in HB and SC. Color coding of HOX family genes represents their expression domains along the R-C axis of NT. n. Heatmaps showing normalized expression of HOX family genes as a function of the four segments of Day 7 R-C patterned μNTLS. n = 3 experiments. In e, h, j and k, nuclei were counterstained with DAPI. In e, g, h, j and k, experiments are repeated three times with similar results. Scale bars, 1 mm (side view image in a), 200 μm (transverse section image in a), 15 mm (d), 1 mm (whole μNTLS array images in e), 50 μm (zoom-in images in e), 800 μm (g and h), 400 μm (j), and 150 μm (k).
Extended Data Figure 2.
Extended Data Figure 2.. Effect of morphogen dosages on R-C patterning of μNTLS.
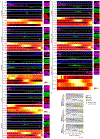
a. Representative stitched confocal micrographs showing R-C patterned μNTLS on Day 7 under different concentrations of CHIR as indicated, stained for OTX2, HOXB1, HOXB4, and HOXC9. Concentrations of RA and FGF8 were kept the same as 500 nM and 200 ng mL−1, respectively. Zoom-in views of boxed regions are shown on the right. Intensity maps depict relative mean values of indicated markers as a function of relative R-C position in μNTLS. For 1.5 μM CHIR, nOTX2 = 12, nHOXB1 = 30, nHOXB4 = 30, nHOXC9 = 18, and nexperiment = 3; For 3 μM CHIR, nOTX2 = 12, nHOXB1 = 22, nHOXB4 = 22, nHOXC9 = 12, and nexperiment = 3; For 4.5 μM CHIR, nOTX2 = 14, nHOXB1 = 28, nHOXB4 = 28, nHOXC9 = 14, and nexperiment = 3. b. Representative stitched confocal micrographs showing R-C patterned μNTLS on Day 7 under different concentrations of FGF8 as indicated, stained for OTX2, HOXB1, HOXB4, and HOXC9. Concentrations of CHIR and RA were kept the same as 3 μM and 500 nM, respectively. Zoom-in views of boxed regions are shown on the right. Intensity maps depict relative mean values of indicated markers as a function of relative R-C position in μNTLS. For without FGF8, nOTX2 = 13, nHOXB1 = 25, nHOXB4 = 25, nHOXC9 = 12, and nexperiment = 3; For 200 ng mL−1 FGF8, nOTX2 = 12, nHOXB1 = 22, nHOXB4 = 22, nHOXC9 = 12, and nexperiment = 3; For 400 ng mL−1 FGF8, nOTX2 = 10, nHOXB1 = 20, nHOXB4 = 20, nHOXC9 = 10, and nexperiment = 2. c. Representative stitched confocal micrographs showing R-C patterned μNTLS on Day 7 treated with or without RA as indicated, stained for OTX2, HOXB1, HOXB4, and HOXC9. Concentrations of CHIR and FGF8 were kept the same as 3 μM and 200 ng mL−1, respectively. Zoom-in views of boxed regions are shown on the right. Intensity maps depict relative mean values of indicated markers as a function of relative R-C position in μNTLS. For without RA, nOTX2 = 14, nHOXB1 = 39, nHOXB4 = 39, nHOXC9 = 25, and nexperiment = 3; For 500 nM RA, nOTX2 = 12, nHOXB1 = 22, nHOXB4 = 22, nHOXC9 = 12, and nexperiment = 3. d. Plot showing relative R-C positions of OTX2+, HOXB1+, HOXB4+, and HOXC9+ domains in R-C patterned μNTLS on Day 7 under indicated conditions. Rostral and caudal ends of μNTLS are designated as 0 and 1, respectively. Error bars represent mean ± SEM. n values are provided in a-c. In a-c, nuclei were counterstained with DAPI. Scale bars, 400 μm.
Extended Data Figure 3.
Extended Data Figure 3.. Dynamic HOX gene expression in R-C patterned μNTLS.
a. Representative stitched confocal micrographs showing μNTLS on different days developed under default caudalizing condition (3 μM CHIR, 500 nM RA, and 200ng mL−1 FGF8) stained for OTX2 and HOXB1, HOXB1, HOXB4, and HOXC9, and OCT4 and SOX2, respectively. Zoom-in views of boxed regions are shown on the right. Arrowheads mark nuclear staining of HOXB4 in Day 6 μNTLS. Intensity maps depict relative mean expression levels of indicated markers as a function of relative R-C position in μNTLS. For intensity maps, on Day 3, nOTX2 = 15, nHOXB1 = 15, and nexperiment = 3; on Day 4, nOTX2 = 15, nHOXB1 = 15, and nexperiment = 3; on Day 5, nOTX2 = 10, nHOXB1 = 31, nHOXC9 = 21, and nexperiment = 3; on Day 6, nOTX2 = 13, nHOXB1 = 23, nHOXB4 = 11, nHOXC9 = 27, and nexperiment = 3; on Day 7, nOTX2 = 12, nHOXB1 = 22, nHOXB4 = 22, nHOXC9 = 12, and nexperiment = 3. b. Plots showing expression levels of OCT4, NANOG, SOX1/2, and PAX6 in R-C patterned μNTLS as a function of time. Error bars represent mean ± SEM. nexperiment = 4 for OCT4, NANOG, SOX1/2, and PAX6. One-way ANOVA tests were performed, followed by Tukey’s multiple comparison tests to calculate p values. c. Representative stitched confocal micrographs showing μNTLS development under high RA condition (3 μM CHIR, 2,000 nM RA, and 200 ng mL−1 FGF8) on different days stained for HOXB1, HOXB4, and HOXC9. Zoom-in views of boxed regions are shown on the right. Intensity maps depict relative mean expression levels of indicated markers as a function of relative R-C position in μNTLS. For intensity maps, on Day 4, nHOXB1 = 14 and nexperiment = 3; on Day 5, nHOXB1 = 13, nHOXB4 = 13, and nexperiment = 3; on Day 6, nHOXB1 = 9, nHOXB4 = 9, nHOXC9 = 9, and nexperiment = 3; on Day 7, nHOXB1 = 9, nHOXB4 = 12, nHOXC9 = 15, and nexperiment = 3. d. Plots showing relative R-C positions of OTX2+, HOXB1+, HOXB4+, and HOXC9+ domains in R-C patterned μNTLS under default (left) and high RA (right) conditions as a function of time. Rostral and caudal ends of μNTLS are designated as 0 and 1, respectively. Error bars represent mean ± SEM. n values are provided in a & c. In a and c, nuclei were counterstained with DAPI. Scale bars, 400 μm.
Extended Data Figure 4.
Extended Data Figure 4.. Development of neuromesodermal progenitors (NMPs) and secondary organizers in R-C patterned μNTLS.
a. Representative stitched confocal micrographs showing μNTLS on different days stained for SOX2, CDX2, and BRACHYURY (BRA). Zoom-in views of μNTLS caudal ends are shown on the right, with arrowheads marking SOX2+BRA+ NMPs. Intensity maps depict relative mean expression levels of indicated markers as a function of relative R-C position in μNTLS. ncolony =15, 20, 14, and 14 for Day 3, Day 4, Day 5, and Day 6, respectively. nexperiment = 3. b. Plot showing relative R-C positions of CDX2+ and BRA+ domains in μNTLS as a function of time. Rostral and caudal ends of μNTLS are designated as 0 and 1, respectively. Error bars represent mean ± SEM. n values are provided in a. c. Live imaging with a BRACHYURY-mNeonGreen hESC reporter line to track dynamic BRACHYURY expression at μNTLS caudal ends. Arrowheads mark BRACHYURY-mNeonGreen+ cells. Experiments were repeated three times with similar results. See Supplementary Video 3. d. Protocols for deriving presomitic mesodermal (PSM) and motor neuron progenitor (pMN) cells from cells isolated from caudal ends of Day 4 μNTLS. Caudal regions of Day 4 μNTLS were physically dissected using a surgical scissor and were re-plated and cultured under PSM or pMN differentiation protocols for another 4 days as indicated. For PSM differentiation, basal medium (BM) is supplemented with CHIR (3 μM) and LDN (500 nM). For pMN differentiation, BM is supplemented with Smoothened Agonist (SAG, SHH agonist; 1 μM) and RA (1 μM). e. Representative confocal micrographs showing cell colonies after 4 days of culture under PSM or pMN differentiation protocols as indicated. Cells were stained for PSM marker TBX6 and pMN marker OLIG2. Experiments were repeated three times with similar results. f. RT-qPCR analysis of caudal regions of Day 4 R-C patterned μNTLS, which contain NMPs, and cells cultured for 4 days under either PSM differentiation protocol (PSM protocol) or pMN differentiation protocol (pMN protocol). Heatmaps show normalized expression of NMP, PSM, and pMN markers as indicated. n = 4 experiments. g. Schematic showing generation of a TBXT::T2A-Cre lineage tracer cell hESC line. h. (Top) Protocol for deriving NMPs from TBXT::T2A-Cre lineage tracer cells followed by pMN induction. TBXT::T2A-Cre lineage tracer cells were seeded as single cells onto culture dishes at a density of 1.5 × 10⁴ cells cm−2 in mTeSR containing Y27632 (10 μM). Culture medium was switched to basal medium supplemented with CHIR (3 μM) and FGF8 (200 ng mL−1) from Day 1 to Day 3 to promote NMP differentiation. From Day 3 to Day 5, culture medium was switched to basal medium supplemented with RA (500 nM) and SAG (500 nM) to induce pMN differentiation. (Bottom) Representative confocal micrographs showing cells on Day 3 stained for BRA and SOX2 and on Day 5 stained for BRA and OLIG2, respectively. Experiments were repeated three times with similar results. i. Live imaging with the TBXT::T2A-Cre lineage tracer to track dynamic NMP development at μNTLS caudal ends between Day 3 and Day 7. Experiments were repeated three times with similar results. See Supplementary Video 4. j. Representative confocal micrographs showing caudal ends of Day 7 R-C patterned μNTLS generated from the TBXT::T2A-Cre lineage tracer, stained for HOXC9. White arrowheads mark ZsGreen+HOXC9+ cells. Experiments were repeated three times with similar results. k. Plot showing relative length of ZsGreen+ domains in R-C patterned μNTLS as a function of time. Length of ZsGreen+ domain is normalized by the total length of μNTLS. Error bars represent mean ± SEM. ncolony = 9 and nexperiment = 3. One-way ANOVA tests were performed, followed by Tukey’s multiple comparison tests to calculate p values. l. Schematic showing dissection of Day 7 R-C patterned μNTLS using a surgical scissor into four tissue segments of equal lengths for downstream RT-qPCR analysis. m. Heatmaps showing normalized expression of FB, MB, HB, and MB-HB boundary markers and genes related to RA signaling, as a function of the four segments of Day 7 μNTLS. n = 3 experiments. In a, e, h and j, nuclei were counterstained with DAPI. Scale bars, 400 μm (a), 100 μm (c and e), and 50 μm (h, i and j).
Extended Data Figure 5.
Extended Data Figure 5.. Roles of CDX2 and TBXT in R-C patterning of μNTLS.
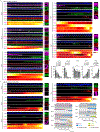
a. Representative stitched confocal micrographs showing R-C patterned μNTLS on Day 4, generated from wild type (WT) or CDX2-knockout (CDX2-KO) H9 hESC lines as indicated, stained for SOX2, CDX2, and BRACHYURY (BRA). Zoom-in views of boxed regions are shown on the right. Intensity maps depict relative mean values of indicated markers as a function of relative R-C position in μNTLS. White arrowheads mark SOX2+BRA+ NMPs. n ≥ 2 experiments for each condition. For WT, ncolony = 20 and nexperiment = 3; for CDX2-KO, ncolony = 14 and nexperiment = 2. b. Representative stitched confocal micrographs showing R-C patterned μNTLS on Day 7, generated from WT or CDX2-KO H9 hESC lines as indicated, stained for HOXB1, HOXB4, and HOXC9. Zoom-in views of boxed regions are shown on the right. Intensity maps depict relative mean values of indicated markers as a function of relative R-C position in μNTLS. n ≥ 2 experiments for each condition. For WT, nHOXB1 = 22, nHOXB4 = 22, nHOXC9 = 12, and nexperiment = 3; for CDX2-KO, nHOXB1 = nHOXB4 = nHOXC9 = 13, and nexperiment = 2. c. Plot showing relative R-C positions of BRA+ domains in Day 4 R-C patterned μNTLS and HOXB1+, HOXB4+, and HOXC9+ domains in Day 7 R-C patterned μNTLS, generated from either WT or CDX2-KO hESCs as indicated. Rostral and caudal ends of μNTLS are designated as 0 and 1, respectively. Error bars represent mean ± SEM. n values are provided in a & b. Two-sided Student's t-tests were performed to calculate p values. d. (Left) Cartoon illustrating definition of normalized contour length, calculated as the ratio between contour length and region length. (Right) Box-and-whisker plot showing normalized contour length of μNTLS generated from WT and CDX2-KO hESCs in indicated R-C regions (box: 25-75%; bar-in-box: median; whiskers: 1.5 × interquartile range). For WT, ncolony = 10 and nexperiment = 2; For CDX2-KO,, ncolony = 11 and nexperiment = 2; Two-sided Student's t-tests were performed to calculate p values. e. (Left) Protocol for clonal growth assay. Single H2B-GFP hESCs are mixed with non-fluorescent hESCs during cell seeding at a ratio of 1:200. Length of H2B-GFP cell colonies is recorded daily. (Right) Representative brightfield and fluorescence images showing clonal growth of single WT and CDX2-KO H2B-GFP hESCs in μNTLS from Day 1 to Day 6. Experiments were repeated three times with similar results. f. Box-and-whisker plot showing length of H2B-GFP cell colonies in different R-C regions of Day 6 μNTLS generated from WT and CDX2-KO hESCs (box: 25-75%; bar-in-box: median; whiskers: 1.5 × interquartile range). Only clonal growth from a single H2B-GFP hESC is included for quantification. For WT, ncolony = 10, 11, 10, and 10 for Region 1, 2, 3, and 4, respectively, and nexperiment = 2; For CDX2-KO, ncolony = 12, 11, 14, and 14 for Region 1, 2, 3, and 4, respectively, and nexperiment = 2. Two-sided Student's t-tests were performed to calculate p values. g. Representative stitched confocal micrographs showing Day 4 R-C patterned μNTLS generated from WT or TBXT-KO WIBR3 hESCs as indicated, stained for SOX2, CDX2, and BRA. Zoom-in views of boxed regions are shown on the right. Arrowheads mark SOX2+BRA+ NMPs. Intensity maps depict relative mean values of indicated markers as a function of relative R-C position in μNTLS. For WT, ncolony = 20 and nexperiment = 3; For TBXT-KO, ncolony = 18 and nexperiment = 3. h. Representative stitched confocal micrographs showing Day 7 R-C patterned μNTLS generated from WT or TBXT-KO WIBR3 hESCs as indicated, stained for HOXB1, HOXB4, and HOXC9. Zoom-in views of boxed regions are shown on the right. Intensity maps depict relative mean values of indicated markers as a function of relative R-C position in μNTLS. For WT, ncolony = 14 and nexperiment = 2; for TBXT-KO, ncolony = 12 and nexperiment = 2. i. Plot showing relative R-C positions of CDX2+ domain in Day 4 R-C patterned μNTLS and HOXB1+, HOXB4+, and HOXC9+ domains in Day 7 R-C patterned μNTLS, generated from either WT or TBXT-KO hESCs. Rostral and caudal ends of μNTLS are designated as 0 and 1, respectively. Error bars represent mean ± SEM. n values are provided in g & h. Two-sided Student's t-tests were performed to calculate p values. In a, b, g and h, nuclei were counterstained with DAPI. Scale bars, 400 μm (a, b, g and h) and 200 μm (e).
Extended Data Figure 6.
Extended Data Figure 6.. Development of region-specific μNS.
a. Protocol for generating region-specific μNS. hPSCs are seeded into the central channel on Day 0 using mTeSR (Step 1). After gel loading on Day 1, culture medium of the central channel is switched to NIM (Step 2). From Day 2 to Day 5, CHIR (3 μM), FGF8 (200 ng mL−1), and RA (500 nM) are added into the right reservoir of the central channel in addition to NIM, to induce caudalization of μNS (Step 3). From Day 5 to Day 7, all caudalizing factors are removed, and only NIM is added into the two medium reservoirs of the central channel (Step 4). Tissues are analyzed at different time points as indicated. b. Representative stitched brightfield (left) and confocal (right) micrographs showing a regular array of μNS in the patterning region on indicated days. μNS on Day 2 and Day 4 was stained for OCT4, SOX2, and ZO-1. On Day 7, they were stained for OTX2, HOXB1, and HOXB4. Zoom-in views of boxed regions are shown on the right. Experiments were repeated three times with similar results. c. Representative confocal micrographs showing μNS on Day 7 stained for PAX6, OTX2, HOXB1, HOXB4, and HOXC9 as indicated. Experiments were repeated three times with similar results. d. Pie charts showing percentages of different types of μNS at different locations of the patterning region on Day 7. n = 3 experiments. In b and c, nuclei were counterstained with DAPI. Scale bars, 400 μm (b) and 100 μm (c).
Extended Data Figure 7.
Extended Data Figure 7.. Development and characterization of R-C and D-V patterned μNTLS.
a. Protocol for generating R-C and D-V patterned μNTLS. hPSCs are seeded into the central channel on Day 0 using mTeSR (Step 1). After gel loading on Day 1, culture medium in the central channel is switched to NIM (Step 2). From Day 2 to Day 5, CHIR (3 μM), FGF8 (200 ng mL−1), and RA (500 nM) are added into the right reservoir of the central channel in addition to NIM, to induce caudalization and R-C patterning of μNTLS (Step 3). From Day 5 to Day 9, BMP4 (25 ng mL−1) and RA (500 nM) / smoothened agonist (SAG, 500 nM), unless otherwise specified, are added into the top and bottom channels, respectively, to induce D-V patterning of μNTLS. b. Representative brightfield images showing R-C and D-V patterned μNTLS on Day 9 and Day 21 as indicated. Experiments were repeated five times with similar results. c. Representative stitched confocal micrographs showing R-C and D-V patterned μNTLS on Day 9 stained for OTX2, HOXB1, HOXB4, and HOXC9. Zoom-in views of boxed regions are shown on the bottom. Experiments were repeated five times with similar results. d. Representative confocal micrographs showing transverse sections of rostral (d’) and caudal (d”) SC regions of Day 9 R-C and D-V patterned μNTLS as indicated, stained for HOXB1, HOXB4, HOXC9, SOX10, PAX3, OLIG2, NKX2.2, and FOXA2. Zoom-in views of boxed regions are included. Intensity maps depict relative mean values of indicated markers as a function of relative D-V position in μNTLS. For rostral SC regions, nPAX3 = 20, nOLIG2 = 24, and nexperiment = 5. For caudal SC regions, nPAX3 = 22, nOLIG2 = 38, and nexperiment = 5. e. Plot showing percentages of μNTLS containing a single lumen in their rostral and caudal regions on Day 9 and Day 21 as indicated. Error bars represent mean ± SEM. nexperiment = 3. f. Representative confocal micrographs showing transverse sections of rostral (f’) and caudal (f”) regions of Day 21 R-C and D-V patterned μNTLS cultured under different conditions as indicated, stained for ZO-1, PAX6, DLX2, NKX2-1, SOX10, PAX3, OLIG2, NKX2-2, and FOXA2. From Day 2 to Day 5, CHIR (3 μM), FGF8 (200 ng mL−1) and RA (500 nM) are added into the right reservoir of the central channel to induce R-C patterning of μNTLS. From Day 5 to Day 9, BMP4 (25 ng mL−1) and RA (500 nM or 2,000 nM) / smoothened agonist (SAG, 500 nM or 2,000 nM) are added into the top and bottom channels, respectively, to induce D-V patterning of μNTLS. Zoom-in views of boxed regions are included. Intensity maps depict relative mean values of indicated markers as a function of relative D-V position in μNTLS. For 2,000 nM RA / 2,000 nM SAG condition, nPAX6-rostral = 20, nDLX2 = 20, nNKX2-1 = 20, nPAX6-caudal = 21, nOLIG2 = 40, nNKX2-2 = 19, nFOXA2 = 19, and nexperiment = 5; for 500 nM RA / 500 nM SAG condition, nPAX3 = 20, nOLIG2 = 41, nNKX2-2 = 21, nFOXA2 = 21, and nexperiment = 5. In c, d, and f, nuclei were counterstained with DAPI. Scale bars, 400 μm (b and c) and 100 μm (d and f).
Extended Data Figure 8.
Extended Data Figure 8.. Characterization of μNTLS using single-cell RNA-sequencing (scRNA-seq).
a. scRNA-seq assay design. R-C patterned μNTLS on Day 4 and R-C and D-V patterned μNTLS on Day 9 and Day 21 were dissociated into single cells before the cells were sequenced using 10× Genomics and Illumina HiSeq 6000 (see Methods). Single-cell transcriptome data of Day 4, Day 9 and Day 21 μNTLS were then integrated and analyzed. The number of cells from each sample after data filtering, average UMI counts, and average detected genes are listed. b. UMAP of integrated single-cell transcriptome data of Day 4, Day 9 and Day 21 μNTLS, color-coded according to cell identity annotations (left) or time points (right). n indicates total cell number combined from all three time points. FB, forebrain; MB, midbrain; IsO, isthmic organizer; HB, hindbrain; SC, spinal cord; NMP, neuromesodermal progenitors; RP, roof plate; FP, floor plate; NC, neural crest. c. UMAP of single-cell transcriptome data of Day 4, Day 9, and Day 21 μNTLS, separated from integrated UMAP plots in b. n indicates cell numbers at each time point. d. Alluvial plot showing percentages of cells for each cell cluster in μNTLS on Day 4, Day 9, and Day 21. e. Heatmap of relative expression (Z-score) of top-20 gene signatures distinguishing each cell cluster. All genes are listed in Supplementary Table 1. f. Heatmap of average relative expression (Z-score) of selected genes among indicated cell clusters. g. Feature plots showing expression of selected genes associated with indicated cell cluster annotations in UMAP plots of integrated datasets from Day 4, Day 9, and Day 21 μNTLS.
Extended Data Figure 9.
Extended Data Figure 9.. Transcriptomic comparison between μNTLS and neural cells from human embryonic tissues.
a. (Top left) UMAP showing integrated data from Day 9 μNTLS and neural cells in Carnegie Stage (CS) 12 human embryos. (Top middle & right) UMAP plots of Day 9 μNTLS data and CS12 human neural cell data, separated from the integrated UMAP plot, as indicated. n indicates cell numbers. (Bottom) Feature plots comparing expression of key marker genes between Day 9 μNTLS and neural cells in CS12 human embryos. b. (Top) UMAP plots of Neuron clusters in Day 9 μNTLS and CS12 human embryo datasets. Neuron cluster in Day 9 μNTLS dataset is projected onto the Neuron cluster in CS12 human embryo dataset and is annotated following the human reference data (see Methods). n indicates cell numbers. (Bottom) Feature Plots comparing expression of key marker genes between Neuron clusters in Day 9 μNTLS and CS12 human embryos. c. (Top left) UMAP showing integrated data from Day 21 μNTLS and neural cells in CS15-16 human embryos. (Top middle & right) UMAP plots of Day 21 μNTLS data and CS15-16 human neural cells, separated from the integrated UMAP plot, as indicated. n indicates cell numbers. (Bottom) Feature plots compare expression of key marker genes between Day 21 μNTLS and neural cells in CS15-16 embryos. d. (Top) UMAP plots of Neuron clusters in Day 21 μNTLS and CS15-16 human embryo datasets. Neuron cluster in Day 21 μNTLS dataset is projected onto the Neuron cluster in CS15-16 human embryo dataset and is annotated following the human reference data (see Methods). n indicates cell numbers. (Bottom) Feature Plots comparing expression of key marker genes between Neuron clusters in Day 21 μNTLS and CS15-16 human embryos. e. Pearson’s correlation analysis of cell clusters in Day 9 and Day 21 μNTLS with neural clusters in CS12-16 human embryo datasets. Black boxes highlight the highest correlation coefficients in each column. Correlation coefficients between indicated μNTLS and human clusters are calculated based on variable genes identified from human neural cell clusters (Supplementary Table 1). f. Pearson’s correlation analysis of Neuron subclusters in Day 9 and Day 21 μNTLS with Neuron subclusters in CS12-16 human embryo datasets. Black boxes highlight the highest correlation coefficients in each column. Correlation coefficients between indicated μNTLS and human clusters are calculated based on variable genes identified from human neural cell clusters. g. Alluvial plots showing percentages of cells for each cell cluster in Day 9 and Day 21 μNTLS (top) and human embryos at CS12, CS13-14 and CS15-16 (bottom). h. Day 4, Day 9, and Day 21 μNTLS show closest transcriptome similarities with human neural cells at CS8-9 (Day 17-20), CS12 (Day 26-30), and CS15-16 (Day 35-42), respectively. Note that corresponding human embryo stage of Day 4 μNTLS is inferred from the comparison between Day 4 μNTLS and mouse data (See Supplementary Figures 8-10).
Extended Data Figure 10.
Extended Data Figure 10.. Analysis of Forebrain (FB) cluster and Spinal cord (SC)-related cells in μNTLS.
a. D-V patterning of FB, leading to formation of dorsal pallium and ventral subpallium domains. Pallium is marked by PAX6 and EMX2 expression, whereas subpallium is marked by NKX2-1. b. UMAP plots of FB clusters in CS15-16 human embryo data (left) and Day 21 μNTLS data (right). FB cluster in Day 21 μNTLS data is annotated following human reference data (see Methods). c. Stacked bar plots showing percentages of cells for each FB subcluster in CS15-16 human FB cluster and Day 21 μNTLS FB cluster. d. Dot plot showing expression of key marker genes across different cell subclusters in Day 21 μNTLS FB cluster and CS15-16 human embryo FB cluster as indicated. Dot sizes and colors indicate proportions of cells expressing corresponding genes and their averaged scaled values of log-transformed expression, respectively. e. Heatmap showing relative expression (Z-score) of top-30 gene signatures calculated from CS15-16 human FB cells in both CS15-16 human FB cluster and Day 21 μNTLS FB cluster as indicated. For gene signature information, see Supplementary Table 1. f. Enrichment of Gene Ontology (GO) terms in DEGs upregulated in Day 21 μNTLS FB cells or CS15-16 human FB cells as indicated. For detailed information about DEGs and GO terms, see Supplementary Table 1. g. In vivo, dorsal SC gives rise to roof plate (RP) and six neuronal progenitor domains (dp1-dp6), whereas ventral SC generates floor plate (FP) and five neuronal progenitor domains (pMN and p0-p3). These domains express distinct combinations of transcription factors. Markers listed on the right for each domain are identified from scRNA-seq data of mouse SC between E9.5 - E13.5. h. UMAP of SC-related cells from integrated dataset of Day 4, Day 9, and Day 21 μNTLS, color-coded according to time points (left) or subcluster identity annotations (right). n indicates cell number. Note that cells from SC cluster as well as those from RP and FP clusters that express HOX4-13 genes have been included in analyses in h-k. i. Dot plot showing expression of key marker genes across subclusters of SC-related cells as indicated. Dot sizes and colors indicate proportions of cells expressing corresponding genes and their averaged scaled values of log-transformed expression, respectively. j. Feature plots showing average expression of indicated markers associated with each SC progenitor domain in UMAP plots of SC-related cells. k. Heatmap of average relative expression (Z-score) of top-20 gene signatures distinguishing each cell subcluster in SC-related cells. For gene signature information, see Supplementary Table 1.
Extended Data Figure 11.
Extended Data Figure 11.. Characterization of neural crest (NC) development in μNTLS.
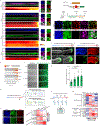
a. Representative confocal micrographs showing NC cells from R-C and D-V patterned μNTLS on Day 11 stained for PAX7, SNAI2, and SOX10. Dashed lines mark dorsal boundaries of μNTLS. Experiments were repeated twice with similar results. b. Representative confocal micrographs showing NC cells and their derivatives in rostral and caudal regions of R-C and D-V patterned μNTLS on Day 11, stained for SOX10, TWIST1, PHOX2B, ISL1, and S100B. Dashed lines mark dorsal boundaries of μNTLS. Experiments were repeated three times with similar results. c. Plots showing percentages of TWIST1+, PHOX2B+, ISL1+, and S100B+ cells among all disseminated cells in rostral and caudal halves of μNTLS. Error bar represents mean ± SEM. nTWIST1 = nPHOX2B = nISL1 = nS100B = 8 and nexperiment = 2. Two-sided Student's t-tests were performed to calculate p values. d. Protocol for generating control R-C and D-V patterned μNTLS and ectopic caudalization of μNTLS. From Day 2 to Day 5, CHIR (3 μM), FGF8 (200 ng mL−1), and RA (500 nM) are supplemented into the right reservoir of the central channel in addition to NIM to induce caudalization and R-C patterning of μNTLS. From Day 5 to Day 9, BMP4 (25 ng mL−1) and RA (500 nM) / smoothened agonist (SAG, 500 nM) are supplemented into the top and bottom channels, respectively, to induce D-V patterning of μNTLS. For ectopic caudalization of μNTLS, caudalizing factors CHIR (3 μM), FGF8 (200 ng mL−1), and RA (500 nM) are added together into the left reservoir of the center channel from Day 5 to Day 9. Culture medium in all reservoirs is then switched back to fresh basal medium (BM) from Day 9 to Day 11 to allow for further development of NC cells. e. Representative stitched confocal micrographs showing Day 5 μNTLS cultured following the protocol in d, stained for OTX2, HOXB1, and SOX10. Zoom-in views of boxed regions are shown on the right. Experiments were repeated three times with similar results. f. Live imaging with the TBXT::T2A-Cre lineage tracer to track progenies of NMPs during the development of R-C and D-V patterned μNTLS from Day 5 to Day 11 (see Supplementary Video 6). Only caudal ends of μNTLS are monitored as indicated. Dashed lines mark dorsal boundaries of μNTLS. Experiments were repeated three times with similar results. g. Representative confocal micrographs showing caudal ends of R-C and D-V patterned μNTLS generated from the TBXT::T2A-Cre lineage tracer, stained on Day 11 for SOX10, HOXC9, ISL1, and PHOX2B. Dashed lines mark dorsal boundaries of μNTLS. Zoom-in views of boxed regions are shown. White arrowheads mark ZsGreen+ NC cells, and yellow arrowheads mark ZsGreen− NC cells. Experiments were repeated twice with similar results. h. Plot showing percentages of ZsGreen+ cells among all HOXC9+ trunk NC cells, ISL1+ sensory neurons, or PHOX2B+ sympathetic neurons. nHOXC9 = 11, nISL1 = 9, nPHOX2B = 11, and nexperiment = 2. Error bars represent mean ± SEM. i. Representative confocal micrographs showing NC cells in caudal regions of R-C and D-V patterned μNTLS on Day 11 generated from wild type (WT) and CDX2-KO hESC lines, stained for indicated markers. Dashed lines mark dorsal boundaries of μNTLS. Zoom-in views of boxed regions are shown. Experiments were repeated twice with similar results. In a, b, e, g and i, nuclei were counterstained with DAPI. Scale bars, 100 μm (a, b, and i), 200 μm (e and f), and 50 μm (g).
Extended Data Figure 12.
Extended Data Figure 12.. Subclustering analysis and trajectory inference of NC cluster in μNTLS.
a. UMAP of NC cluster from integrated dataset of Day 4, Day 9, and Day 11 μNTLS, color-coded according to time points (left) or cell subcluster identity annotations (right). Seven cell subclusters are identified, including Premigratory NC (Cluster 0), Delaminating NC (Cluster 1), Schwann cell (Cluster 2), Mesenchymal cell (Cluster 3), Sensory neuron (Cluster 4), Sympathetic neuron (Cluster 5), and Melanoblast (Cluster 6). n indicates cell number. b. Dot plot showing expression of key marker genes across all NC subclusters as indicated. Dot sizes and colors indicate proportions of cells expressing corresponding genes and their averaged scaled values of log-transformed expression, respectively. c. Feature plots showing expression of selected markers associated with indicated cell subclusters in UMAP plots of NC cluster. d. Heatmap of average relative expression (Z-score) of top-20 gene signatures distinguishing each cell subcluster in NC cluster. For gene signature information, see Supplementary Table 1. e. Dot plot showing expression of HOX genes in HOX− cranial NC, HOX+ cranial NC, vagal NC, and trunk NC. HOX− cranial NC doesn’t express any HOX genes. HOX+ cranial NC expresses HOX paralogous group (PG) 1-2 but not HOX PG 3-13. Vagal NC expresses HOX PG 3-5 but not HOX PG 6-13. Trunk NC expresses HOX PG 6-9 but not HOX PG 10-13. Dot sizes and colors indicate proportions of cells expressing corresponding genes and their averaged scaled values of log-transformed expression, respectively. f. Stacked bar plot showing cellular compositions in HOX− cranial, HOX+ cranial, vagal, and trunk NC cells, as indicated. g. Dot plot comparing expression of key marker genes in HOX− cranial NC, HOX+ cranial NC, vagal NC, and trunk NC across different NC clusters as indicated. Dot sizes and colors indicate proportions of cells expressing corresponding genes and their averaged scaled values of log-transformed expression, respectively. h. UMAP of HOX− cranial NC cells separated from NC cluster shown in a, color-coded according to time points (top) or cell subcluster identity annotations (bottom). Six cell subclusters are identified, including Premigratory NC (Cluster 0), Delaminating NC (Cluster 1), Schwann cell (Cluster 2), Mesenchymal cell (Cluster 3), Sensory neuron (Cluster 4), and Melanoblast (Cluster 6). n indicates cell number. i. UMAP of cell subclusters of HOX− cranial NC cells associated with lineage developments of Schwann cell, Mesenchymal cell, Sensory neuron, and Melanoblast, color-coded according to pseudotime. Solid lines represent principal curves of each lineage. Pseudotime values are computed by projecting each single cell onto principal curves. j. Heatmap of smoothened expression of all differentially expressed genes (DEGs) along pseudotime of Schwann cell, Mesenchymal cell, Sensory neuron and Melanoblast lineage development trajectories in HOX− cranial NC cells. Selected genes are highlighted. A gene is considered significant when adjusted p-value based on FDR is < 0.05 (see Methods). For DEG information, see Supplementary Table 1.
Extended Data Figure 13.
Extended Data Figure 13.. Development of microfluidic forebrain-like structure (μFBLS).
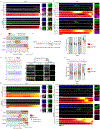
a. Transverse view of forebrain, with dorsal pallium and ventral subpallium. Both pallium and subpallium can be divided into ventricular zone (VZ), subventricular zone (SVZ) and marginal zone (MZ) from the apical to basal surface. Different domains in pallium and subpallium express distinct combinations of transcription factors as indicated. b. Protocol for generating μFBLS. hPSCs are seeded into the central channel on Day 0 using mTeSR, and Geltrex is loaded into the central channel on Day 1 to provide 3D culture environment. After gel loading on Day 1, culture medium is switched to NIM from Day 1 to Day 5 to induce neural differentiation. From Day 5 to Day 9, to generate dorsal μFBLS, NIM are added into all reservoirs connecting the three channels; to generate ventral μFBLS, smoothened agonist (SAG, 500 nM) is supplemented into NIM in all reservoirs; to generate D-V patterned μFBLS, BMP4 (25 ng mL−1) and SAG (500 nM) are supplemented into basal medium in the top and bottom channels, respectively. After regionalization of μFBLS in the microfluidic device, PDMS structural layers are detached manually from the coverslip on Day 9, with μFBLS remaining on PDMS structural layers. μFBLS on PDMS structural layers are continuously cultured in basal medium supplemented with insulin (2.5 μg mL−1) and 1% Matrigel till Day 40 (See Methods). c. (Top) Representative brightfield images showing dorsal, ventral and D-V patterned μFBLS on Day 40 as indicated. (Bottom) Box-and-whisker plots showing projected areas of dorsal (left), ventral (middle) and D-V patterned (right) μFBLS on indicated days (box: 25-75%; bar-in-box: median; whiskers: 1.5 × interquartile range). ndorsal = 12, 12, 11, and 12 on Day 22, Day 28, Day 34, and Day 40, respectively; nventral = 16, 20, 11, and 13 on Day 22, Day 28, Day 34, and Day 40, respectively; nD-V = 32, 19, 20, and 15 on Day 22, Day 28, Day 34, and Day 40, respectively. nexperiment = 3. d. Plot showing percentages of dorsal, ventral, and D-V patterned μFBLS on Day 40 with a single lumen. nexperiment = 4, 5, and 5 for dorsal, ventral, and D-V patterned μFBLS, respectively. Error bars represent mean ± SEM. e. Representative confocal micrographs showing sections of dorsal μFBLS on Day 40, stained for FOXG1, REELIN, ZO-1, PAX6, and DLX2. Experiments were repeated three times with similar results. f. Representative confocal micrographs showing sections of dorsal μFBLS on Day 40 stained for ZO-1, PAX6, TBR1/2, CTIP2, and SATB2. Experiments were repeated three times with similar results. g. Representative confocal micrographs showing sections of ventral μFBLS on Day 40, stained for FOXG1, ZO-1, ASCL1, MEIS2, and CTIP2. Experiments were repeated three times with similar results. h. Representative confocal micrographs showing sections of ventral μFBLS on Day 40, stained for GSX2, DLX2, CTIP2, ASCL1, and MEIS2. Experiments were repeated three times with similar results. i. Representative confocal micrographs showing sections of D-V patterned μFBLS on Day 40, stained for ZO-1, PAX6, TBR1, DLX2, ASCL1, CTIP2 and MEIS2. Zoom-in views of boxed regions are shown on the right. Intensity maps depict relative mean values of indicated markers as a function of relative D-V position in μFBLS. Experiments were repeated three times with similar results. In e-i, nuclei were counterstained with DAPI. Scale bars, 200 μm (c, e and i (left)), 50 μm (f and i (zoom-in images)), 100 μm (g), and 30 μm (h).
Extended Data Figure 14.
Extended Data Figure 14.. Single-cell transcriptomic analysis of D-V patterned μFBLS.
a. UMAP of single-cell transcriptome data of Day 40 D-V patterned μFBLS, color-coded according to cell identity annotations. Nine cell clusters are identified, including dorsal radial glia (dRG), ventral radial glia (vRG), outer radial glia (oRG), intermediate neural progenitor of excitatory neuron (IP-EN), intermediate neural progenitor of inhibitory neuron (IP-IN), newborn excitatory neuron (nEN), and newborn inhibitory neuron 1 / 2 / 3 (nIN1, nIN2 and nIN3). n indicates cell number. b. Feature plots showing expression of selected markers associated with indicated cell identities in UMAP plots of single-cell transcriptome data of Day 40 D-V patterned μFBLS. Zoom-in views of boxed regions are shown. Arrowheads mark cortical hem-like cells showing notable expression of RSPO2 and LMX1A. c. Principal component analysis (PCA) of pallium cells in Day 40 D-V patterned μFBLS relative to published data of pallium cells in human forebrain at different timepoints as indicated. Pallium cells in μFBLS include dRG, IP-EN, and nEN clusters isolated from D-V patterned μFBLS dataset. Reference cortical clusters expressing EMX1 are isolated from human brain datasets. d. Pearson’s correlation analysis of pallium cells (dRG, IP-EN, and nEN clusters) in Day 40 D-V patterned μFBLS with pallium cells in PCW11.5 human brain dataset. Black boxes highlight the highest correlation coefficients in each column. Original annotations of human brain cells from the reference dataset are used here (RG or radial glia / IPC or intermediate progenitor cell / Neuroblast / EN or excitatory neuron). Correlation coefficients between paired μFBLS and human clusters are calculated based on variable genes identified from human pallium cell clusters. e. Dot plot comparing expression of key marker genes in different cell clusters of Day 40 μFBLS and PCW11.5 human pallium cells as indicated. Dot sizes and colors indicate proportions of cells expressing corresponding genes and their averaged scaled values of log-transformed expression, respectively. f. Venn diagram of differentially expressed genes (DEGs) between intermediate neural progenitor cells (IPC) from Day 40 μFBLS and PCW11.5 human pallium cells, with 192 shared genes including some commonly used IPC markers (TBR2, NEUROD4 and NEUROG1). Enriched Gene Ontology (GO) terms in each compartment of the Venn diagram are shown on the right. For information about DEGs and GO terms, see Supplementary Table 1. g. Principal component analysis (PCA) of inhibitory neurons in Day 40 D-V patterned μFBLS relative to published data of inhibitory neurons from human forebrain at different timepoints as indicated. Inhibitory neurons in μFBLS include nIN1, nIN2 and nIN3 clusters isolated from D-V patterned μFBLS dataset. Inhibitory neurons from human forebrain include telencephalic clusters expressing DLX2 and are extracted from original human brain datasets. h. Pearson’s correlation analysis of inhibitory neuron clusters in Day 40 D-V patterned μFBLS with those in PCW12 human brain dataset. Original annotations of human brain cells from the references are used here (LGE or lateral ganglionic eminence; MGE or medial ganglionic eminence; CGE or caudal ganglionic eminence). Correlation coefficients between paired μFBLS and human cell clusters are calculated based on variable genes identified from human inhibitory neuron clusters. i. (Left) UMAP projection of scRNA-seq data of inhibitory neurons from Day 40 D-V patterned μFBLS (nIN1 / 2 / 3), with cell identity annotations indicated. j. Feature plots showing expression of LGE−, MGE− and CGE-associated inhibitory neuron markers in inhibitory neurons from Day 40 D-V patterned μFBLS. k. UMAP of single-cell transcriptome data of Day 40 D-V patterned μFBLS, color-coded according to cell identity annotations. Grey arrows indicate predicted future cell states calculated using RNA velocity algorithm scVelo. Black arrows indicate lineage trajectories constructed using Slingshot. One excitatory neuron trajectory (dRG → IP-EN → nEN) and three inhibitory neuron trajectories (vRG → IP-IN → nIN1, vRG → IP-IN → nIN2, and vRG → IP-IN → nIN3) are constructed. l. Heatmap of smoothened expression of all differentially expressed genes (DEGs) along the pseudotime of nEN and nIN1 lineage development trajectories. Selected genes are listed on the left. A gene is considered significant when adjusted p-value based on FDR is < 0.05 (see Methods). For DEG information, see Supplementary Table 1. m. Heatmap of smoothened expression of top-100 DEGs along the pseudotime of nEN, nIN1, nIN2, and nIN3 lineage development trajectories. A gene is considered significant when adjusted p-value based on FDR is < 0.05 (see Methods). For DEG information, see Supplementary Table 1.
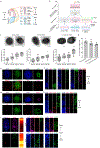
Figure 1.
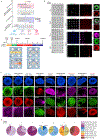
Figure 1.. A rostral-caudal (R-C) patterned human neural tube (NT) model using microfluidics.
a. 3D and dorsal view of NT, patterned along the R-C axis into forebrain (FB), midbrain (MB), hindbrain (HB), and spinal cord (SC). Neuromesodermal progenitors (NMPs) develop at SC caudal end. Regionalization of NT leads to patterned gene expression, with upregulated OTX2 in FB/MB, FGF8 at MB-HB boundary, and HOX family genes in HB and SC, as indicated. b. Schematic of microfluidic protocols for generating R-C patterned microfluidic neural tube-like structures (μNTLS) and region-specific microfluidic neural spheroids (μNS). Human pluripotent stem cells (hPSCs) form tubular or spherical tissues enclosing a single lumen in the patterning region of a microfluidic device, and further develop into R-C patterned μNTLS or region-specific μNS, respectively, when exposed to C-to-R gradients of caudalizing signals. See Methods for details. c. Stitched confocal micrographs showing R-C patterned μNTLS on Day 7 stained for OTX2, HOXB1, HOXB4, and HOXC9 as indicated. Right, zoom-in views of boxed regions as indicated. d. Stitched confocal micrographs showing R-C patterned μNTLS on Day 7 stained for ZO-1 and EdU. e. Stitched confocal micrographs showing R-C patterned μNTLS on Day 4 stained for SOX2, CDX2, and BRACHYURY (BRA). Right, zoom-in views of boxed regions as indicated. SOX2+CDX2+BRA+ cells are marked by arrowheads. f. Confocal micrographs showing μNS on Day 7 immunostained for PAX6, OTX2, HOXB1, HOXB4 and HOXC9 as indicated. g. Stitched confocal micrographs showing an array of R-C patterned μNTLS on Day 7 from a single microfluidic device (top) and an array of region-specific μNS on Day 7 from another device (bottom), both stained for OTX2, HOXB1, and HOXB4. In c-g, nuclei were counterstained with DAPI. Experiments were repeated three times with similar results. Scale bars, 400 μm (c, d and e), 200 μm (f), and 800 μm (g).
Figure 2.
Figure 2.. R-C and D-V patterning of μNTLS.
a. Transverse sections of FB and SC as indicated. D-V patterning of FB leads to formation of pallium and subpallium. D-V patterning of SC results in development of neural crest (NC) cells delaminating from dorsal SC and emergence of discrete, non-overlapping progenitor domains along the D-V axis, including roof plate (RP) and floor plate (FP) at dorsal and ventral poles, respectively. Different progenitor domains in FB and SC express distinct combinations of transcription factors as indicated. b. Schematic of microfluidic protocol for generating R-C and D-V patterned μNTLS. After R-C patterning between Day 2 to Day 5, μNTLS are continuously cultured in the microfluidic patterning region till Day 9, exposed to antiparallel gradients of dorsalizing and ventralizing signals established along the width (D-V axis) of the microfluidic patterning region. From Day 9 to Day 21, μNTLS are released from the device and embedded in Geltrex droplets. Transverse sections of rostral and caudal regions of μNTLS on Day 9 and Day 21 were analyzed using immunocytochemistry as indicated. c. Representative confocal micrographs showing transverse sections of rostral (c’) and caudal (c”) regions of R-C and D-V patterned μNTLS on Day 9, stained for indicated markers. Zoom-in views of boxed regions are shown on the right. d. Representative confocal micrographs showing transverse sections of rostral (d’) and caudal (d”) regions of R-C and D-V patterned μNTLS on Day 21, stained for indicated markers. Zoom-in views of boxed regions are shown on the right. In c and d, nuclei were counterstained with DAPI. Experiments were repeated three time with similar results. Scale bars, 100 μm.
Figure 3.
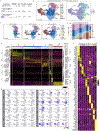
Figure 3.. Single-cell transcriptomic analysis of μNTLS.
a. (Left) UMAP of integrated single-cell transcriptome dataset of μNTLS on Day 4, Day 9, and Day 21, color-coded according to cell identity annotations. (Right) RNA velocity vectors projected onto UMAP-based embeddings show major cell progression directions in transcriptional space. FB, forebrain; MB, midbrain; IsO, isthmic organizer; HB, hindbrain; SC, spinal cord; NMP, neuromesodermal progenitors; RP, roof plate; FP, floor plate; NC, neural crest. b. Dot plot showing expression of key marker genes across cell clusters as indicated. Dot sizes and colors indicate proportions of cells expressing corresponding genes and their averaged scaled values of log-transformed expression, respectively. c. Principal component analysis (PCA) of Day 4, Day 9 and Day 21 μNTLS relative to neural cells in human embryonic tissues at different Carnegie Stages (CS) as indicated. d. (Left) UMAP projection of integrated scRNA-seq dataset from Day 9 μNTLS and neural cells of CS12 human embryo. (Middle & right) UMAP projections of datasets from Day 9 μNTLS and neural cells of CS12 human embryo, separated from integrated UMAP plot on the left, with cell identity annotations indicated. e. (Left) UMAP projection of integrated scRNA-seq dataset from Day 21 μNTLS and neural cells of CS15-16 human embryo. (Middle & right) UMAP projections of datasets from Day 21 μNTLS and neural cells of CS15-16 human embryo, separated from integrated UMAP plot on the left, with cell identity annotations indicated. f. (Top) UMAP projections of Neuron clusters from Day 9 μNTLS and CS12 human embryo, with cell identity annotations indicated. (Bottom) UMAP projections of Neuron clusters from Day 21 μNTLS and CS15-16 human embryo, with cell identity annotations indicated. IPC, intermediate progenitor cell. In d-f, original annotations of human neural cells from Ref. are used (see Methods). n indicates cell numbers.
Figure 4.
Figure 4.. Neural crest development in μNTLS.
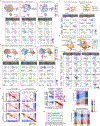
a. Schematic of cranial and trunk NC development. b. R-C and D-V patterned μNTLS (left) and ectopic caudalization of μNTLS (right). c-d. Micrographs showing rostral and caudal regions of Day 11 R-C and D-V patterned μNTLS without (c) or with (d) ectopic caudalization, stained for indicated markers. e. Percentages of TWIST1+ (top) or PHOX2B+ (bottom) cells among all disseminated cells in rostral or caudal halves of μNTLS with or without ectopic caudalization. ncolony = 8 and nexperiment = 2. f. Micrographs showing caudal ends of Day 11 R-C and D-V patterned μNTLS generated from the TBXT::T2A-Cre lineage tracer, stained for indicated markers. White and yellow arrowheads mark ZsGreen+ and ZsGreen− NC cells, respectively. g. UMAP of NC cluster isolated from integrated transcriptome dataset of Day 4, Day 9, and Day 11 μNTLS, color-coded according to cell identity annotations. h. UMAP of transcriptome data of HOX− and HOX+ cranial NC, vagal NC, and trunk NC, isolated from UMAP plot in g. i. Dot plot showing expression of selected markers in premigratory NC from four NC lineages. j. Micrographs showing caudal regions of Day 11 R-C and D-V patterned μNTLS generated from wild type (WT) and CDX2-KO hESCs, stained for indicated markers. Arrowheads mark PHOX2B+ cells. k. Percentage of PHOX2B+ cells among all disseminated cells at caudal regions of μNTLS generated from WT and CDX2-KO hESCs. nPHOX2B = 8 and nexperiment = 2. In c, d, f and j, nuclei were counterstained with DAPI, dashed lines mark dorsal μNTLS boundaries, and experiments were repeated three times with similar results. In e and k, error bars represent mean ± SEM, and two-sided Student's t-tests were performed. In g and h, n indicate cell numbers. Scale bars, 100 μm (c, d and j) and 50 μm (f).
Figure 5.
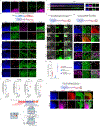
Figure 5.. Development of D-V patterned μFBLS.
a. Protocol for generating D-V patterned μFBLS. μNS are exposed to antiparallel gradients of dorsalizing and ventralizing signals in the microfluidic patterning region till Day 9, after which they are released from the device and cultured in Matrigel solutions. b. Representative confocal micrographs showing sections of D-V patterned μFBLS on Day 40, stained for ZO-1. Right, zoom-in views of boxed region. c. 3D view of representative whole mount staining images showing D-V patterned μFBLS on Day 40, stained for CTIP2 and NKX2-1. See Supplementary Video 7. Dashed line marks boundary of μFBLS. d. Representative confocal micrographs showing sections of D-V patterned μFBLS on Day 40, stained for TBR1 and DLX2. Right, zoom-in views of boxed regions. e. UMAP of single-cell transcriptome data of Day 40 D-V patterned μFBLS, color-coded according to cell identity annotations. dRG, dorsal radial glia; vRG, ventral radial glia; oRG, outer radial glia; IP-EN, intermediate neural progenitor of excitatory neuron; IP-IN, intermediate neural progenitor of inhibitory neuron; nEN, newborn excitatory neuron; nIN, newborn inhibitory neuron. Grey arrows indicate RNA velocity vectors predicting future cell states. Black arrows indicate inferred lineage trajectories. One excitatory neuron trajectory (dRG → IP-EN → nEN) and three inhibitory neuron trajectories (vRG → IP-IN → nIN1 / nIN2 / nIN 3) are constructed. n indicates cell number. f. Dot plot showing expression of key marker genes across all cell clusters as indicated. Dot sizes and colors indicate proportions of cells expressing corresponding genes and their averaged scaled values of log-transformed expression, respectively. In b, c, and d, nuclei were counterstained with DAPI, and experiments were repeated three times with similar results. Scale bars, 50 μm (zoom-in views in b and d) and 200 μm (all other images).

References

References for Main Text

    1. Lancaster MA et al. Cerebral organoids model human brain development and microcephaly. Nature 501, 373–379 (2013). - PMC - PubMed
    1. Qian X et al. Brain-region-specific organoids using mini-bioreactors for modeling ZIKV exposure. Cell 165, 1238–1254 (2016). - PMC - PubMed
    1. ctipBirey F et al. Assembly of functionally integrated human forebrain spheroids. Nature 545, 54–59 (2017). - PMC - PubMed
    1. Velasco S et al. Individual brain organoids reproducibly form cell diversity of the human cerebral cortex. Nature 570, 523–527 (2019). - PMC - PubMed
    1. Faustino Martins J-M et al. Self-organizing 3D human trunk neuromuscular organoids. Cell Stem Cell 26, 172–186.e176 (2020). - PubMed

References for Methods section

    1. Muncie JM et al. Mechanical tension promotes formation of gastrulation-like nodes and patterns mesoderm specification in human embryonic stem cells. Dev. Cell 55, 679–694 (2020). - PMC - PubMed
    1. Kumar N et al. The lineage-specific transcription factor CDX2 navigates dynamic chromatin to control distinct stages of intestine development. Development 146, dev172189 (2019). - PMC - PubMed
    1. Bayerl J et al. Principles of signaling pathway modulation for enhancing human naive pluripotency induction. Cell Stem Cell 28, 1549–1565 (2021). - PMC - PubMed
    1. Cong L et al. Multiplex genome engineering using CRISPR/Cas systems. Science 339, 819–823 (2013). - PMC - PubMed
    1. Chen Y et al. Engineering human stem cell lines with inducible gene knockout using CRISPR/Cas9. Cell Stem Cell 17, 233–244 (2015). - PMC - PubMed

Substances