. 2024 May:118:334-354.
doi: 10.1016/j.bbi.2024.02.025. Epub 2024 Feb 24.

Impact of high-fat diet on cognitive behavior and central and systemic inflammation with aging and sex differences in mice

Affiliations

Impact of high-fat diet on cognitive behavior and central and systemic inflammation with aging and sex differences in mice

Andrew K Evans et al. Brain Behav Immun. 2024 May.

Abstract

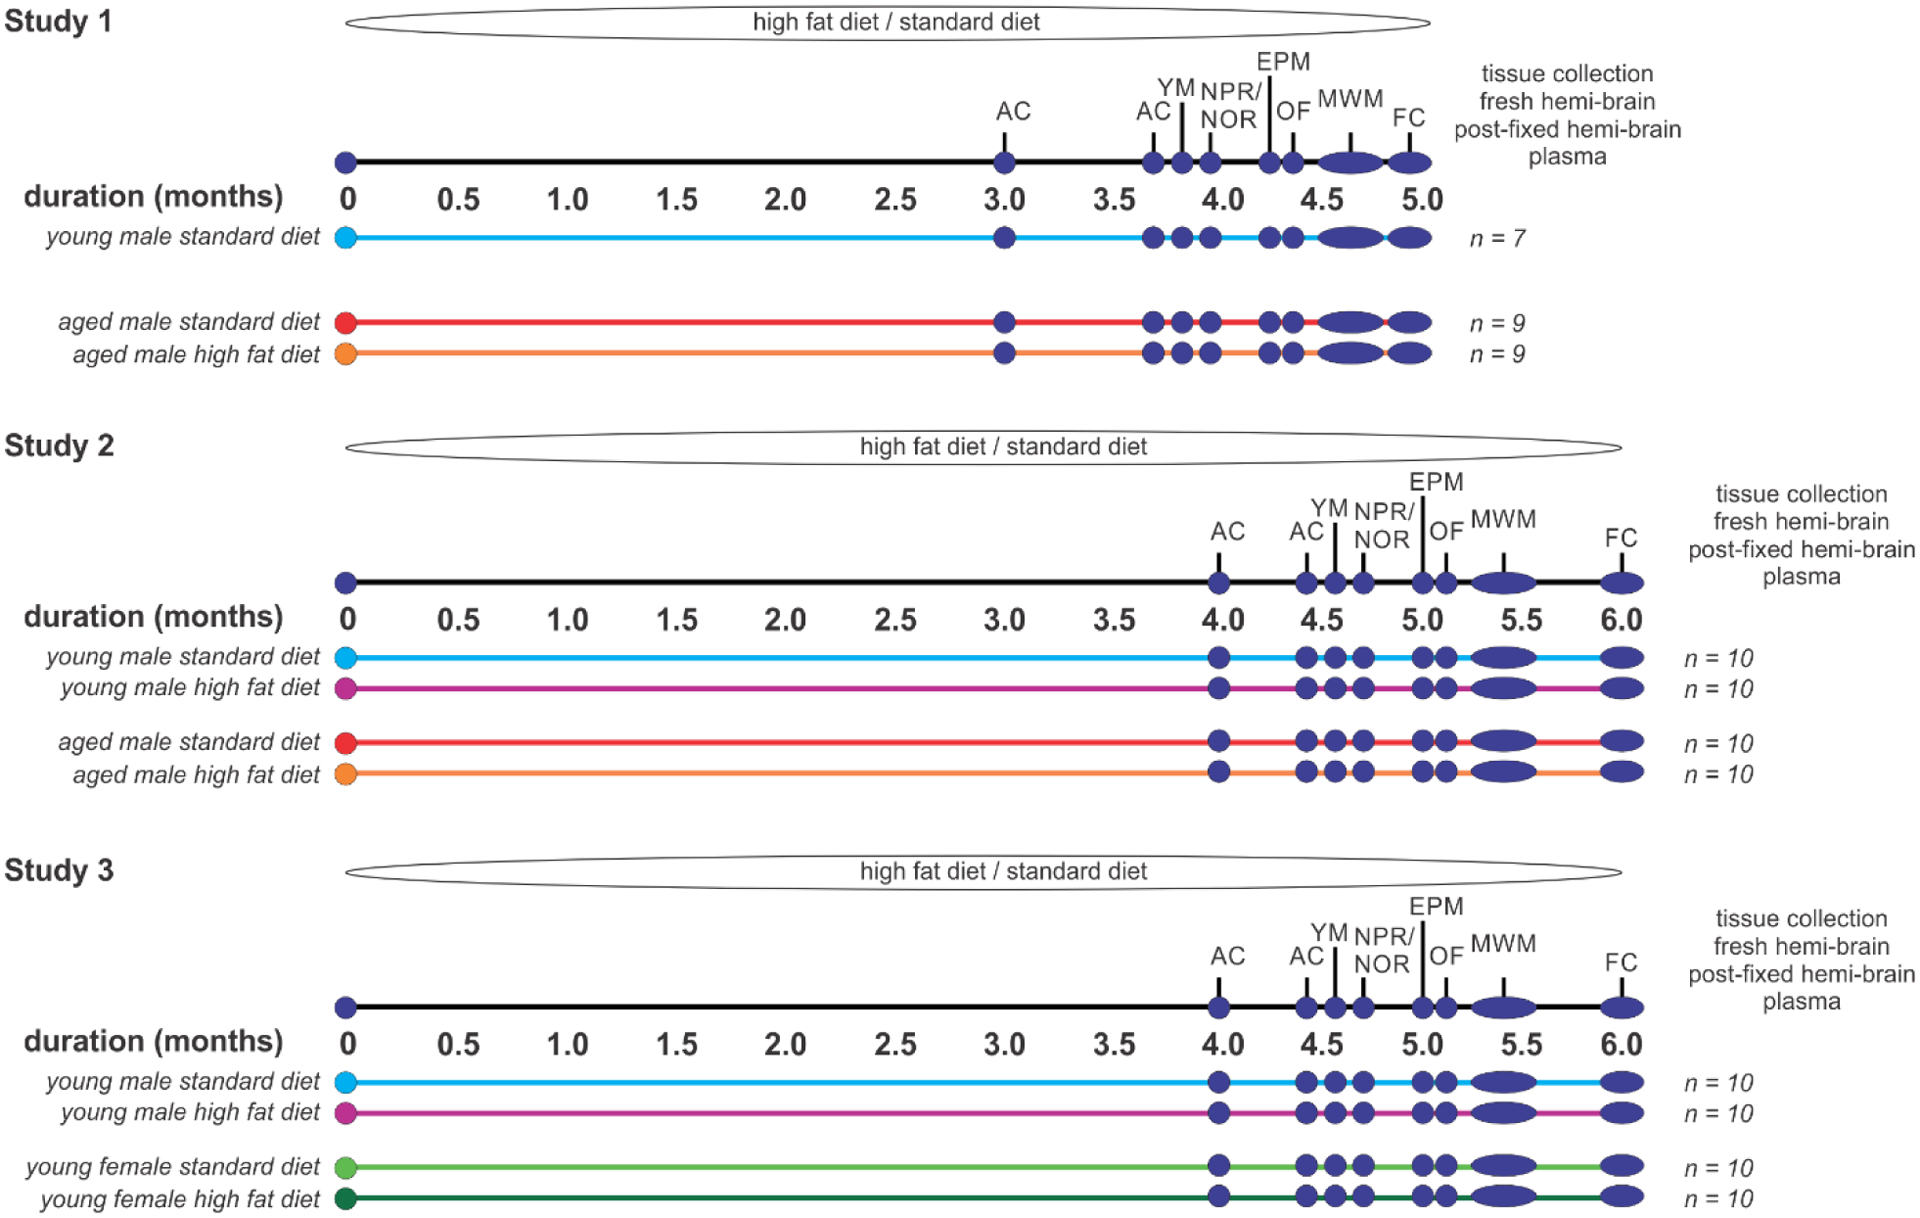
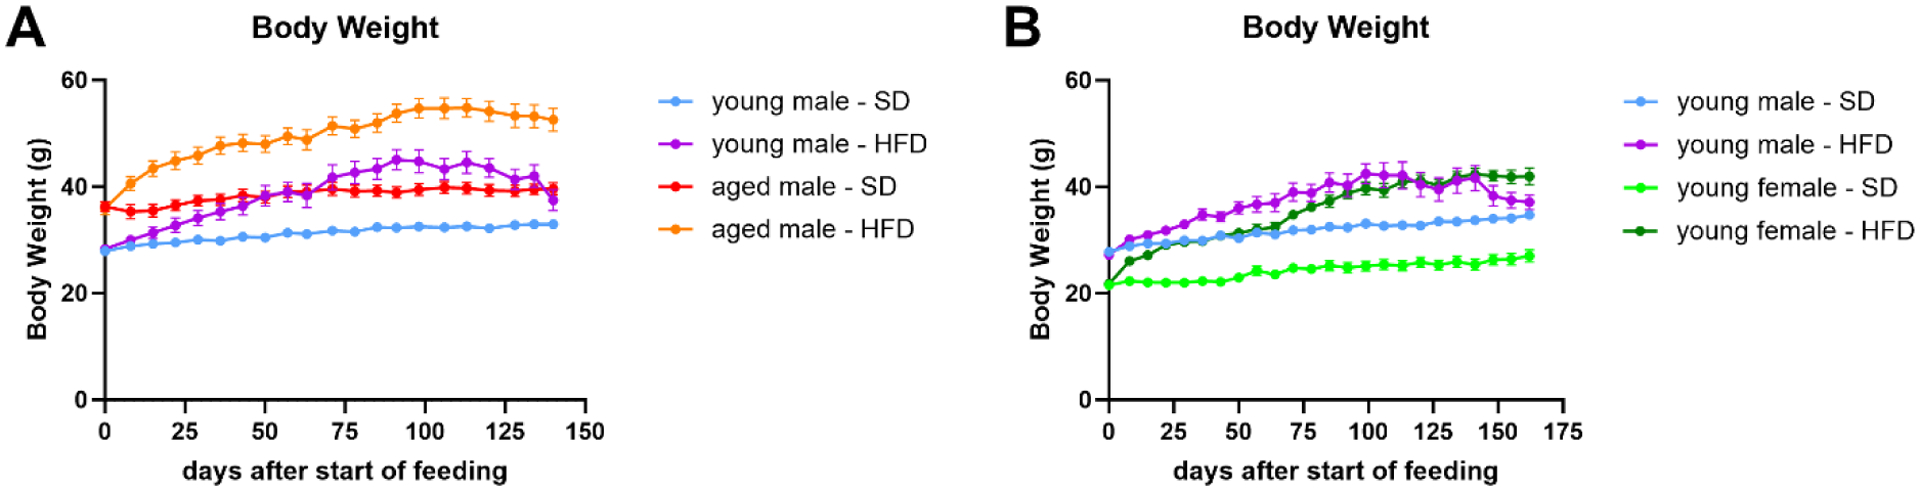
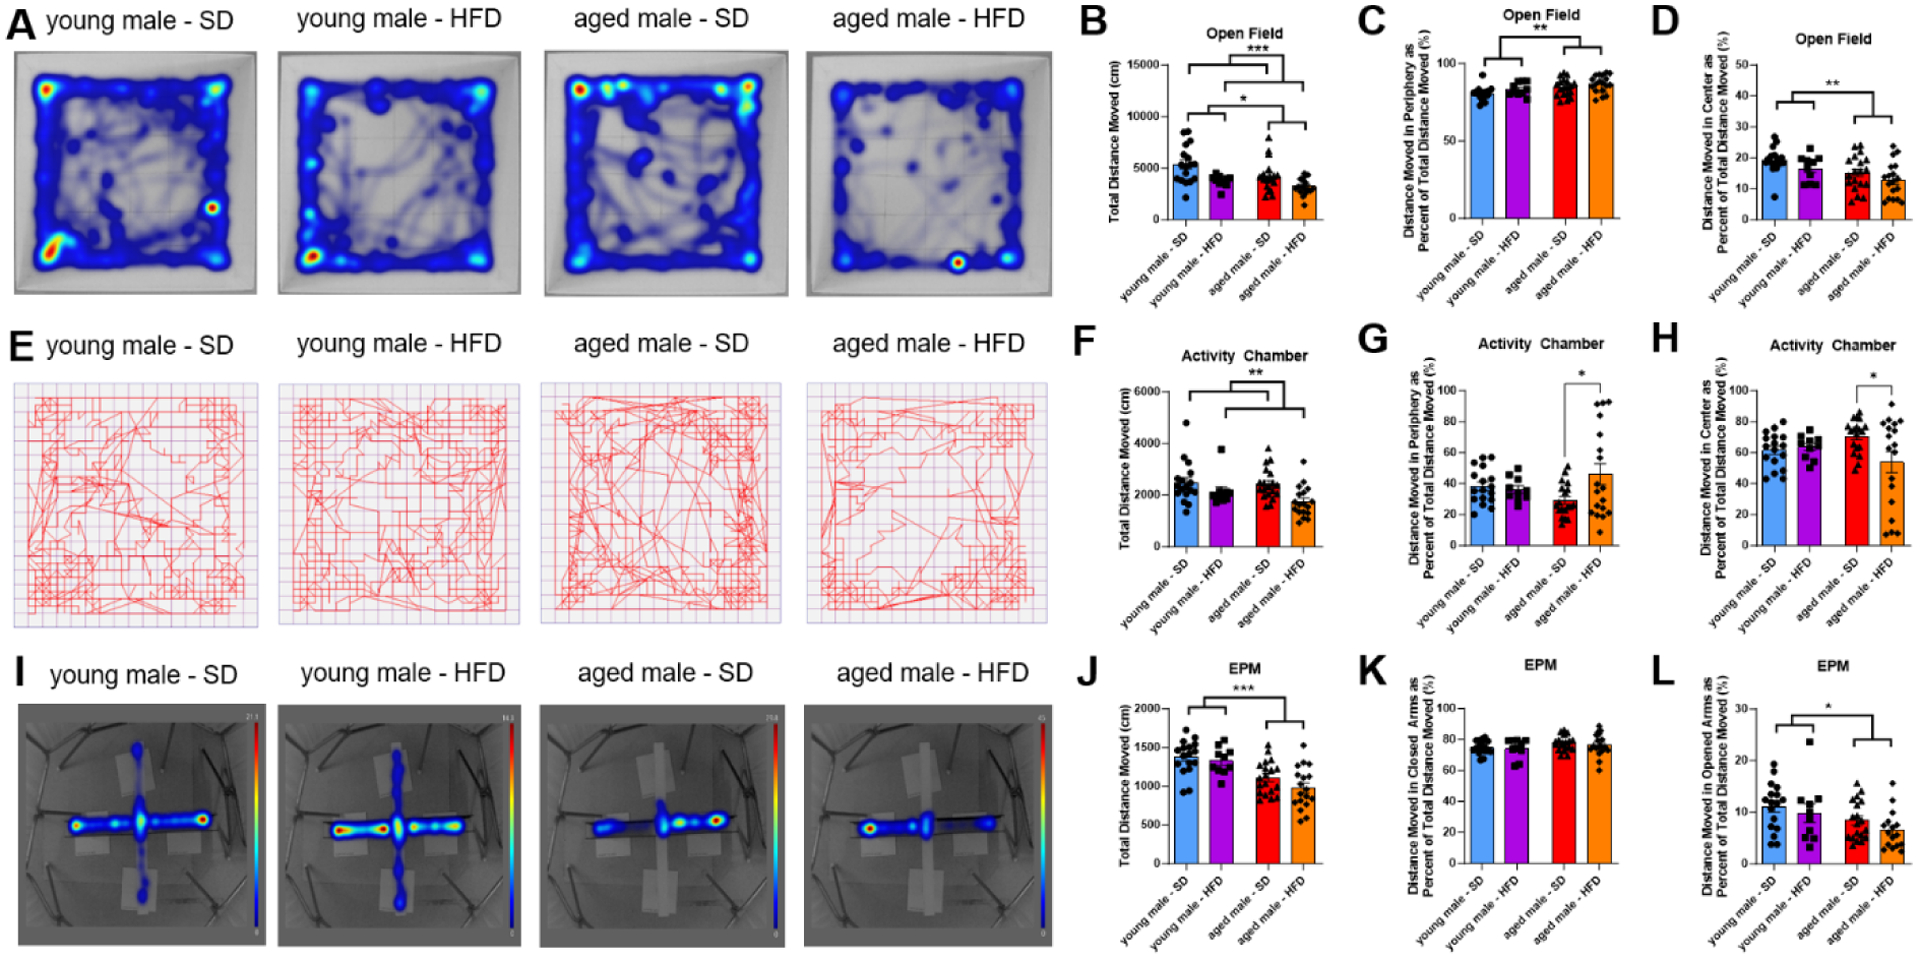
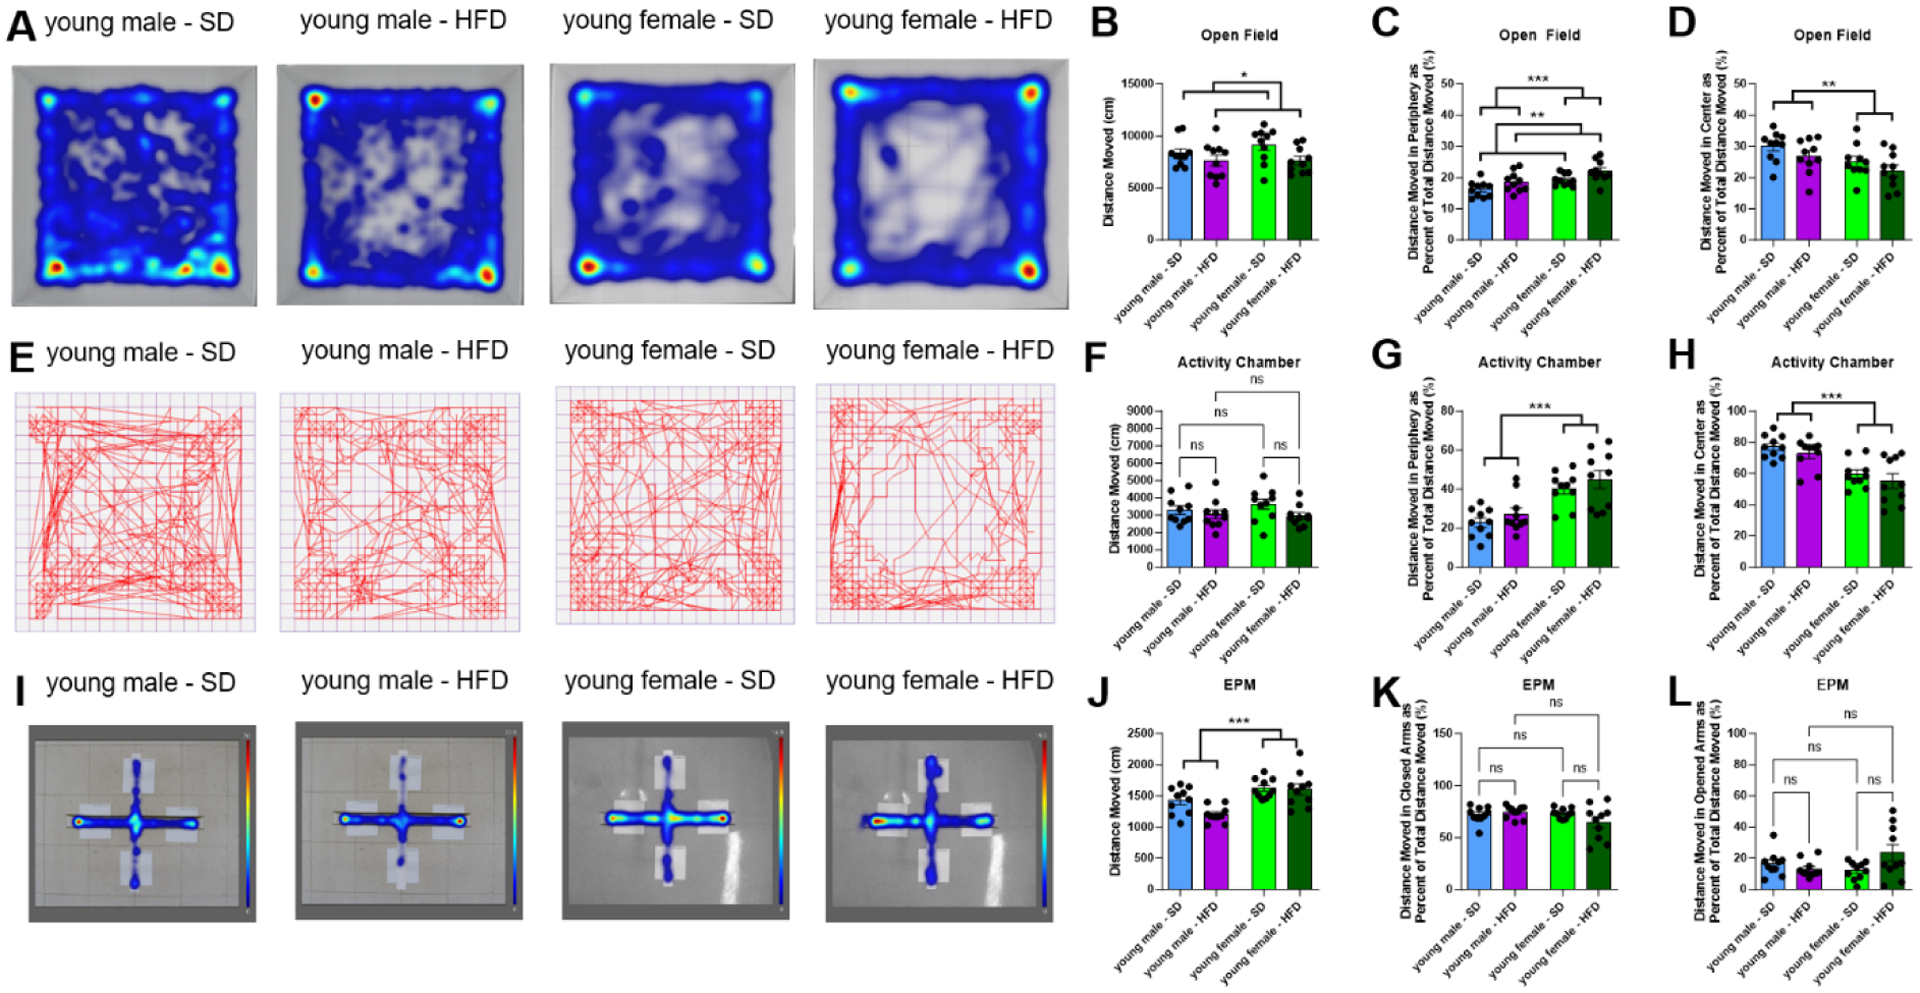
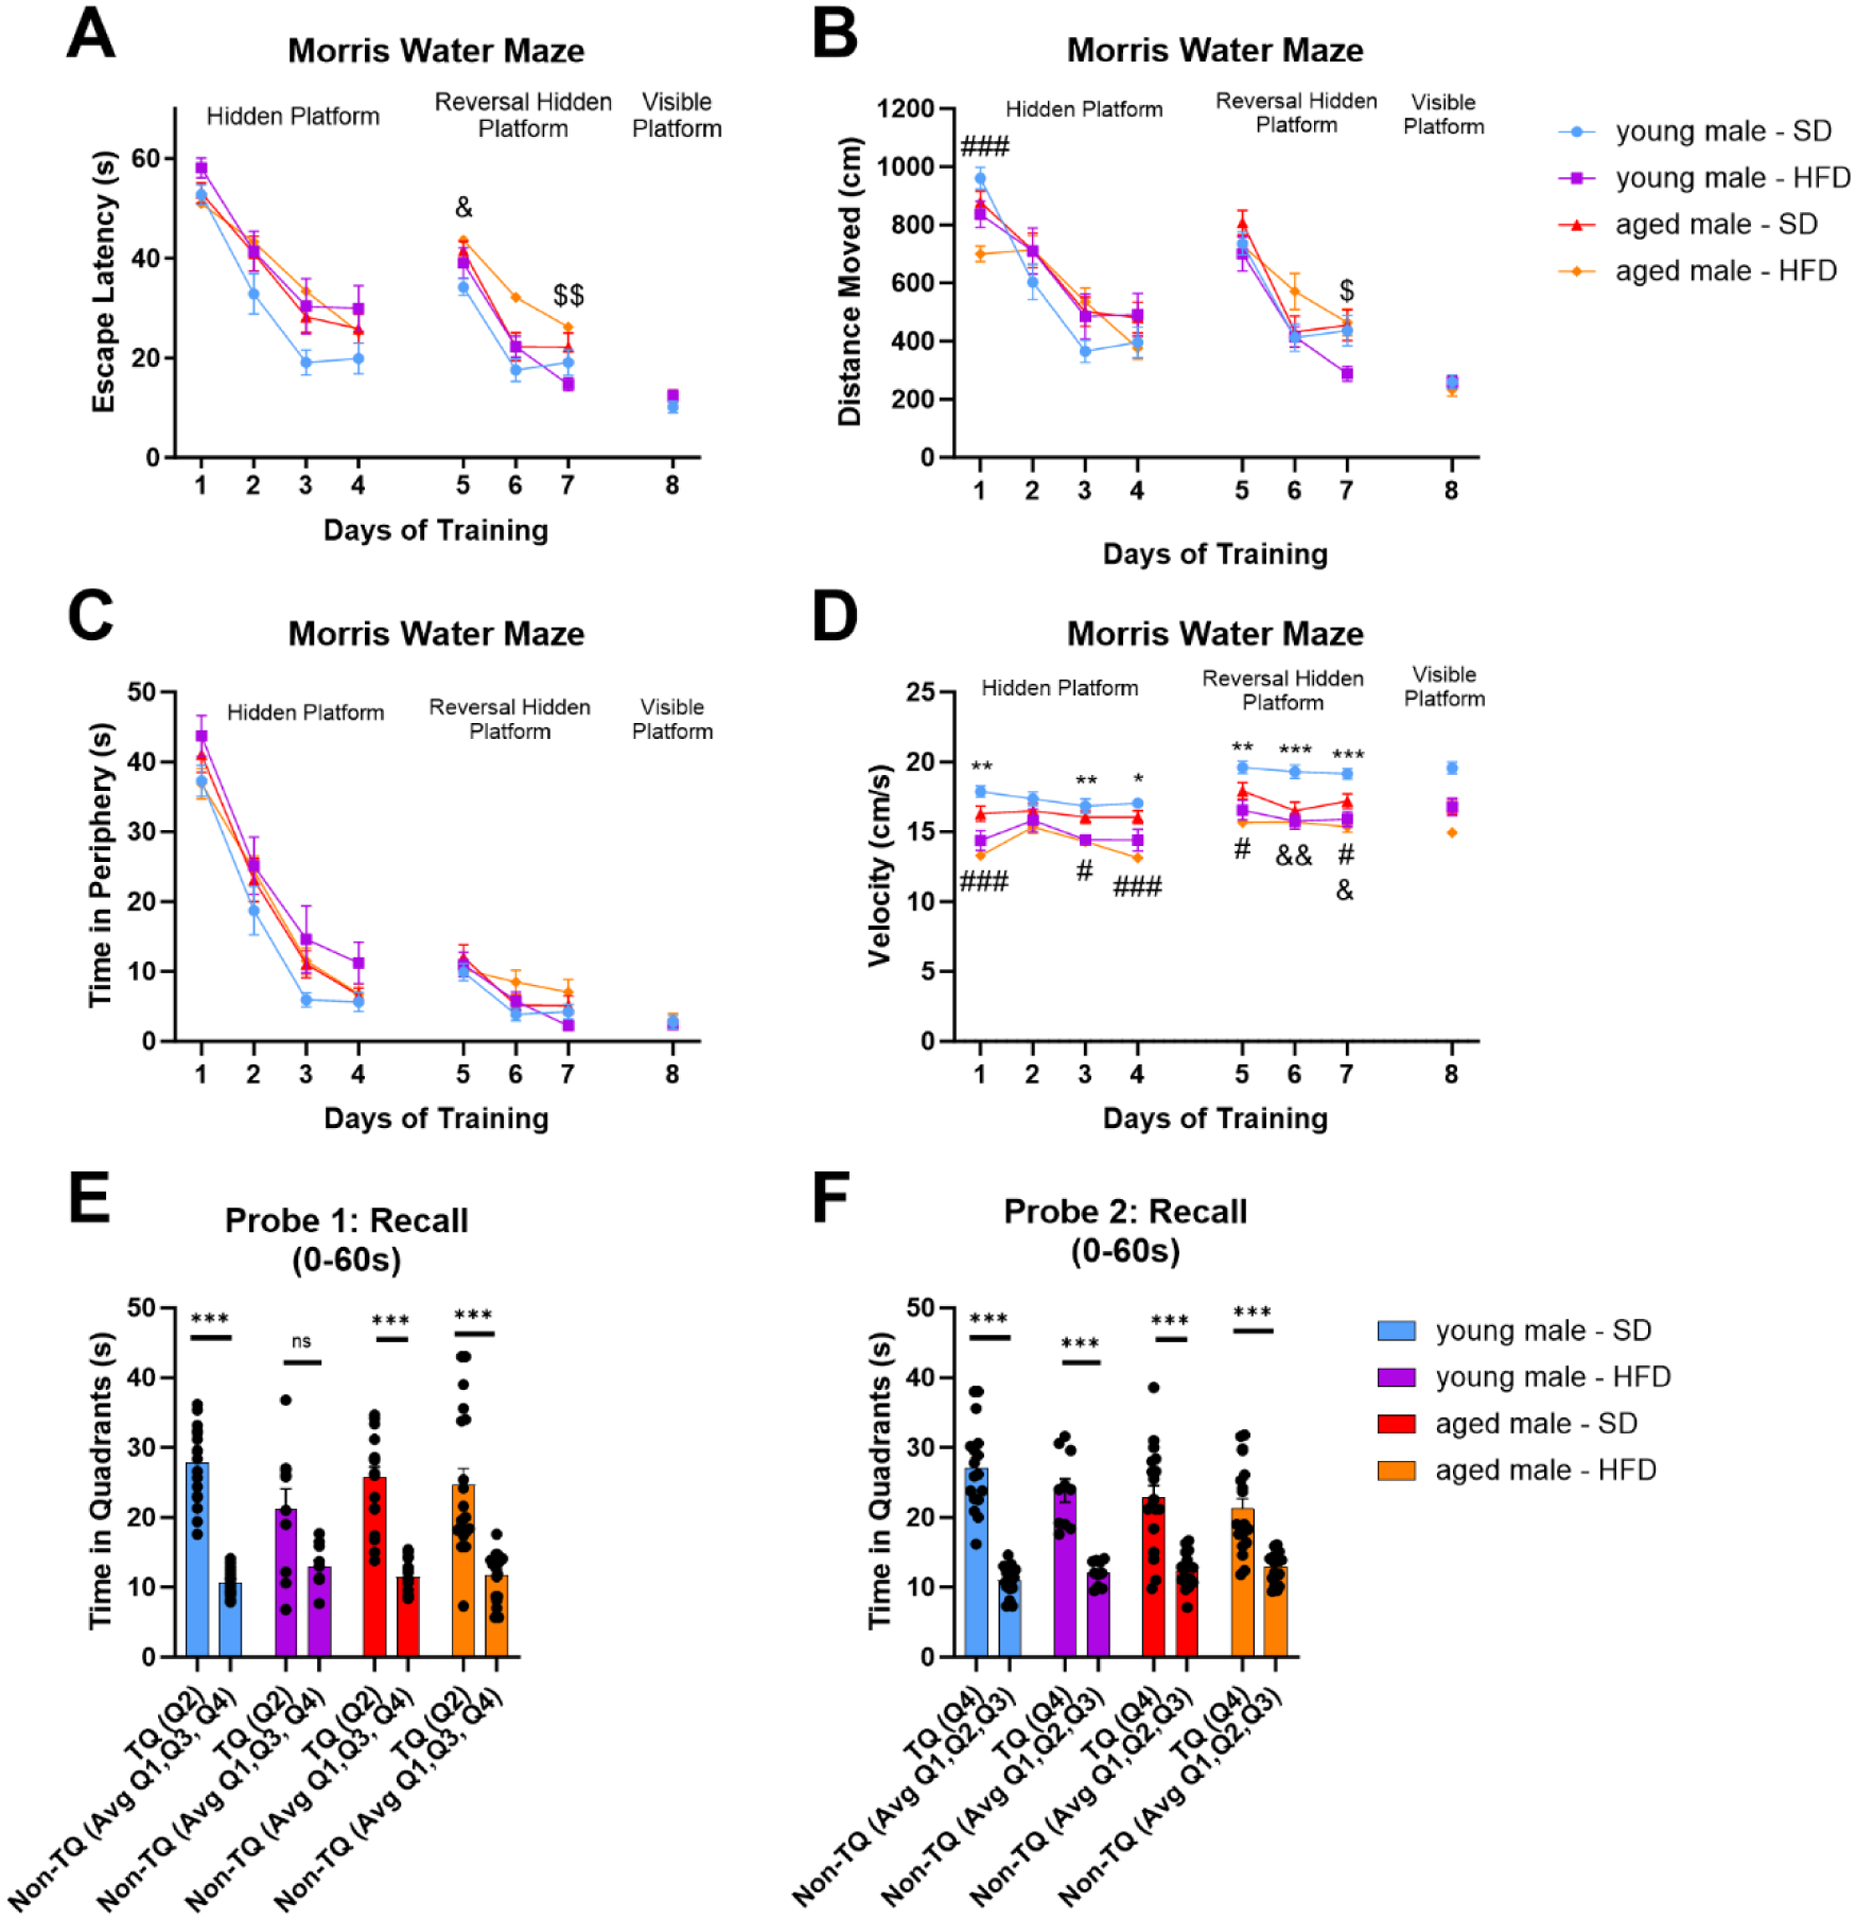
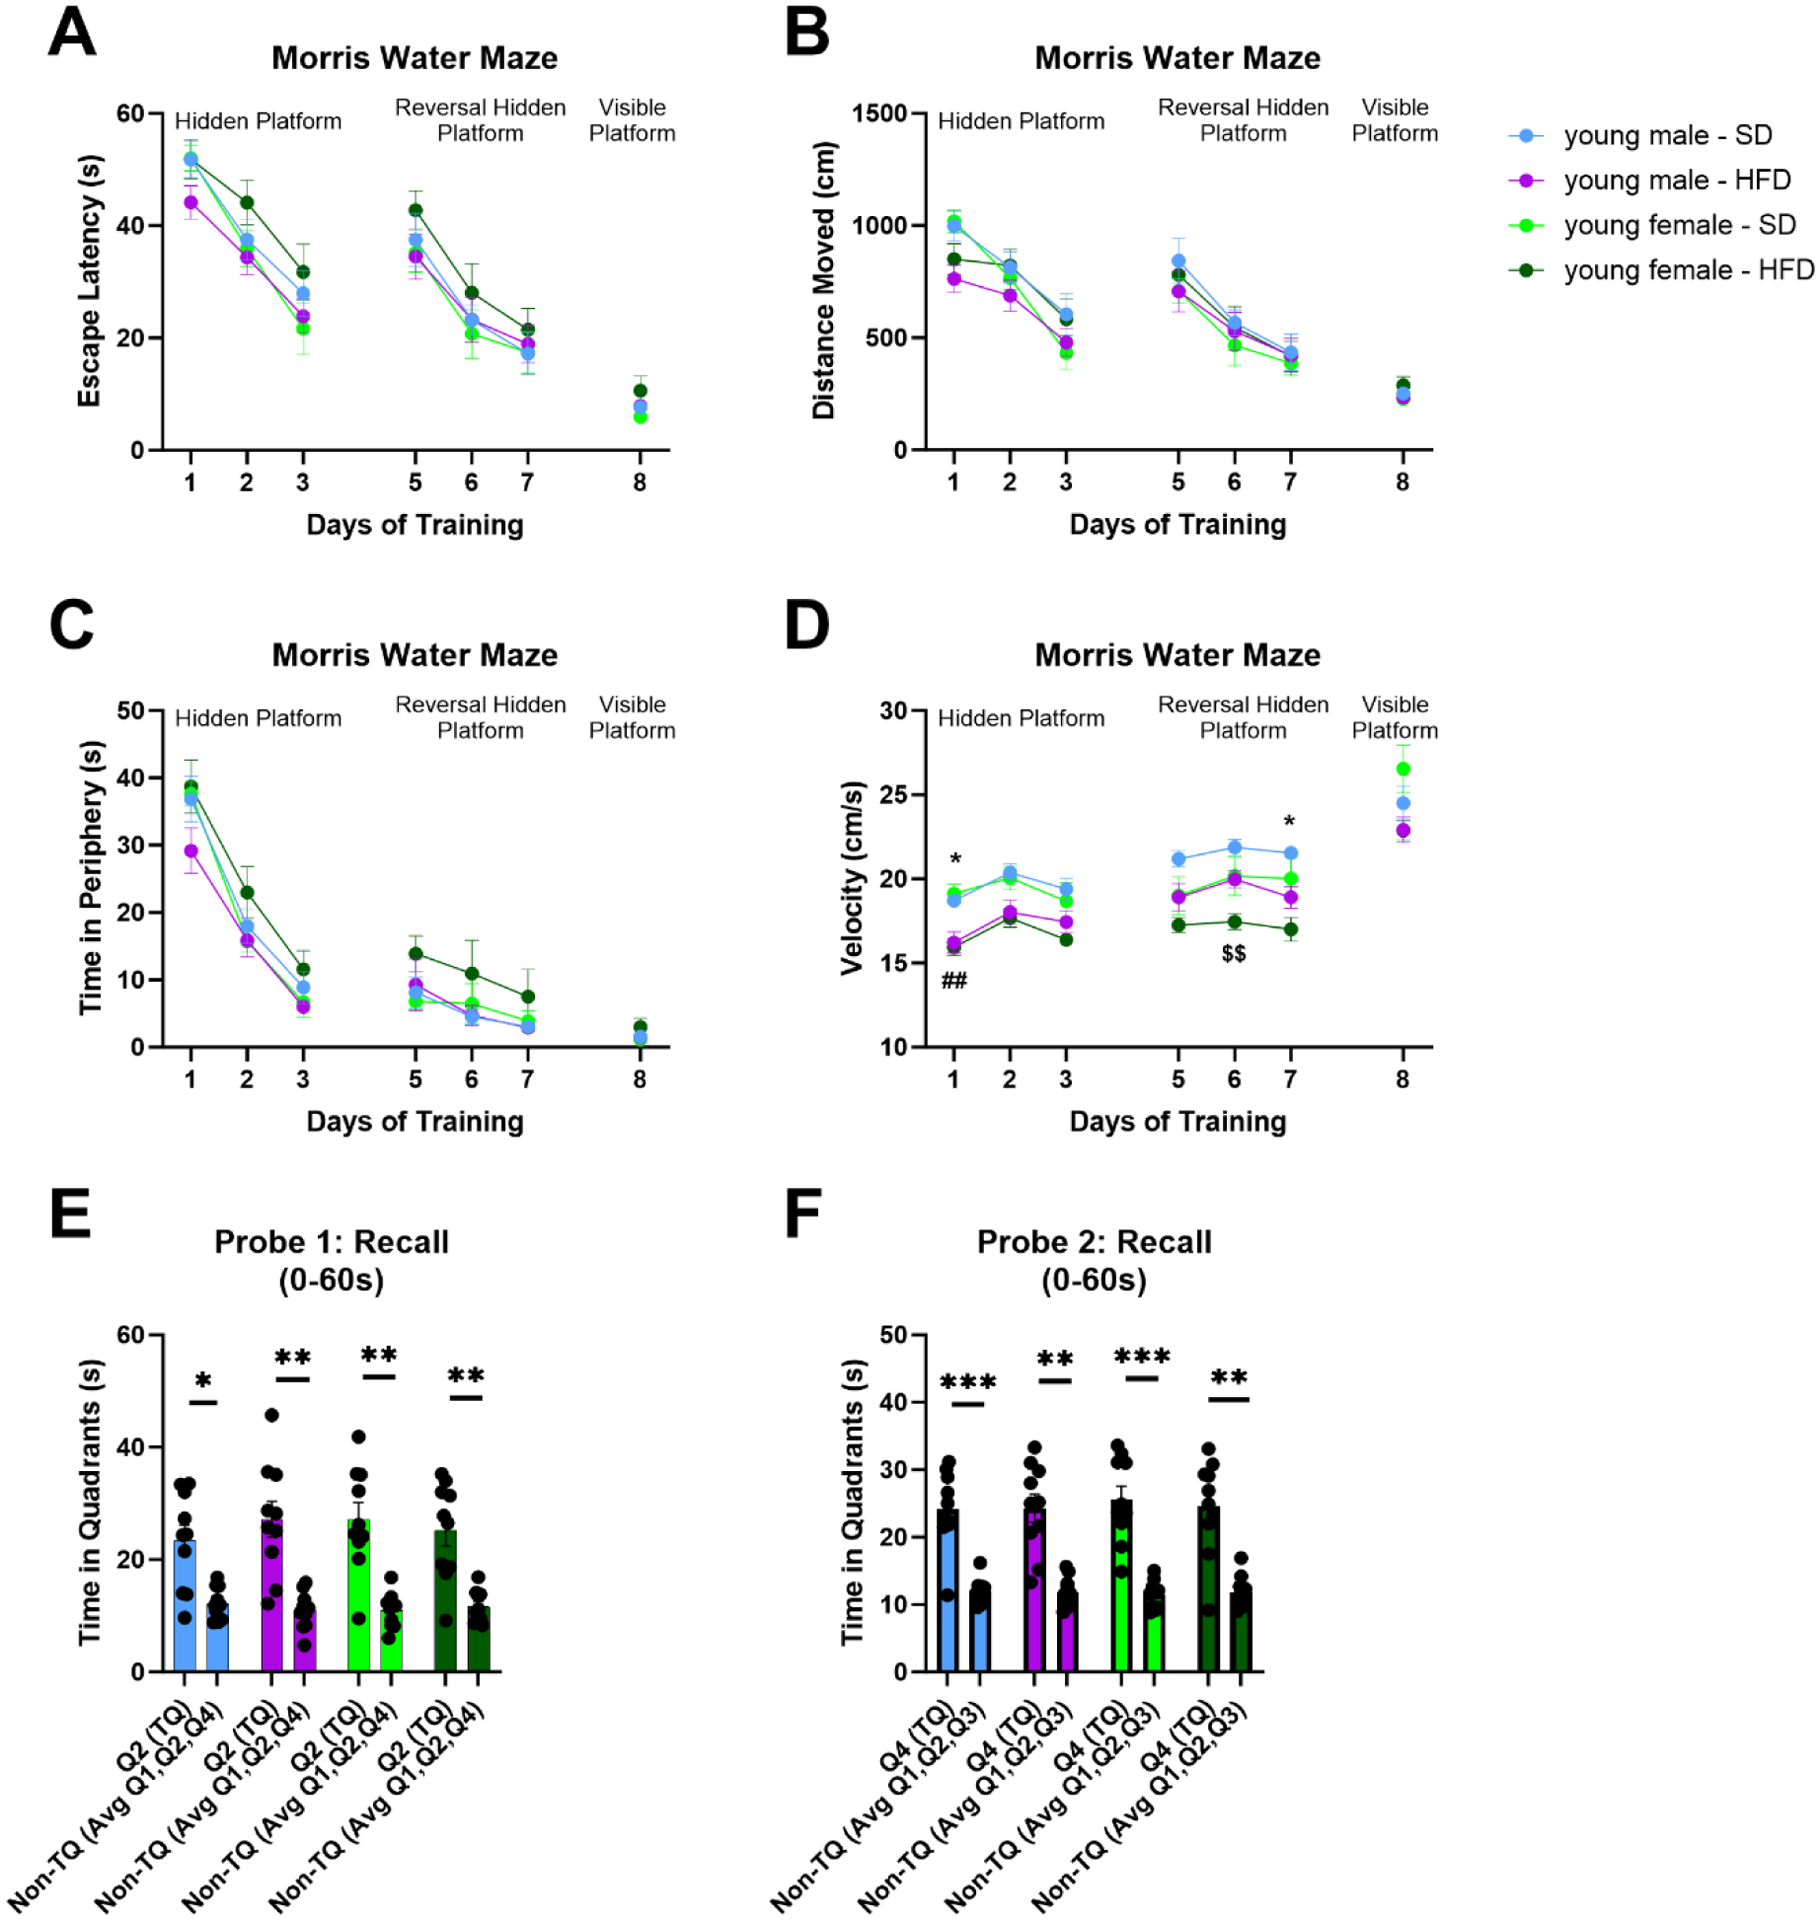
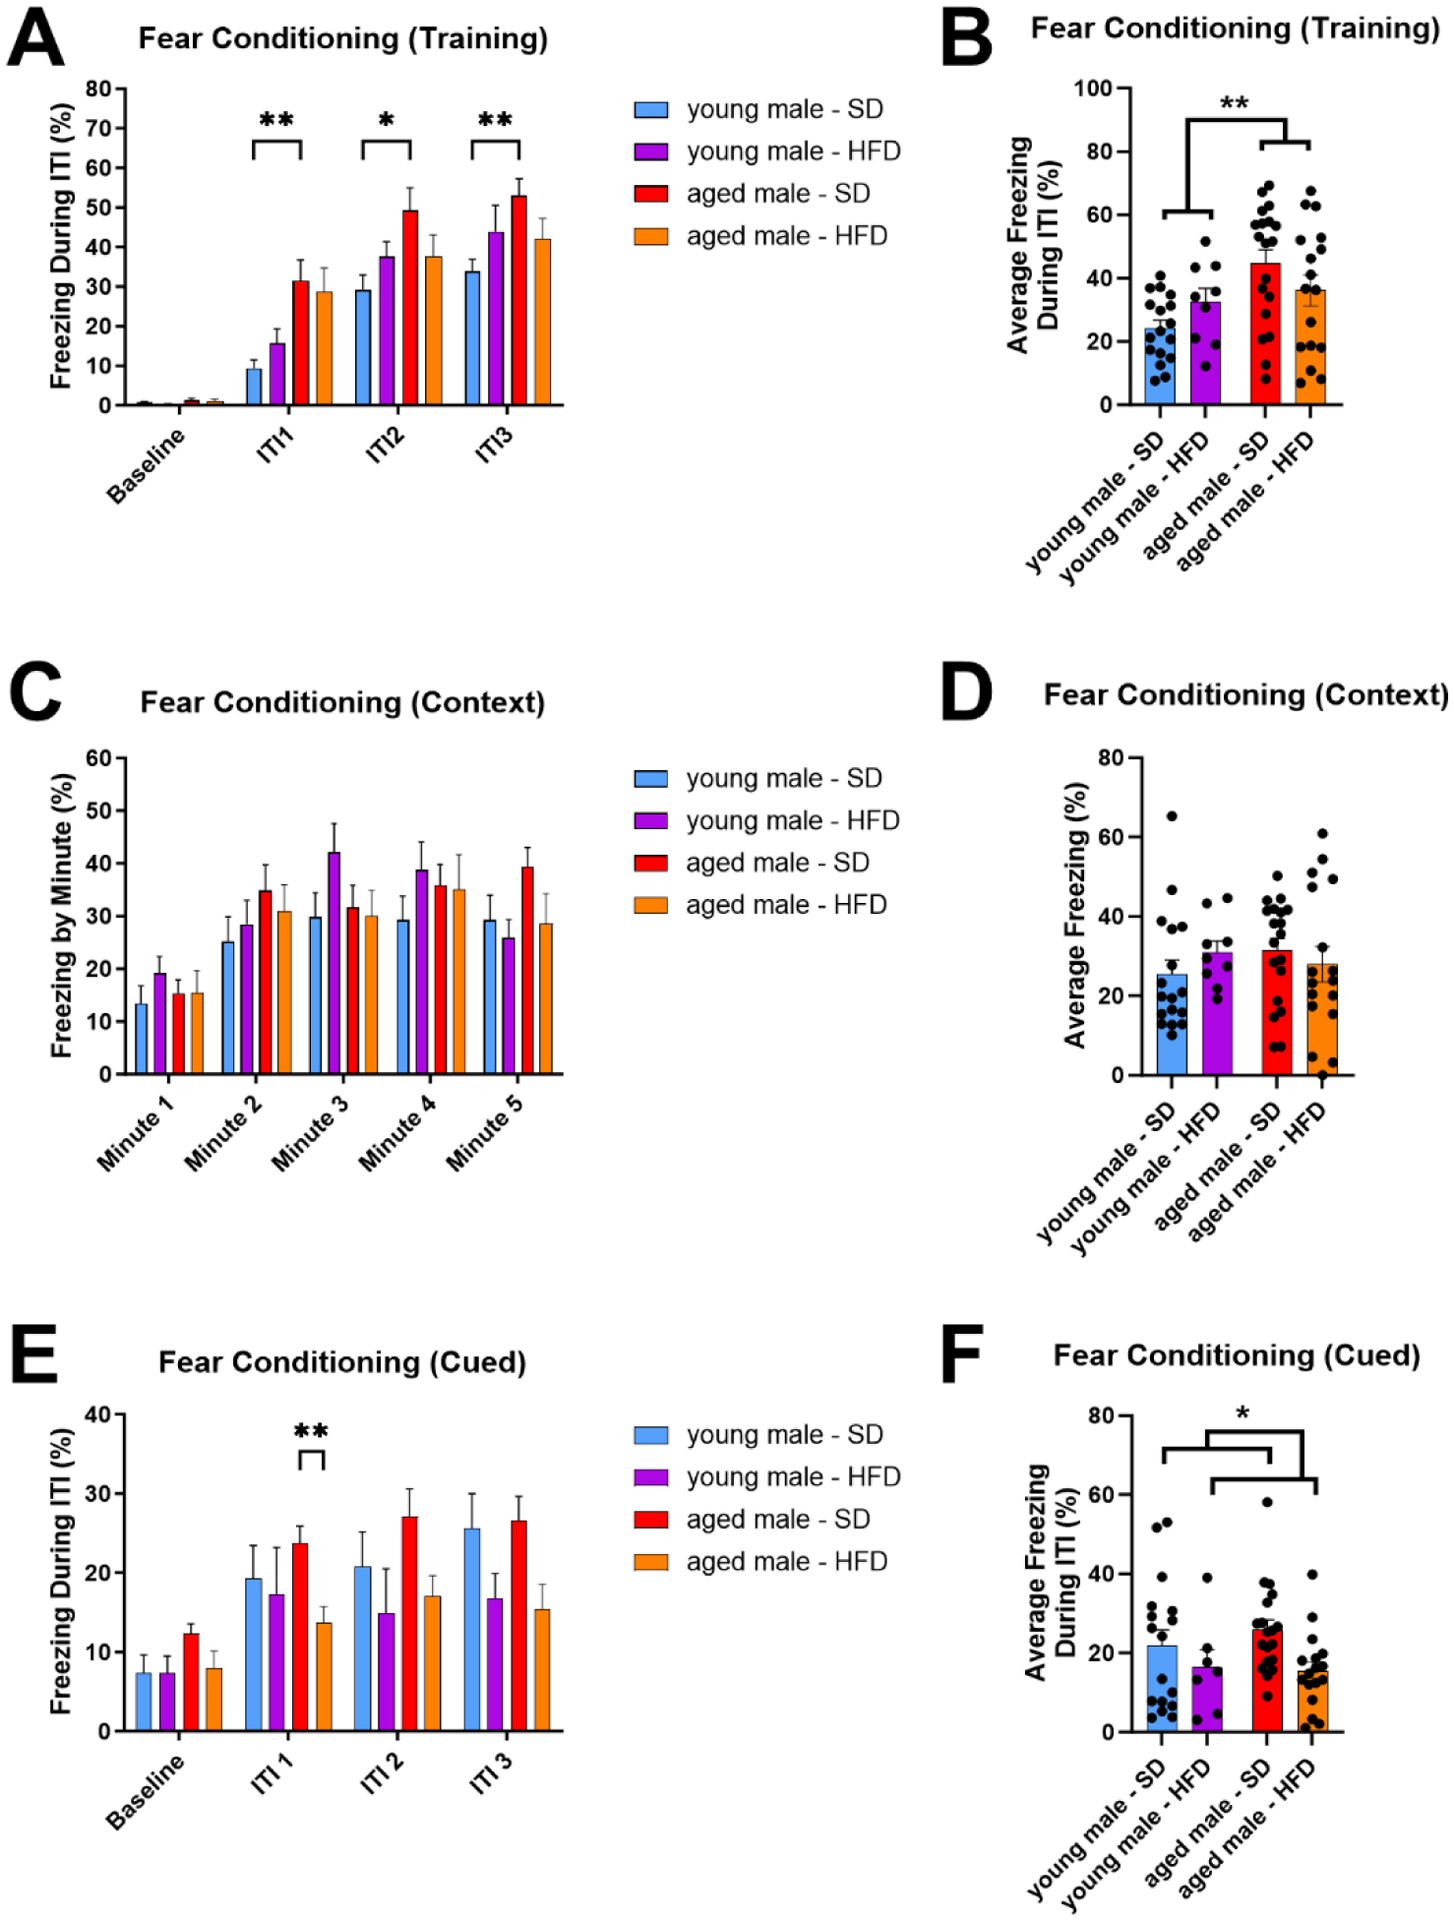
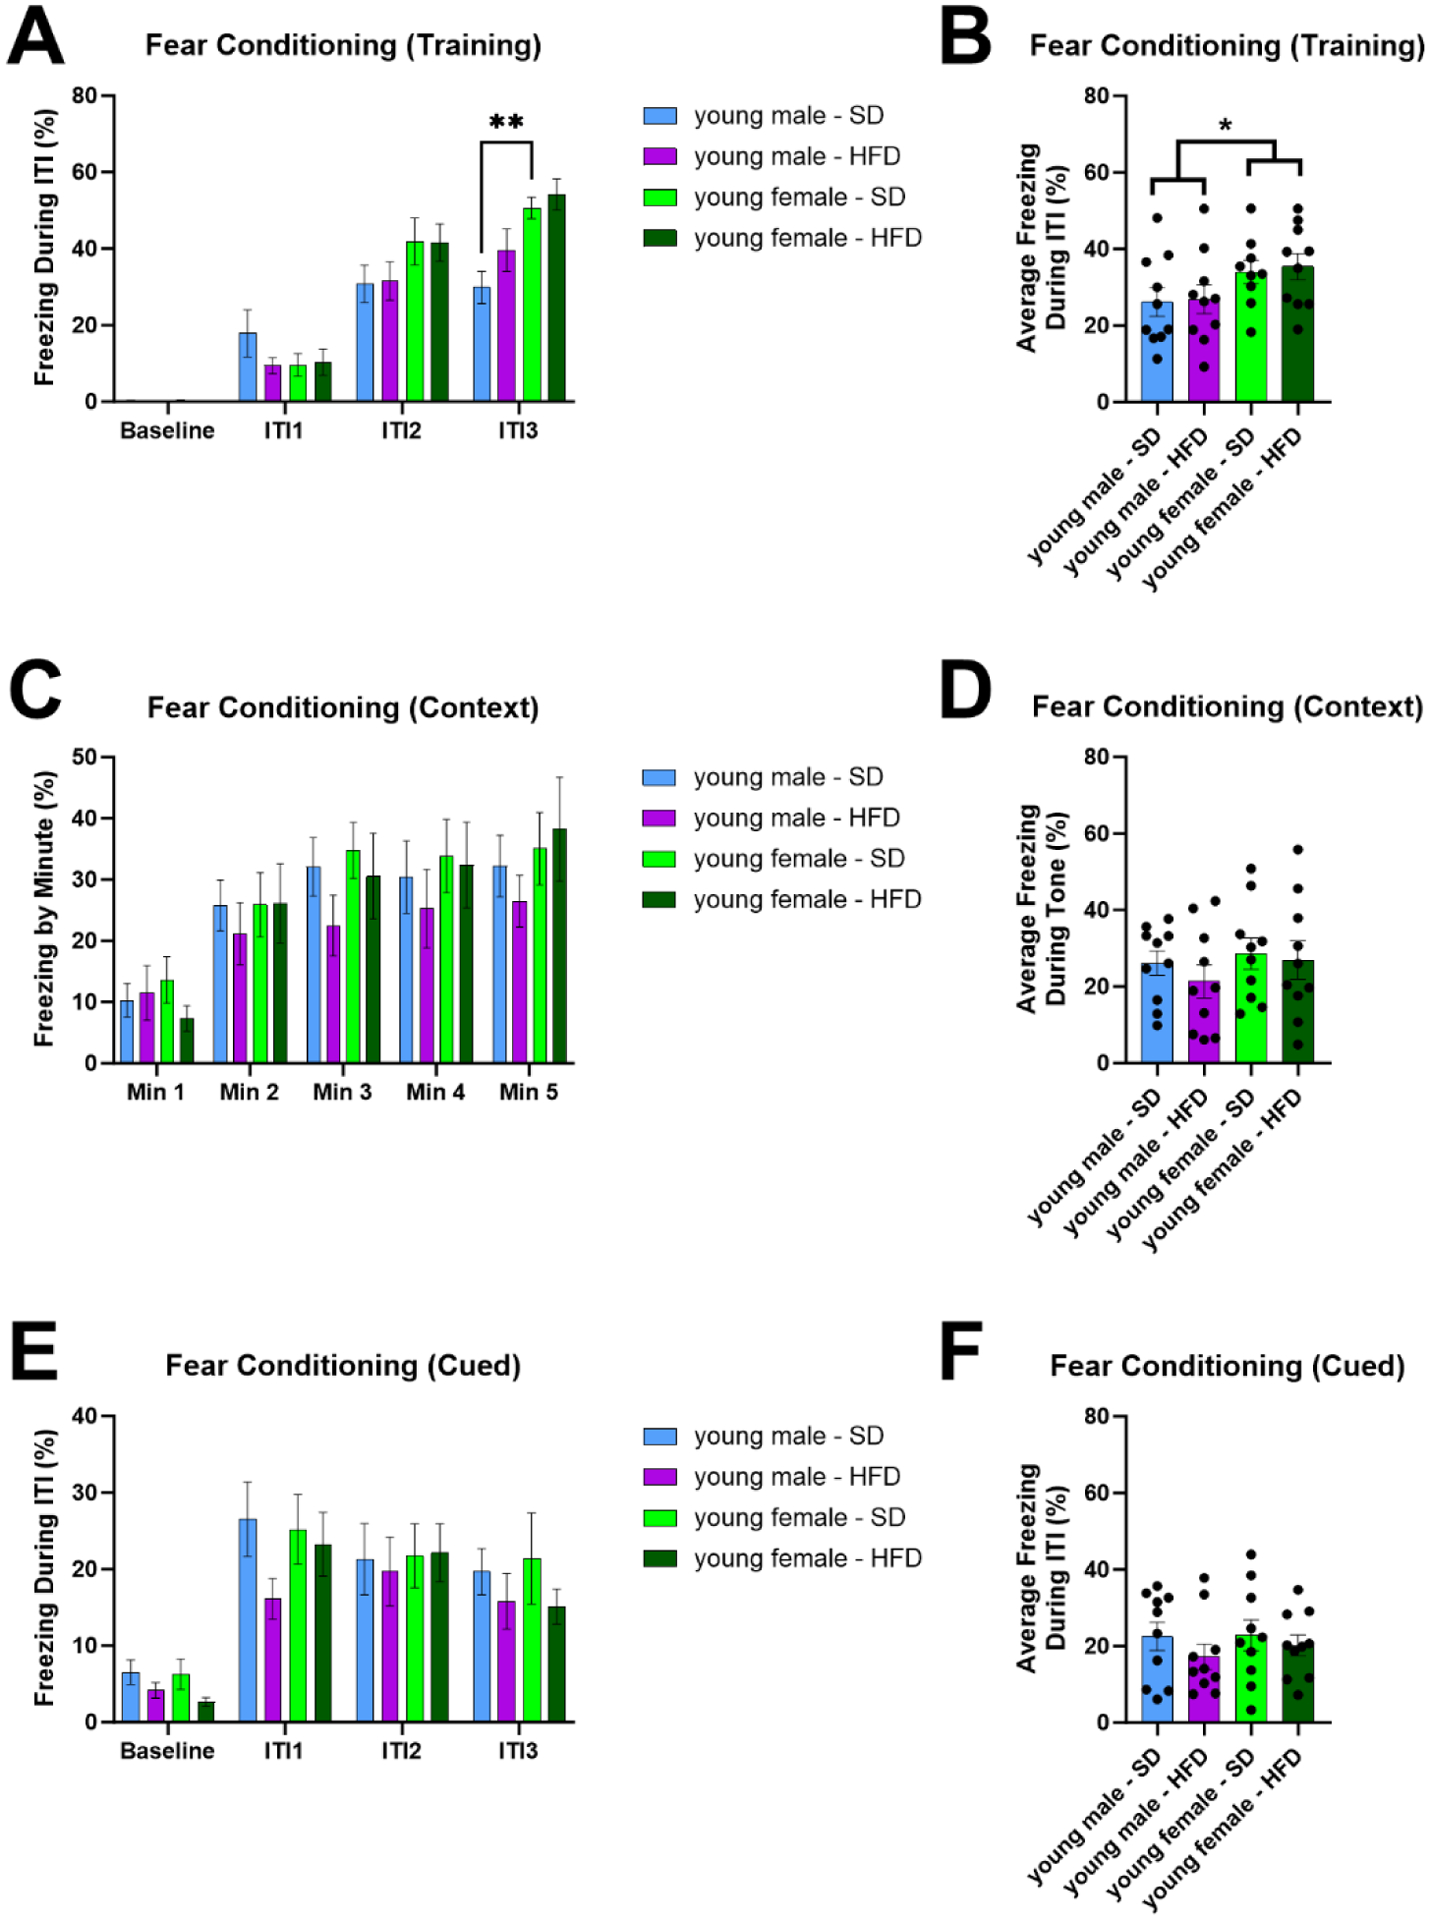
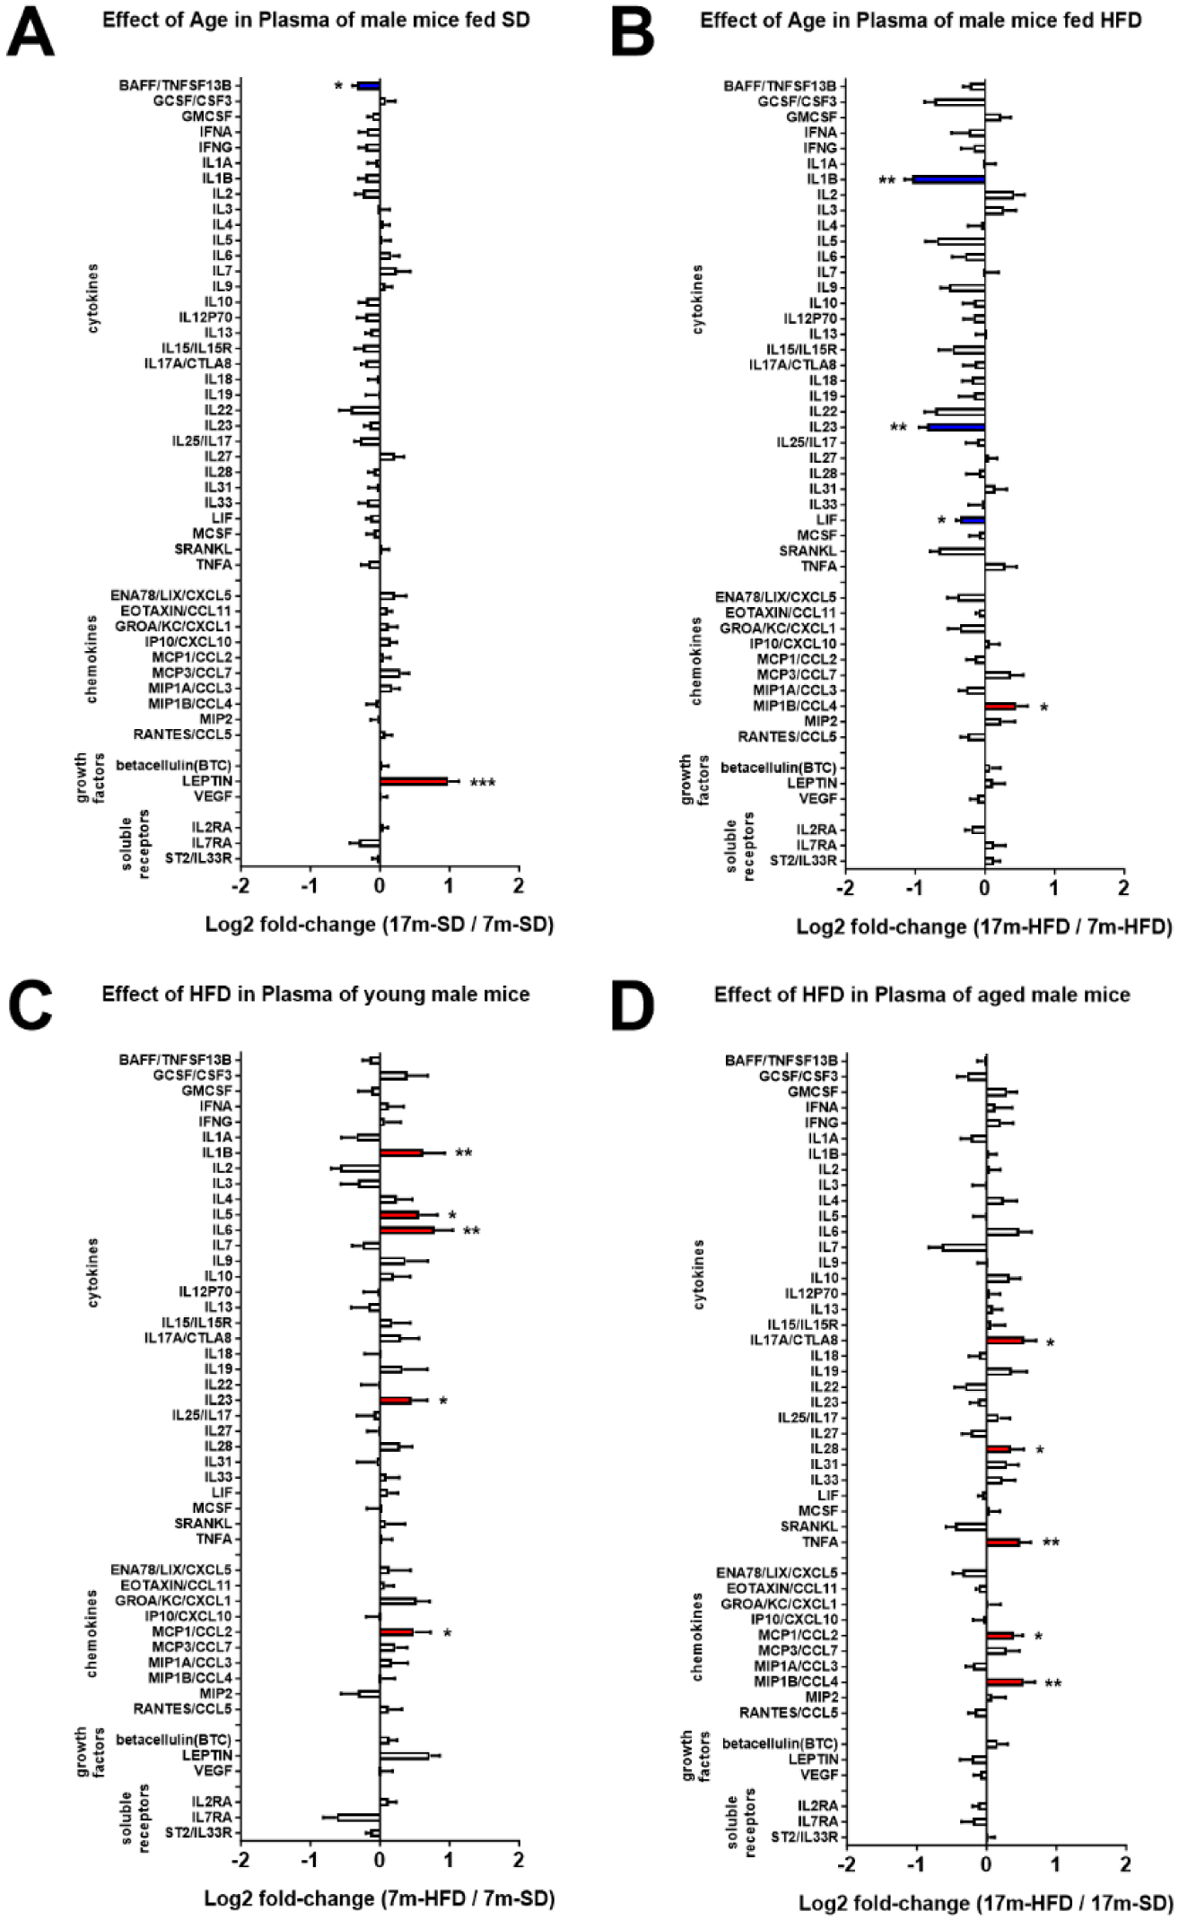
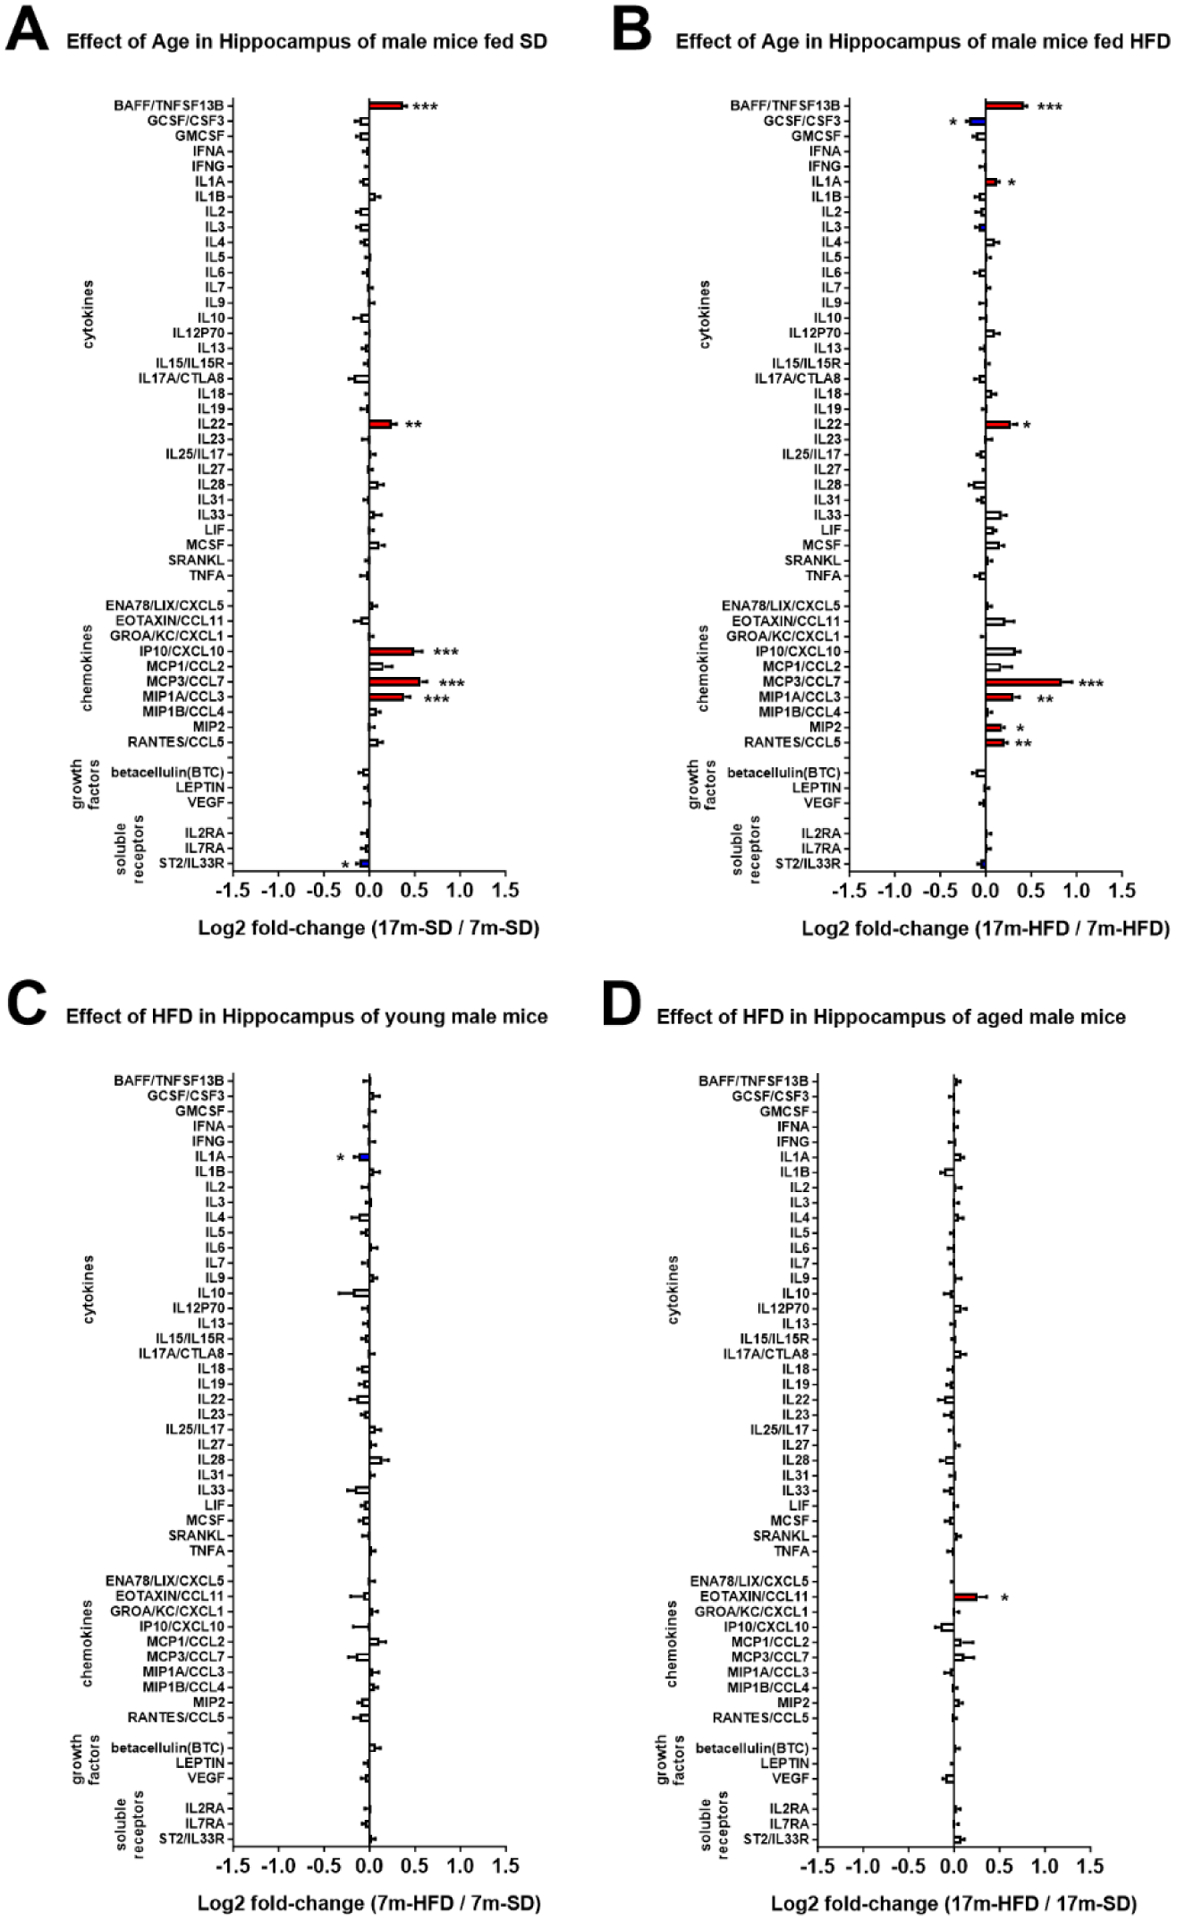
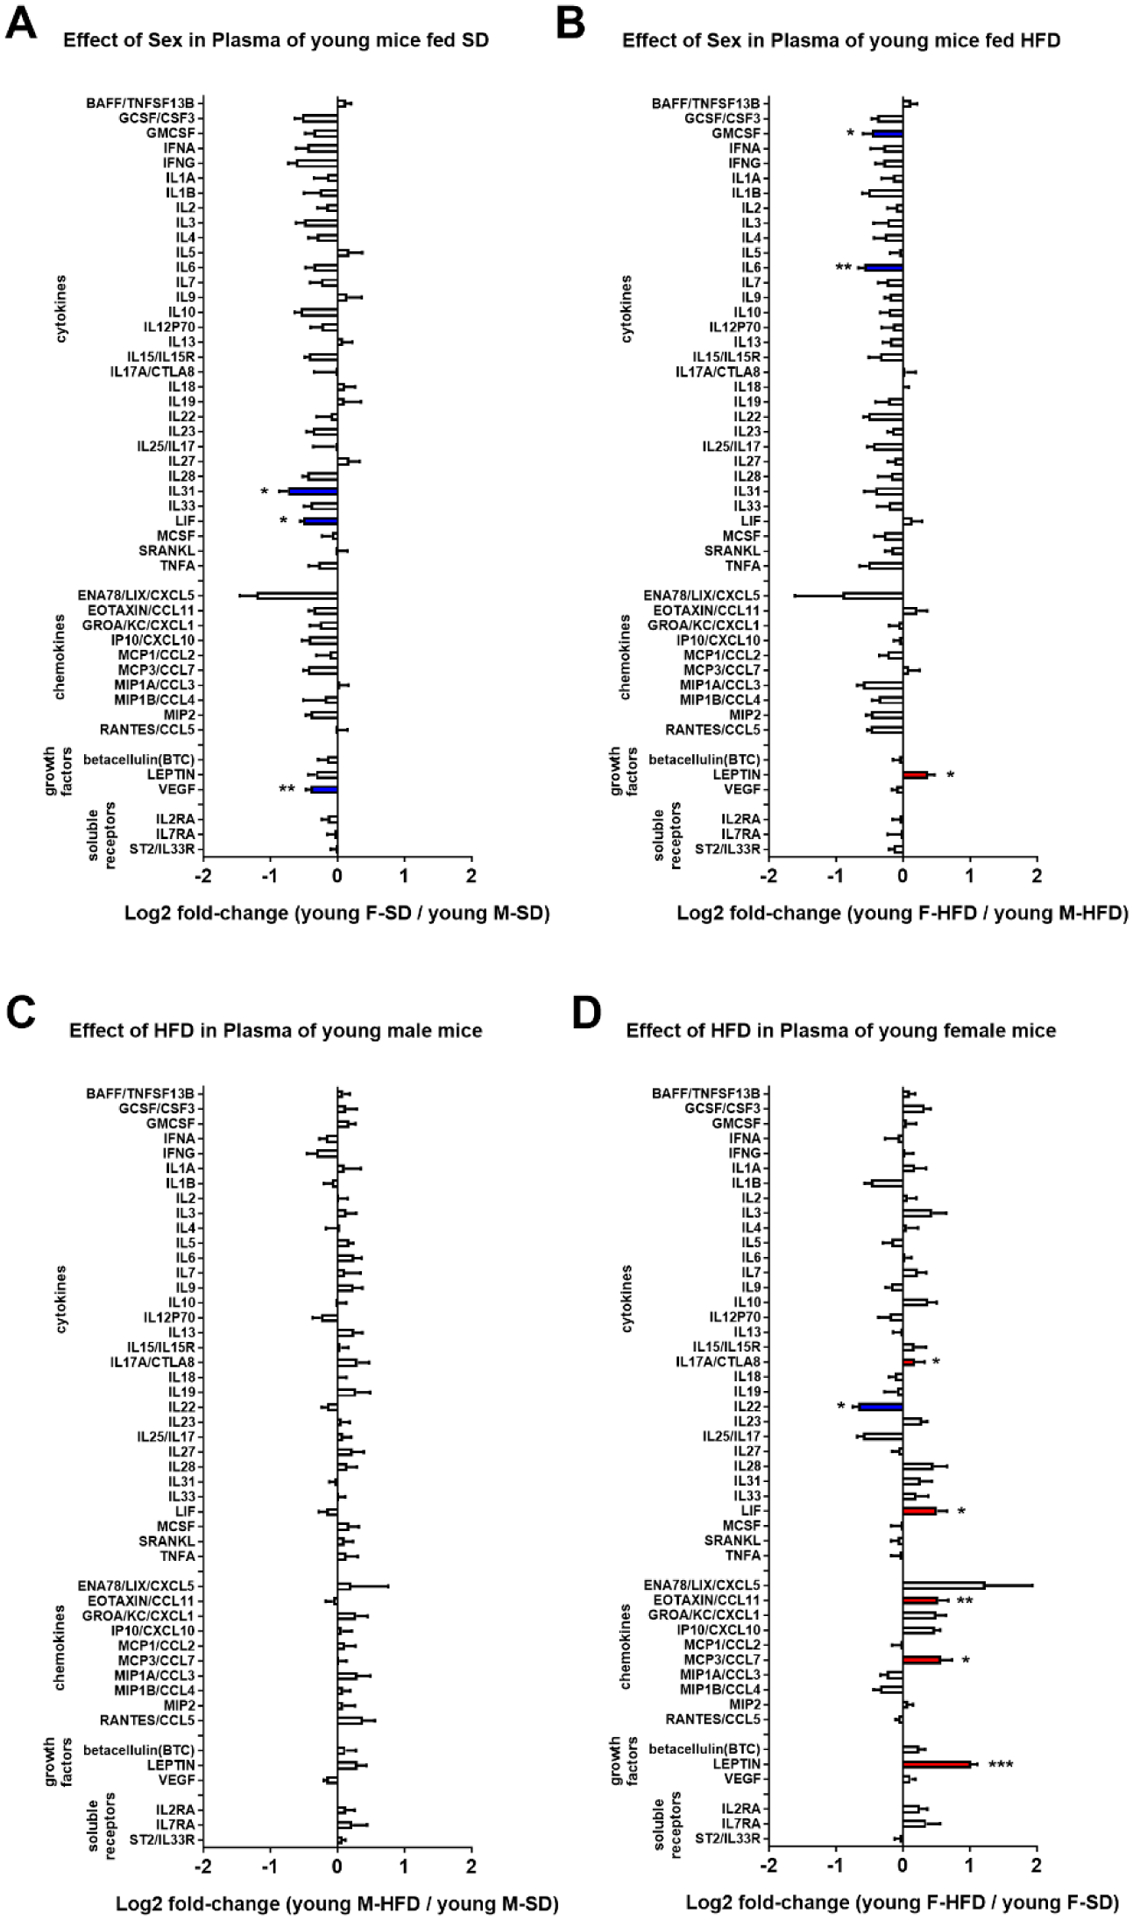
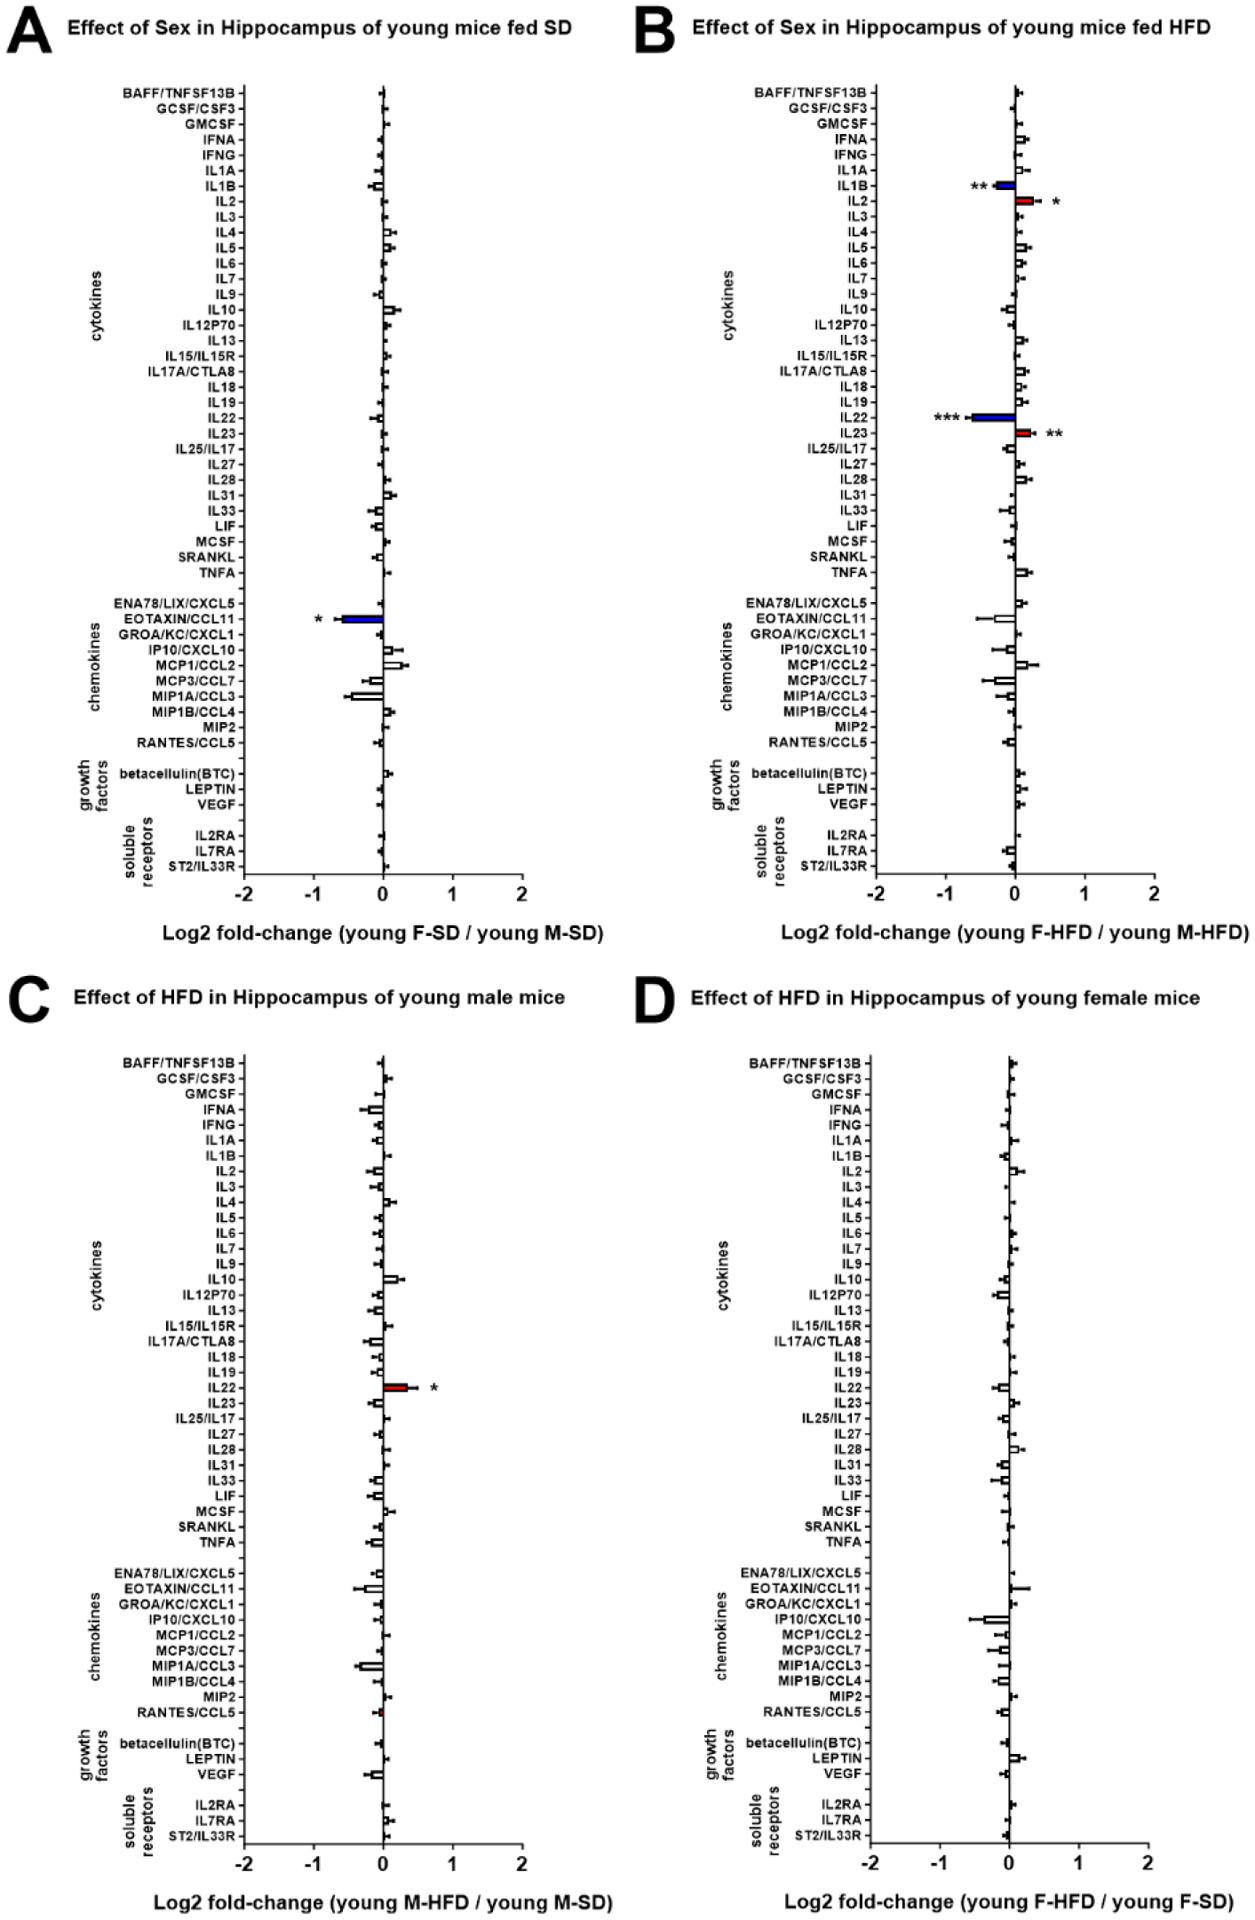
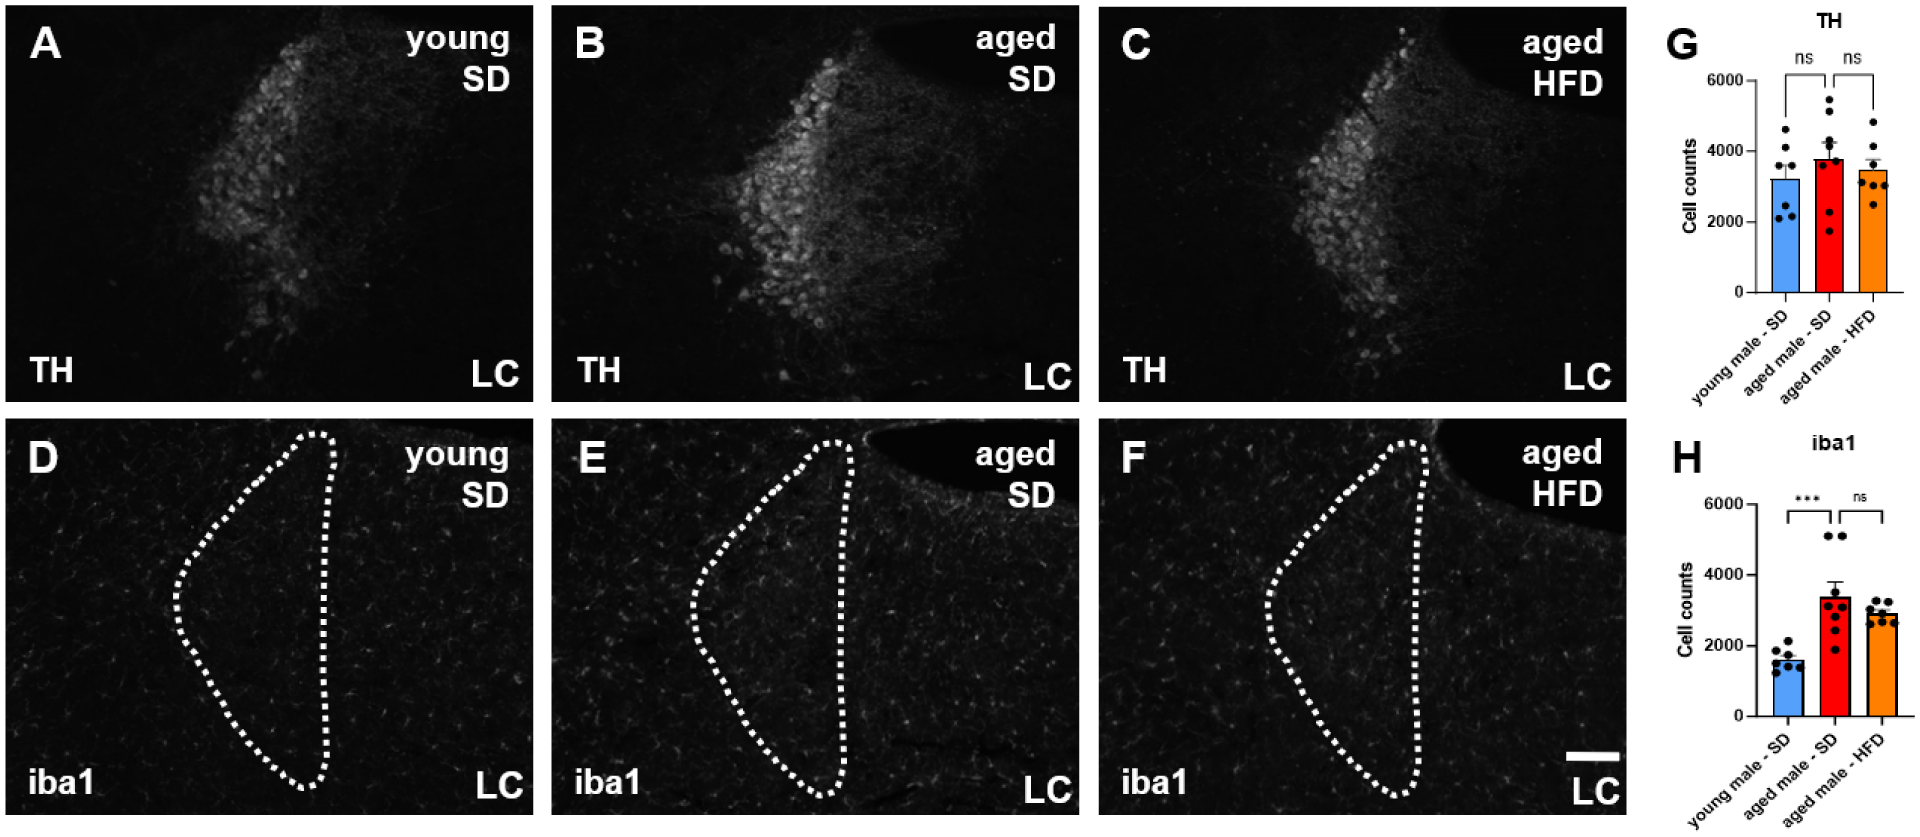
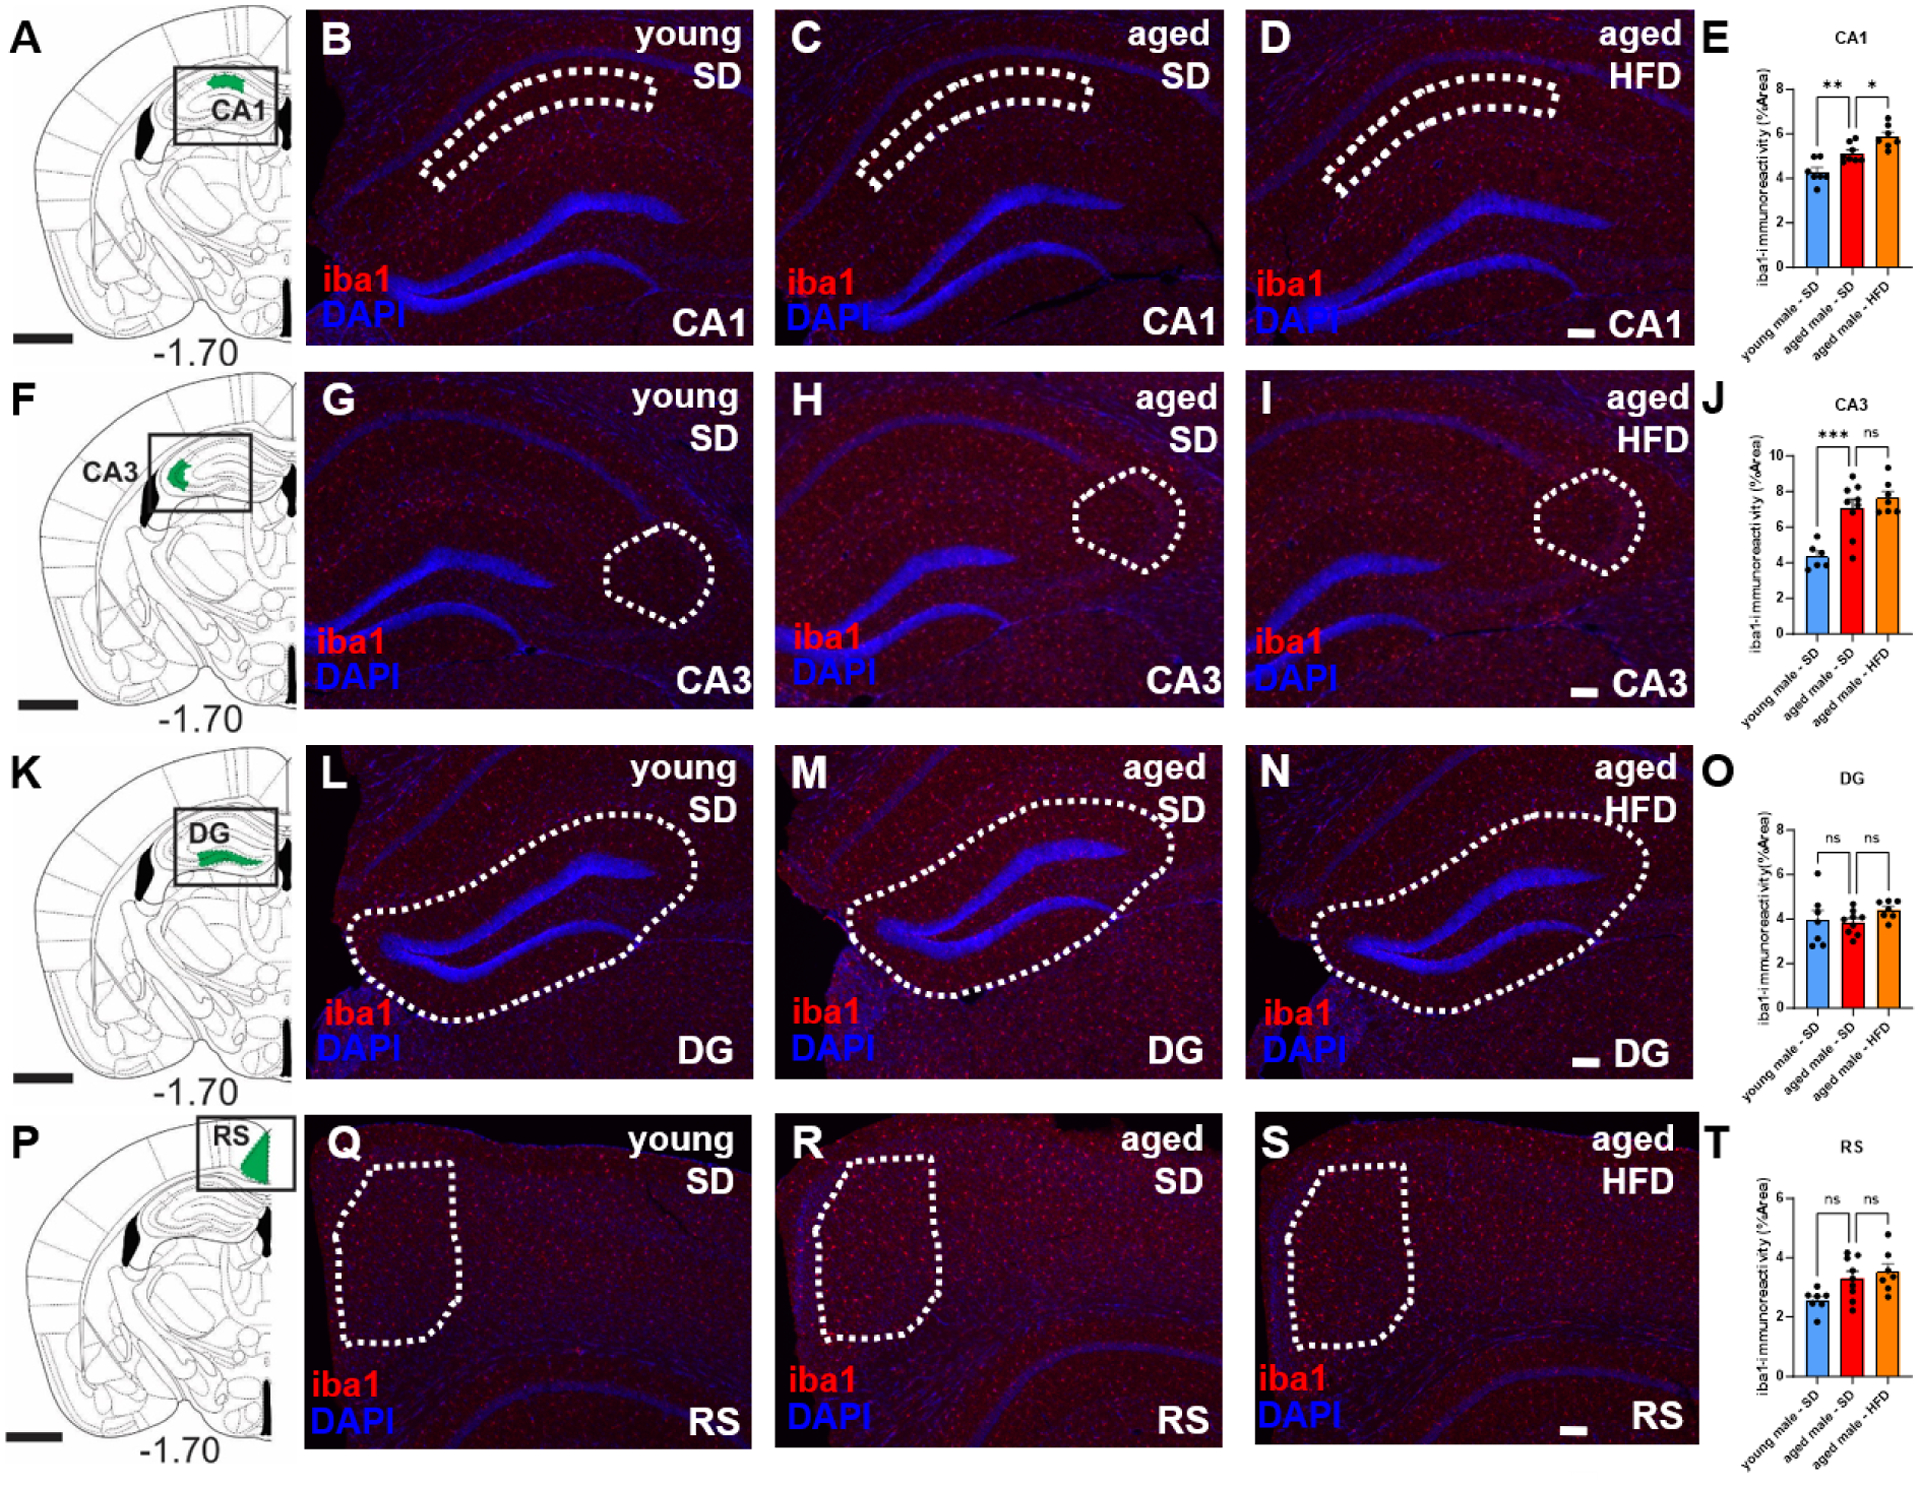
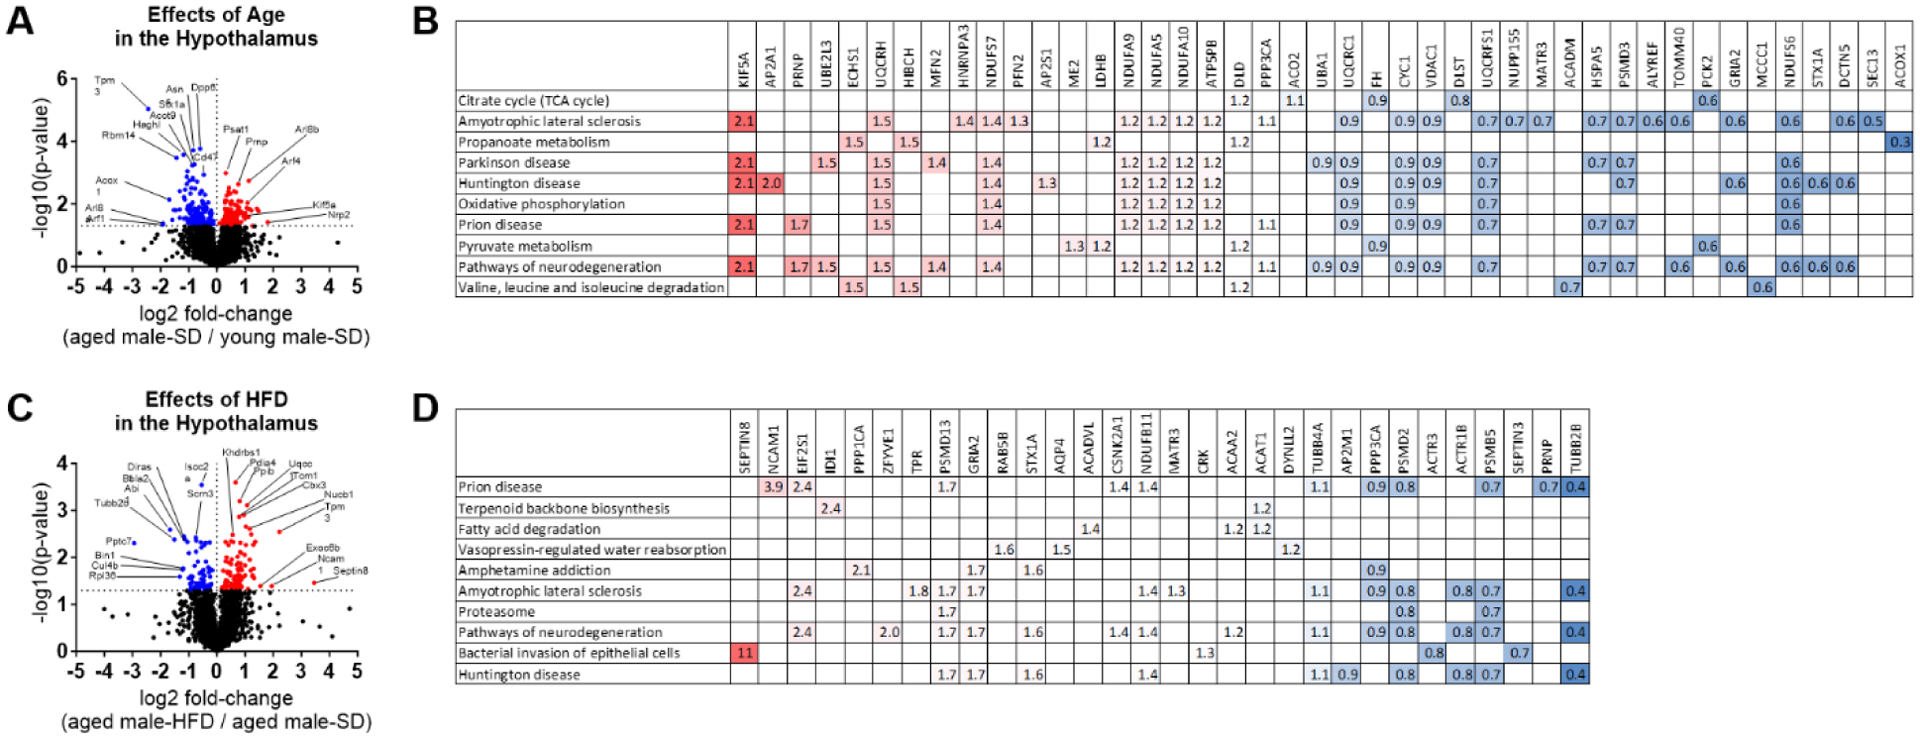
Aging and age-related diseases are associated with cellular stress, metabolic imbalance, oxidative stress, and neuroinflammation, accompanied by cognitive impairment. Lifestyle factors such as diet, sleep fragmentation, and stress can potentiate damaging cellular cascades and lead to an acceleration of brain aging and cognitive impairment. High-fat diet (HFD) has been associated with obesity, metabolic disorders like diabetes, and cardiovascular disease. HFD also induces neuroinflammation, impairs learning and memory, and may increase anxiety-like behavior. Effects of a HFD may also vary between sexes. The interaction between Age- and Sex- and Diet-related changes in neuroinflammation and cognitive function is an important and poorly understood area of research. This study was designed to examine the effects of HFD on neuroinflammation, behavior, and neurodegeneration in mice in the context of aging or sex differences. In a series of studies, young (2-3 months) or old (12-13 months) C57BL/6J male mice or young male and female C57Bl/6J mice were fed either a standard diet (SD) or a HFD for 5-6 months. Behavior was assessed in Activity Chamber, Y-maze, Novel Place Recognition, Novel Object Recognition, Elevated Plus Maze, Open Field, Morris Water Maze, and Fear Conditioning. Post-mortem analyses assessed a panel of inflammatory markers in the plasma and hippocampus. Additionally, proteomic analysis of the hypothalamus, neurodegeneration, neuroinflammation in the locus coeruleus, and neuroinflammation in the hippocampus were assessed in a subset of young and aged male mice. We show that HFD increased body weight and decreased locomotor activity across groups compared to control mice fed a SD. HFD altered anxiety-related exploratory behavior. HFD impaired spatial learning and recall in young male mice and impaired recall in cued fear conditioning in young and aged male mice, with no effects on spatial learning or fear conditioning in young female mice. Effects of Age and Sex were observed on neuroinflammatory cytokines, with only limited effects of HFD. HFD had a more significant impact on systemic inflammation in plasma across age and sex. Aged male mice had induction of microglial immunoreactivity in both the locus coeruleus (LC) and hippocampus an effect that HFD exacerbated in the hippocampal CA1 region. Proteomic analysis of the hypothalamus revealed changes in pathways related to metabolism and neurodegeneration with both aging and HFD in male mice. Our findings suggest that HFD induces widespread systemic inflammation and limited neuroinflammation. In addition, HFD alters exploratory behavior in male and female mice, and impairs learning and memory in male mice. These results provide valuable insight into the impact of diet on cognition and aging pathophysiology.

Keywords: Aging; Behavior; Chemokines; Cytokines; Growth factors; High-fat diet; Inflammation; Learning and memory; Locus coeruleus; Neuroinflammation; Sex differences.


Conflict of interest statement

Declaration of Competing Interest The authors declare that they have no known competing financial interests or personal relationships that could have appeared to influence the work reported in this paper.

Figures

Figure 1.
Figure 1.
Experimental Design illustrates the timing of high-fat diet (HFD) administration and behavioral testing across three studies. Young mice (2–3 months old at start) and aged mice (12–13 months old at start) were administered HFD or standard diet (SD) ad libitum with behavioral testing at indicated timepoints. Testing involved Activity Chamber (AC), Y-maze: Spontaneous Alternation (YM), Novel Place Recognition and Novel Object Recognition (NPR NOR), Elevated Plus Maze (EPM), Open Field (OF), Morris Water Maze (MWM), and Fear Conditioning (FC). Tissue was collected at end of each study.
Figure 2.
Figure 2.
Body weight. Line graphs depict change in body weight across the studies. A) Age × Diet: young and aged mice on standard diet (SD) or high-fat diet (HFD) (young M-SD, n=17; young M-HFD, n=10; aged M-SD, n=19; aged M-HFD, n=19). B) Sex × Diet: young males and females on SD or HFD (n=10).
Figure 3.
Figure 3.
Effects of Age and HFD on locomotor and exploratory behavior. A-D) Open Field: A) Representative tracks for young and aged male mice fed a standard diet (SD) or a high-fat diet (HFD). B) Total Distance moved in the Open Field C-D) Distance Moved in Periphery or Center as a percent of Total Distance Moved, adjusting for individual differences in Total Distance Moved. E-H) Activity Chamber: E) Representative tracks. F) Total Distance moved in the Open Field. G-H) Distance Moved in the Periphery and Center, adjusted for individual differences in Total Distance Moved. I-L) Elevated Plus Maze: I) Representative tracks in EPM. J) Total Distance moved in the EPM. K-L) Distance Moved in the Open and Closed Arms, adjusted for individual differences in Total Distance Moved. * indicates p < .05, ** p < .01, *** p < .001, **** p < .0001; Main Effects of two-way ANOVA or Sidak’s posthoc comparison of means following two-way ANOVA.
Figure 4.
Figure 4.
Effects of Sex and HFD on locomotor and exploratory behavior. A-D) Open Field: A) Representative tracks for male and female mice fed a standard diet (SD) or a high-fat diet (HFD). B) Total Distance moved in the Open Field (C-D) Distance Moved in Periphery or Center as a percent of Total Distance Moved, adjusting for individual differences in Total Distance Moved. E-H) Activity Chamber: E) Representative tracks. F) Total Distance moved in the Open Field. G-H) Distance Moved in the Periphery and Center, adjusted for individual differences in Total Distance Moved. I-L) Elevated Plus Maze: I) Representative tracks in EPM. J) Total Distance moved in the EPM. K-L) Distance Moved in the Open and Closed Arms, adjusted for individual differences in Total Distance Moved. * indicates p < .05, ** p < .01, *** p < .001, **** p < .0001; Main Effects of two-way ANOVA or Sidak’s posthoc comparison of means following two-way ANOVA.
Figure 5.
Figure 5.
Effects of Age and HFD in male mice on learning and memory in the Morris Water Maze. Line graphs depict the average daily A) Escape Latency, B) Distance Moved, C) Thigmotaxis, and D) Velocity across daily trials for 4 days of Hidden Platform Training, 3 days of Reversal Hidden Platform Training, and the Visual Platform Test. E-F) Bar graphs indicate time spent in the target vs non-target quadrants (TQ) during Probe 1 and 2 trials. Posthoc comparisons (A-D) are indicated as * (effect of HFD in young; 6 mo SD vs. 6 mo HFD), # (effect of HFD in Age; 16 mo SD vs. 16 mo HFD), & (effect of Age in SD; 6 mo SD vs 16 mo SD), $ (effect of Age in HFD; 6 mo HFD vs 16 mo HFD). * indicates p < 0.05, ** p < 0.01, *** p < 0.001, **** p < .0001; Tukey’s posthoc comparisons (A-D) or pair-wise comparison of target vs non-target within each treatment (E-F).
Figure 6.
Figure 6.
Effects of Sex and HFD on learning and memory in the Morris Water Maze. Line graphs depict the average daily A) Escape Latency, B) Distance Moved, C) Thigmotaxis, and D) Velocity across daily trials for 3 days of Hidden Platform Training, 3 days of Reversal Hidden Platform Training, and the Visual Platform Test. (E-F) Bar graphs indicate time spent in the target vs non-target quadrants (TQ) during Probe 1 and 2 trials. Posthoc comparisons (A-D) are indicated as * (effect of HFD in male; male SD vs. male HFD), # (effect of HFD in female; female SD vs. female HFD), & (effect of Sex in SD; male SD vs female SD), $ (effect of Sex in HFD; male HFD vs female HFD). * indicates p < 0.05, ** p < 0.01, *** p < 0.001, **** p < .0001; Tukey’s posthoc comparisons (A-D) or pair-wise comparison of target vs non-target within each treatment (E-F).
Figure 7.
Figure 7.
Effects of Age and HFD in male mice on learning and memory in Fear Conditioning. (A-B) All mice learned to associate tone with shock during training. (C-D) Bar graphs show C) % freezing minute by minute and D) average freezing during exposure to the context. (E-F) Bar graphs show E) % freezing during each Intertone Interval (ITI) and F) average freezing during ITIs. * indicates p < 0.05, ** p < 0.01, *** p < 0.001, **** p < .0001; Main Effects of two-way ANOVA or Tukey’s posthoc comparison of means following two-way ANOVA.
Figure 8.
Figure 8.
Effects of Sex and HFD on learning and memory in Fear Conditioning. (A-B) All mice learned to associate tone with shock during training. (C-D) Bar graphs depict C) % freezing minute by minute and D) average freezing during exposure to the context. (E-F) Bar graphs depict E) % freezing during each Intertone Interval (ITI) and G) average freezing during ITIs. * indicates p < 0.05, ** p < 0.01, *** p < 0.001, **** p < .0001; Main Effects of two-way ANOVA or Tukey’s posthoc comparison of means following two-way ANOVA.
Figure 9.
Figure 9.
Plasma effects of Age and HFD on cytokines, chemokines, growth factors, and soluble receptors. Fold-change graphs (mean ± SEM) depict A) the effects of Age in male mice fed SD (aged M-SD/young M-SD; n=19), B) the effects of Age in male mice fed HFD (aged M-HFD/young M-HFD; n=16), C) the effects of HFD in young male mice (young M-HFD/young M-SD; n=9), and D) the effects of HFD in aged male mice (aged M-HFD/aged M-SD; n=16). Main Effects of Age and HFD on plasma are reported in Supplemental Data (Figure S5). All data for each individual factor is shown in column bar graphs in Supplemental Data (Figure S7) and raw data for each factor provided in Supplemental Table S5. * indicates p < .05, ** p < .01, *** p < .001; Sidak’s posthoc comparison of means following main effects with two-way ANOVA (Age × Diet).
Figure 10.
Figure 10.
CNS effects of Age and HFD on cytokines, chemokines, growth factors, and soluble receptors in the hippocampus. Fold-change graphs (mean ± SEM) depict A) the effects of Age in male mice fed SD (aged M-SD/young M-SD; n=18), B) the effects of Age in male mice fed HFD (aged M-HFD/young M-HFD; n=17), C) the effects of HFD in young male mice (young M-HFD/young M-SD; n=9), and D) the effects of HFD in aged male mice (aged M-HFD/aged M-SD; n=17). Main Effects of Age and HFD on hippocampus are reported in Supplemental Data (Figure S6). All data for each individual factor is shown in column bar graphs in Supplemental Data (Figure S8) and raw data for each factor provided in Supplemental Table S6. * indicates p < .05, ** p < .01, *** p < .001; Sidak’s posthoc comparison of means following main effects with two-way ANOVA (Age × Diet).
Figure 11.
Figure 11.
Plasma effects of Sex and HFD on cytokines, chemokines, growth factors, and soluble receptors. Fold-change graphs (mean ± SEM; n=10) depict A) the effects of Sex in young mice fed SD (young F-SD/young M-SD), B) the effects of Sex in young mice fed HFD (young F-HFD/young M-HFD), C) the effects of HFD in young male mice (young M-HFD/young M-SD), and D) the effects of HFD in young female mice (young F-HFD/young F-SD). Main Effects of Sex and HFD on plasma are reported in Supplemental Data (Figure S5). All data for each individual factor is shown in column bar graphs in Supplemental Data (Figure S9) and raw data for each factor provided in Supplemental Table S7. * indicates p < .05, ** p < .01, *** p < .001; Sidak’s posthoc comparison of means following main effects with two-way ANOVA (Sex × Diet).
Figure 12.
Figure 12.
CNS effects of Sex and HFD on cytokines, chemokines, growth factors, and soluble receptors in the hippocampus. Fold-change graphs (mean ± SEM; n=10) depict A) the effects of Sex in young mice fed SD (young F-SD/young M-SD), B) the effects of Sex in young mice fed HFD (young F-HFD/young M-HFD), C) the effects of HFD in young male mice (young M-HFD/young M-SD), and D) the effects of HFD in young female mice (young F-HFD/young F-SD). Main Effects of Sex and HFD on hippocampus are reported in Supplemental Data (Figure S6). All data for each individual factor is shown in column bar graphs in Supplemental Data (Figure S10) and raw data for each factor provided in Supplemental Table S8. * indicates p < .05, ** p < .01, *** p < .001; Sidak’s posthoc comparison of means following main effects with two-way ANOVA (Sex × Diet).
Figure 13.
Figure 13.
Effects of Age and HFD in aged mice on TH-immunoreactive cell counts and iba1-immunoreactive (monocyte or microglia) cell counts in the locus coeruleus (LC) as assessed by stereological cell counting. (A-F) Representative images of (A-C) tyrosine hydroxylase (TH)-immunoreactive cells and (D-F) iba1-immunoreactive cells in the LC of young (7 months) mice fed a standard diet (SD), aged (17 months) mice fed a SD, and aged mice fed a high-fat diet (HFD). The white scale bar equals 100 micrometers. (G) There were no significant differences in the number of TH-containing neurons between groups. (H) There was a significant increase in the microglia population in aged-SD mice compared to young-SD mice. There was no effect of HFD in aged mice on the number of microglia in the LC. * indicates p < .05, ** p < .01, *** p < .001, **** p < .0001; Dunnett’s posthoc comparisons following one-way ANOVA.
Figure 14.
Figure 14.
Effects of Age and HFD in aged mice on iba1-immunoreactive (monocyte or microglia) % area in the (A,F) CA1 and CA3 regions of the hippocampus, (K) the dentate gyrus (DG), (P) and the retrosplenial cortex (RS). (B-E, G-I, L-N, Q-S) Representative images of iba1-immunoreactive cells in each region with the outlined area of quantification in young (7 months) mice fed a standard diet (SD), aged (17 months) mice fed a SD, and aged mice fed a high-fat diet (HFD). The white scale bar equals 100 micrometers. (E, J, O, T) Scatter bar graphs indicate quantification of % area for iba1-immunoreactivity in each region across the treatment groups. * indicates p < .05, ** p < .01, *** p < .001, **** p < .0001; Dunnett’s posthoc comparisons following one-way ANOVA.
Figure 15.
Figure 15.
Volcano plots depict the effects of Age and HFD on the hypothalamic proteome in terms of fold-change and significance for proteins with proteomics. In hypothalamus (+3000 proteins detected): (A) 237 proteins were identified to be up- (red) or down-regulated (blue) with age (fold change as 17m/7 months; p-value cutoff p < .05; −Log10(p-value) > 1.3). (B) Clustergram analysis identified age-modulated proteins in specific pathways. Blue indicates downregulation, and red indicates upregulation. Pathways impacted by aging in the hypothalamus include metabolic pathways, oxidative phosphorylation, and pathways related to neurodegeneration as indicated by KEGG analysis. (C) 155 proteins were identified to be up- (red) or down-regulated (blue) with HFD (p < .05; −Log10(p-value) > 1.3;). (D) Clustergram analysis identified HFD-modulated proteins in specific pathways. Pathways modulated with HFD include metabolic pathways and pathways related to neurodegeneration by KEGG analysis. Numbers in clustergram indicate fold-change (17m/7m or 17m HFD/17m SD) for each protein.

Similar articles

Cited by

References

    1. Amrhein V, et al., 2019. Scientists rise up against statistical significance. Nature. 567, 305–307. - PubMed
    1. Ardestani PM, et al., 2017. Modulation of neuroinflammation and pathology in the 5XFAD mouse model of Alzheimer’s disease using a biased and selective beta-1 adrenergic receptor partial agonist. Neuropharmacology. 116, 371–386. - PMC - PubMed
    1. Barrientos RM, et al., 2006. Peripheral infection and aging interact to impair hippocampal memory consolidation. Neurobiol Aging. 27, 723–32. - PubMed
    1. Baruch K, et al., 2013. CNS-specific immunity at the choroid plexus shifts toward destructive Th2 inflammation in brain aging. Proc. Natl. Acad. Sci. U. S. A 110, 2264–2269. - PMC - PubMed
    1. Bou Sleiman M, et al., 2022. Sex- and age-dependent genetics of longevity in a heterogeneous mouse population. Science. 377, eabo3191. - PMC - PubMed

LinkOut - more resources