

The SNP rs6859 in NECTIN2 gene is associated with underlying heterogeneous trajectories of cognitive changes in older adults
- PMID: 38408961
- PMCID: PMC10898142
- DOI: 10.1186/s12883-024-03577-4
The SNP rs6859 in NECTIN2 gene is associated with underlying heterogeneous trajectories of cognitive changes in older adults
Abstract
Background: Functional decline associated with dementia, including in Alzheimer's disease (AD), is not uniform across individuals, and respective heterogeneity is not yet fully explained. Such heterogeneity may in part be related to genetic variability among individuals. In this study, we investigated whether the SNP rs6859 in nectin cell adhesion molecule 2 (NECTIN2) gene (a major risk factor for AD) influences trajectories of cognitive decline in older participants from the Alzheimer's Disease Neuroimaging Initiative (ADNI).
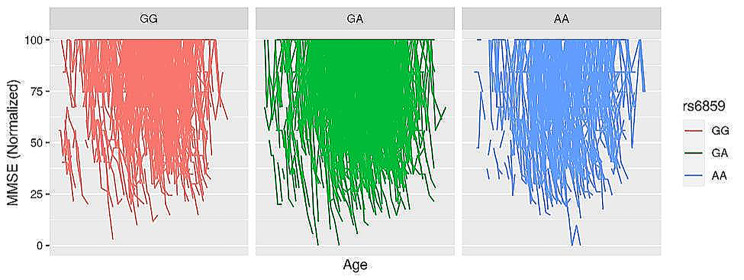
Methods: We retrospectively analyzed records on 1310 participants from the ADNI database for the multivariate analysis. We used longitudinal measures of Mini-Mental State Examination (MMSE) scores in participants, who were cognitively normal, or having AD, or other cognitive deficits to investigate the trajectories of cognitive changes. Multiple linear regression, linear mixed models and latent class analyses were conducted to investigate the association of the SNP rs6859 with MMSE.
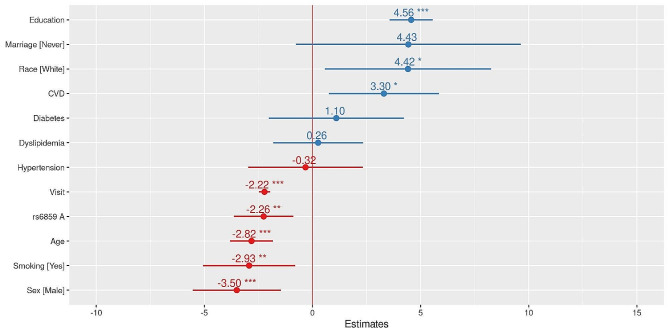
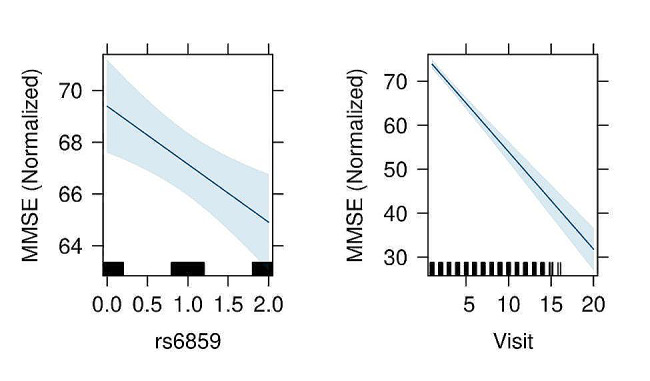
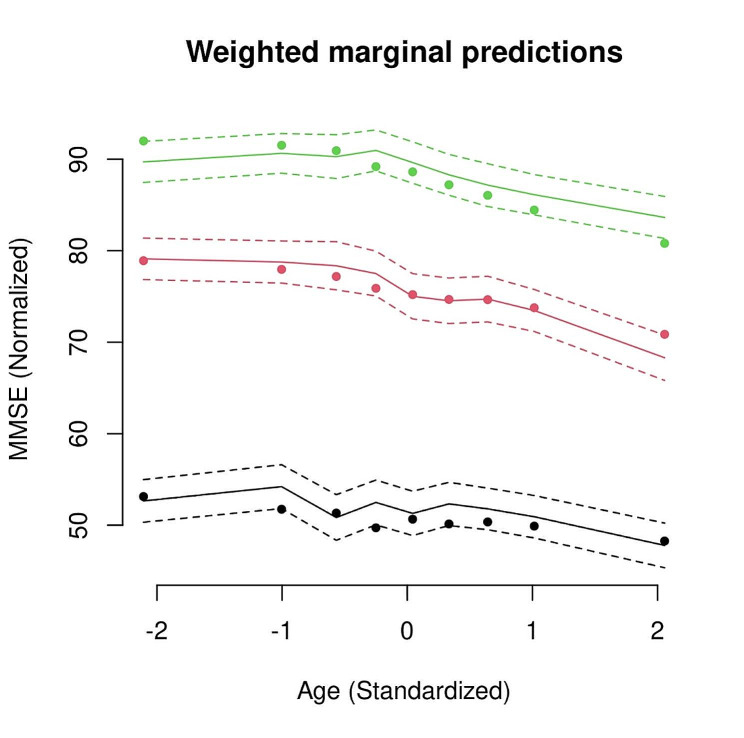
Results: The regression coefficient per one allele dose of the SNP rs6859 was independently associated with MMSE in both cross-sectional (-2.23, p < 0.01) and linear mixed models (-2.26, p < 0.01) analyses. The latent class model with three distinct subgroups (class 1: stable and gradual decline, class 2: intermediate and late decline, and class 3: lowest and irregular) performed best in the posterior classification, 42.67% (n = 559), 21.45% (n = 281), 35.88% (n = 470) were classified as class 1, class 2, and class 3. In the heterogeneous linear mixed model, the regression coefficient per one allele dose of rs6859 - A risk allele was significantly associated with MMSE class 1 and class 2 memberships and related decline; Class 1 (-2.28, 95% CI: -4.05, -0.50, p < 0.05), Class 2 (-5.56, 95% CI: -9.61, -1.51, p < 0.01) and Class 3 (-0.37, 95% CI: -1.62, 0.87, p = 0.55).
Conclusions: This study found statistical evidence supporting the classification of three latent subclass groups representing complex MMSE trajectories in the ADNI cohort. The SNP rs6859 can be suggested as a candidate genetic predictor of variation in modeling MMSE trajectory, as well as for identifying latent classes with higher baseline MMSE. Functional studies may help further elucidate this relationship.
Keywords: Heterogeneity; Latent class; MMSE; NECTIN2; Trajectory analysis; rs6859.
© 2024. The Author(s).
Conflict of interest statement
The authors declare no competing interests.
Figures
Similar articles
-
The association between rs6859 in NECTIN2 gene and Alzheimer's disease is partly mediated by pTau.Front Aging Neurosci. 2024 Aug 6;16:1388363. doi: 10.3389/fnagi.2024.1388363. eCollection 2024. Front Aging Neurosci. 2024. PMID: 39165837 Free PMC article.
-
The association between rs6859 in NECTIN2 gene and Alzheimer's disease is partly mediated by pTau.medRxiv [Preprint]. 2024 Jun 22:2024.06.21.24309310. doi: 10.1101/2024.06.21.24309310. medRxiv. 2024. Update in: Front Aging Neurosci. 2024 Aug 06;16:1388363. doi: 10.3389/fnagi.2024.1388363. PMID: 38947013 Free PMC article. Updated. Preprint.
-
Understanding factors associated with the trajectory of subjective cognitive complaints in groups with similar objective cognitive trajectories.Alzheimers Res Ther. 2023 Nov 22;15(1):205. doi: 10.1186/s13195-023-01348-w. Alzheimers Res Ther. 2023. PMID: 37993894 Free PMC article.
-
Mini-Mental State Examination (MMSE) for the early detection of dementia in people with mild cognitive impairment (MCI).Cochrane Database Syst Rev. 2021 Jul 27;7(7):CD010783. doi: 10.1002/14651858.CD010783.pub3. Cochrane Database Syst Rev. 2021. PMID: 34313331 Free PMC article.
-
The Analysis of Individual Health Trajectories Across the Life Course: Latent Class Growth Models Versus Mixed Models.In: Burton-Jeangros C, Cullati S, Sacker A, Blane D, editors. A Life Course Perspective on Health Trajectories and Transitions [Internet]. Cham (CH): Springer; 2015. Chapter 9. In: Burton-Jeangros C, Cullati S, Sacker A, Blane D, editors. A Life Course Perspective on Health Trajectories and Transitions [Internet]. Cham (CH): Springer; 2015. Chapter 9. PMID: 27683925 Free Books & Documents. Review.
Cited by
-
The association between rs6859 in NECTIN2 gene and Alzheimer's disease is partly mediated by pTau.Front Aging Neurosci. 2024 Aug 6;16:1388363. doi: 10.3389/fnagi.2024.1388363. eCollection 2024. Front Aging Neurosci. 2024. PMID: 39165837 Free PMC article.
-
A Novel Method to Disentangle Tightly Linked Risk and Resilience Genes for Brain Disorders: Application to Alzheimer's Disease.medRxiv [Preprint]. 2025 Feb 27:2025.02.26.25322962. doi: 10.1101/2025.02.26.25322962. medRxiv. 2025. PMID: 40061341 Free PMC article. Preprint.
-
Association of Alzheimer's-Related Gene Variants with Autism Spectrum Disorder: A Case-Control Study in an Iraqi Cohort.J Mol Neurosci. 2025 May 6;75(2):64. doi: 10.1007/s12031-025-02359-y. J Mol Neurosci. 2025. PMID: 40327194
-
Clinical application of sparse canonical correlation analysis to detect genetic associations with cortical thickness in Alzheimer's disease.Front Neurosci. 2024 Sep 24;18:1428900. doi: 10.3389/fnins.2024.1428900. eCollection 2024. Front Neurosci. 2024. PMID: 39381682 Free PMC article.
-
Predicting dementia in people with Parkinson's disease.NPJ Parkinsons Dis. 2025 May 13;11(1):126. doi: 10.1038/s41531-025-00983-4. NPJ Parkinsons Dis. 2025. PMID: 40360514 Free PMC article.
References
-
- Arevalo-Rodriguez I, Smailagic N, Roqué i Figuls M, Ciapponi A, Sanchez-Perez E, Giannakou A, et al. Mini-mental State Examination (MMSE) for the detection of Alzheimer’s disease and other dementias in people with mild cognitive impairment (MCI) Cochrane Database Syst Rev. 2015;2015(3):CD010783. - PMC - PubMed
MeSH terms
Substances
Grants and funding
LinkOut - more resources
Full Text Sources
Medical
Molecular Biology Databases
