

Highly sensitive SERS platform for pathogen analysis by cyclic DNA nanostructure@AuNP tags and cascade primer exchange reaction
- PMID: 38408974
- PMCID: PMC10895721
- DOI: 10.1186/s12951-024-02339-1
Highly sensitive SERS platform for pathogen analysis by cyclic DNA nanostructure@AuNP tags and cascade primer exchange reaction
Abstract
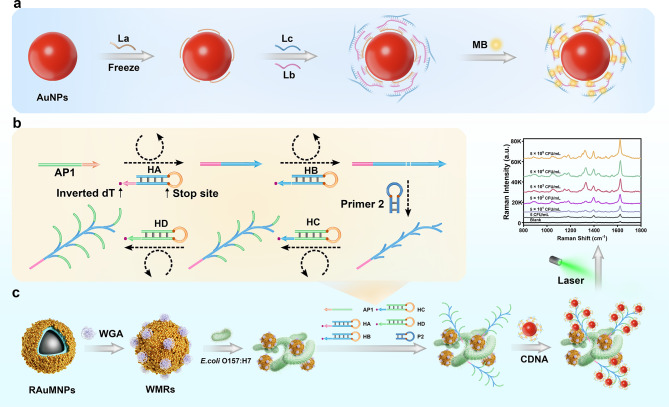
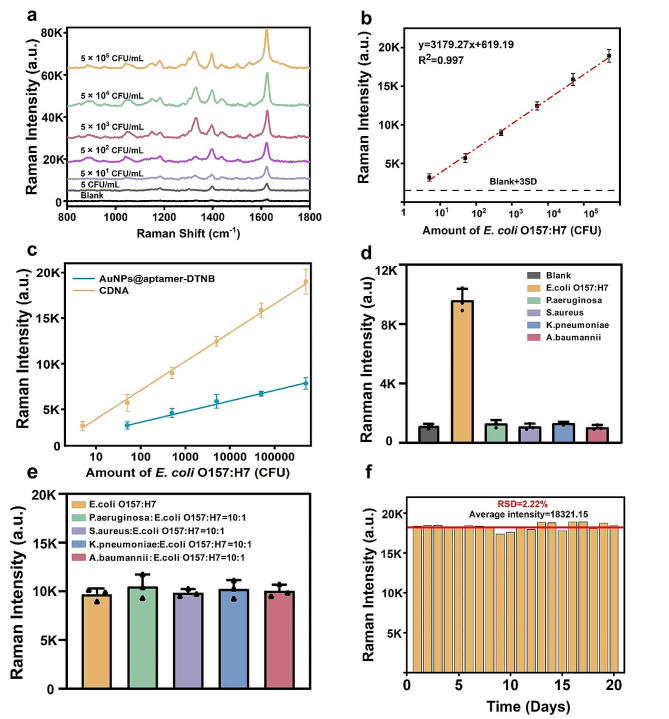
The capacity to identify small amounts of pathogens in real samples is extremely useful. Herein, we proposed a sensitive platform for detecting pathogens using cyclic DNA nanostructure@AuNP tags (CDNA) and a cascade primer exchange reaction (cPER). This platform employs wheat germ agglutinin-modified Fe3O4@Au magnetic nanoparticles (WMRs) to bind the E. coli O157:H7, and then triggers the cPER to generate branched DNA products for CDNA tag hybridization with high stability and amplified SERS signals. It can identify target pathogens as low as 1.91 CFU/mL and discriminate E. coli O157:H7 in complex samples such as water, milk, and serum, demonstrating comparable or greater sensitivity and accuracy than traditional qPCR. Moreover, the developed platform can detect low levels of E. coli O157:H7 in mouse serum, allowing the discrimination of mice with early-stage infection. Thus, this platform holds promise for food analysis and early infection diagnosis.
Keywords: Bacterial detection; Early infection diagnosis; Primer exchange reaction; SERS tags.
© 2024. The Author(s).
Conflict of interest statement
The authors declare no competing interests.
Figures


Similar articles
-
Functionalized AuMBA @Ag Nanoparticles as an Optical and SERS Dual Probe in a Lateral Flow Strip for the Quantitative Detection of Escherichia coli O157:H7.J Food Sci. 2019 Oct;84(10):2916-2924. doi: 10.1111/1750-3841.14766. Epub 2019 Sep 10. J Food Sci. 2019. PMID: 31502678
-
High-throughput, highly sensitive and rapid SERS detection of Escherichia coli O157:H7 using aptamer-modified Au@macroporous silica magnetic photonic microsphere array.Food Chem. 2023 Oct 30;424:136433. doi: 10.1016/j.foodchem.2023.136433. Epub 2023 May 23. Food Chem. 2023. PMID: 37244192
-
An aptamer-exonuclease III (Exo III)-assisted amplification-based lateral flow assay for sensitive detection of Escherichia coli O157:H7 in milk.J Dairy Sci. 2021 Aug;104(8):8517-8529. doi: 10.3168/jds.2020-19939. Epub 2021 Apr 23. J Dairy Sci. 2021. PMID: 33896635
-
Dramatically Enhanced Immunochromatographic Assay Using Cascade Signal Amplification for Ultrasensitive Detection of Escherichia coli O157:H7 in Milk.J Agric Food Chem. 2020 Jan 29;68(4):1118-1125. doi: 10.1021/acs.jafc.9b07076. Epub 2020 Jan 14. J Agric Food Chem. 2020. PMID: 31895982
-
DNA-based hybridization chain reaction and biotin-streptavidin signal amplification for sensitive detection of Escherichia coli O157:H7 through ELISA.Biosens Bioelectron. 2016 Dec 15;86:990-995. doi: 10.1016/j.bios.2016.07.049. Epub 2016 Jul 15. Biosens Bioelectron. 2016. PMID: 27498326
Cited by
-
AI-assisted SERS imaging method for label-free and rapid discrimination of clinical lymphoma.J Nanobiotechnology. 2025 Apr 16;23(1):295. doi: 10.1186/s12951-025-03339-5. J Nanobiotechnology. 2025. PMID: 40241186 Free PMC article.
References
-
- Purmohamad A, Abasi E, Azimi T, Hosseini S, Safari H, Nasiri MJ, Fooladi AAI. Global estimate of Neisseria meningitidis serogroups proportion in invasive meningococcal disease: a systematic review and meta-analysis. Microb Pathogenesis. 2019;134:103571. doi: 10.1016/j.micpath.2019.103571. - DOI - PubMed
-
- Kadri K. Polymerase chain reaction (PCR): Principle and applications. Synth Biology-New Interdisciplinary Sci 2019:1–17.
MeSH terms
Substances
Grants and funding
- 82302571/National Natural Science Foundation of China
- 82002236/National Natural Science Foundation of China
- 82272423/National Natural Science Foundation of China
- 2021A1515220150/GuangDong Basic and Applied Basic Research Foundation
- KJ012021097/Research foundation for advanced talents of Guandong Provincial People's Hospital
LinkOut - more resources
Full Text Sources
Miscellaneous
