. 2024 Feb 26;15(1):1728.
doi: 10.1038/s41467-024-45469-8.

Modern anthropogenic drought in Central Brazil unprecedented during last 700 years

Affiliations

Modern anthropogenic drought in Central Brazil unprecedented during last 700 years

Nicolas Misailidis Stríkis et al. Nat Commun. .

Abstract

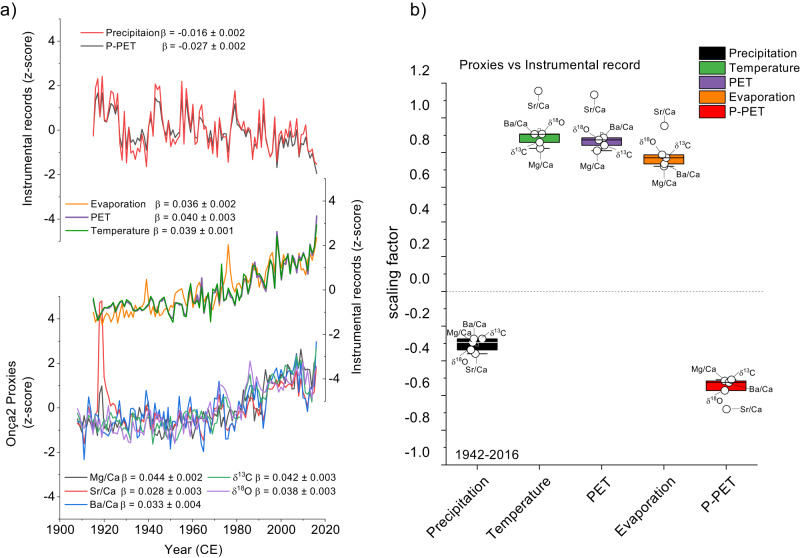
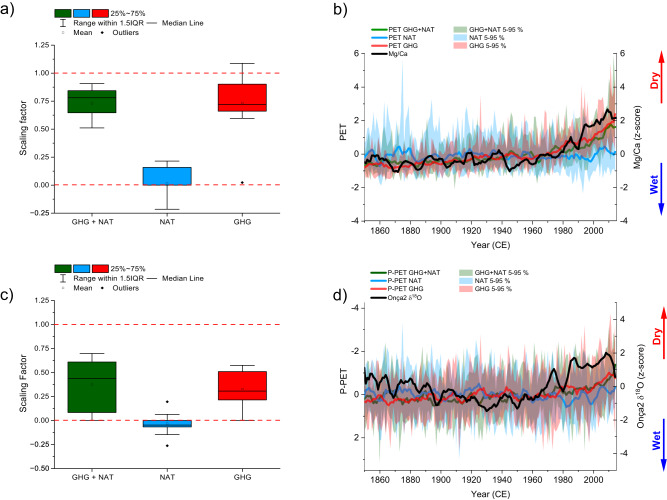
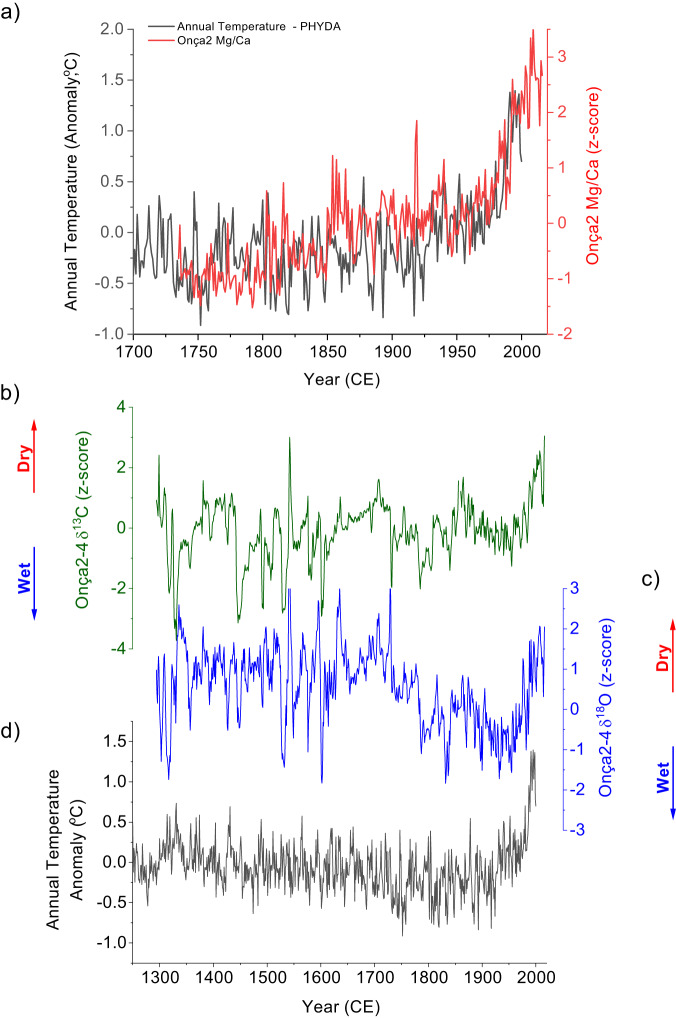
A better understanding of the relative roles of internal climate variability and external contributions, from both natural (solar, volcanic) and anthropogenic greenhouse gas forcing, is important to better project future hydrologic changes. Changes in the evaporative demand play a central role in this context, particularly in tropical areas characterized by high precipitation seasonality, such as the tropical savannah and semi-desertic biomes. Here we present a set of geochemical proxies in speleothems from a well-ventilated cave located in central-eastern Brazil which shows that the evaporative demand is no longer being met by precipitation, leading to a hydrological deficit. A marked change in the hydrologic balance in central-eastern Brazil, caused by a severe warming trend, can be identified, starting in the 1970s. Our findings show that the current aridity has no analog over the last 720 years. A detection and attribution study indicates that this trend is mostly driven by anthropogenic forcing and cannot be explained by natural factors alone. These results reinforce the premise of a severe long-term drought in the subtropics of eastern South America that will likely be further exacerbated in the future given its apparent connection to increased greenhouse gas emissions.


Conflict of interest statement

The authors declare no competing interests.

Figures

Fig. 1
Fig. 1. Study site location and the local hydrologic balance.
a Location of the study site and the meteorological and fluviometric stations from the Instituto Nacional de Meteorologia (INMET) and the Agência Nacional de Águas (ANA), respectively, used to calculate streamflow, regional precipitation and hydrologic balance (P-PET index). Satellite image of the Global map: Map data ©2015 Google. Also, see Supplementary Table S1 for station locations. b Comparison between time series of (top): z-scored regional precipitation (mean values from INMET and ANA meteorological station, green line), (middle): hydrologic balance calculated as precipitation—potential evapotranspiration (P-PET) (blue line) and (bottom): z-scored streamflow of individual rivers (thin colored lines) and their arithmetic median (thick black line) of the surrounding drainage basin. Red lines indicate the linear trend calculated from 1979 to 2016. All regression coefficients (β) are statistically significant at P < 0.001; c comparison between monthly mean regional temperature anomalies, averaged over 13°–17°S – 42.5°–46.5°W, derived from gridded ground-based station data and from CRU TS 4.06 temperature data.
Fig. 2
Fig. 2. Cave atmosphere evaporative effects on stable isotopes.
a Evaporative effect on isotopes from cave drip water from Onça Cave: Comparison between δ18O and δD of monthly local rainfall (Januária INMET Station, this study) and cave drip water from five monitoring sites (P1 to P5) (this study). The dashed blue line represents the local meteoric water line (LMWL). The black line represents the drip line from well-ventilated Onça Cave. b, c Comparison between δ18O and δ13C from the Onça2 speleothem and regional evaporation (1914–2016) obtained from monthly mean data, averaged over the domain 13°–17° S and 43°–45° W (Supplementary Table S1).
Fig. 3
Fig. 3. Comparison between geochemical proxies and environmental drivers derived from local meteorological stations.
a comparison between z-scored (between 1915 and 2016) data from geochemical proxies (Mg/Ca, Sr/Ca, Ba/Ca, δ18O, and δ13C) with instrumental records of regional temperature, precipitation, potential evaporation, potential evapotranspiration (PET) and P-PET index. b Whisker box plots of regression coefficients between geochemical proxies and main environmental drivers between 1942 and 2014 using a smoothed 5-year running mean: precipitation (black), temperature (green), potential evapotranspiration (purple), potential evaporation (orange) and precipitation potential evapotranspiration (red). The slopes of the proxy time series trends after 1942 (determined using a regime-shift test) are represented by regression coefficients (β) and are statistically significant at P < 0.001. Temperature data are derived from (CRU TS 4.06 at 13°–17°S; 42.5°–46.5°W), precipitation and evaporative potential are derived from INMET and ANA meteorological stations shown in Fig. 1. Potential evapotranspiration was calculated using the Thornthwaite (1948) equation from temperature data and adjusted to Penman–Monteith (FAO-56) using monthly coefficient corrections according to Aschonitis.
Fig. 4
Fig. 4. Detection and attribution analysis.
a Scaling factors for simulated ensemble (PET) versus speleothem Mg/Ca in natural and anthropogenic greenhouse gas (GHG + NAT), natural forcings only (NAT) and anthropogenic greenhouse gas only (GHG), experiments from DAMIP/CMIP6 earth system models. Lower and upper box boundaries determine the 25th and 75th percentiles, respectively, while the lower and upper whisker boundaries determine the 5th and 95th percentiles. b Five-year running mean simulated PET time series from DAMIP/CMIP6 ensemble mean (solid lines) for natural and anthropogenic greenhouse gas (GHG + NAT), natural forcings only (NAT) and anthropogenic greenhouse-gas only (GHG) experiments. The 5–95% range of the model spread is presented as shaded areas; c, d present similar tests as shown in (a, b), respectively, but comparing speleothem δ18O record with simulated hydrologic balance P-PET calculated from DAMIP/CMIP6 experiments. Source data are provided as a Source Data file.
Fig. 5
Fig. 5. Onça speleothem record vs. reconstructed annual mean temperature.
a comparison between the ensemble mean annual surface temperature anomaly for 12°–16° S to 41°–47° W from PHYDA with Mg/Ca from Onça2 speleothem; bd same as in the (a) but using δ13C and δ18O respectively, from the composite from Onça2 and Onça4 speleothems. High δ13C, δ18O, and Mg/Ca values indicate highly evaporative conditions, driven by reduced recharge, lower cave relative humidity and warmer temperatures.

References

    1. Milly PCD, Dunne KA, Vecchia AV. Global pattern of trends in streamflow and water availability in a changing climate. Nature. 2005;438:347–350. doi: 10.1038/nature04312. - DOI - PubMed
    1. Dai, A. Characteristics and trends in various forms of the Palmer Drought Severity Index during 1900-2008. J. Geophys. Res. Atmos. 116, D12115 (2011).
    1. Dai A. Increasing drought under global warming in observations and models. Nat. Clim. Chang. 2012;3:52–58. doi: 10.1038/nclimate1633. - DOI
    1. Ault TR. On the essentials of drought in a changing climate. Science. 2020;368:256–260. doi: 10.1126/science.aaz5492. - DOI - PubMed
    1. Chagas VBP, Chaffe PLB, Blöschl G. Climate and land management accelerate the Brazilian water cycle. Nat. Commun. 2022;13:5136. doi: 10.1038/s41467-022-32580-x. - DOI - PMC - PubMed

LinkOut - more resources