. 2024 Feb 26;15(1):1718.
doi: 10.1038/s41467-024-45984-8.

Type 1 interferons and Foxo1 down-regulation play a key role in age-related T-cell exhaustion in mice

Affiliations

Type 1 interferons and Foxo1 down-regulation play a key role in age-related T-cell exhaustion in mice

Aurélie Durand et al. Nat Commun. .

Abstract

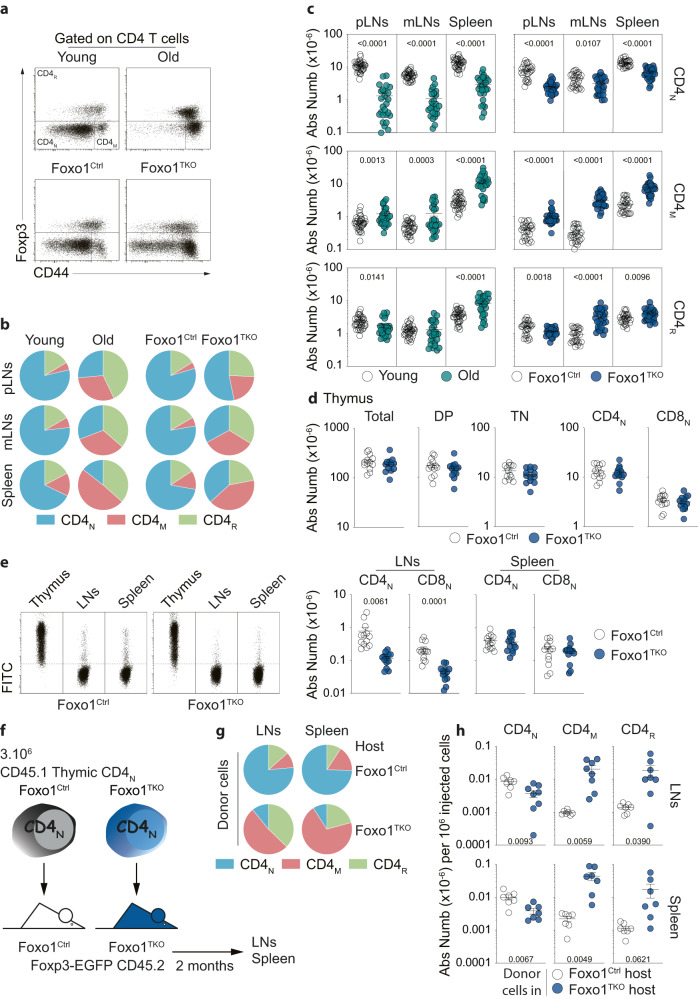
Foxo family transcription factors are critically involved in multiple processes, such as metabolism, quiescence, cell survival and cell differentiation. Although continuous, high activity of Foxo transcription factors extends the life span of some species, the involvement of Foxo proteins in mammalian aging remains to be determined. Here, we show that Foxo1 is down-regulated with age in mouse T cells. This down-regulation of Foxo1 in T cells may contribute to the disruption of naive T-cell homeostasis with age, leading to an increase in the number of memory T cells. Foxo1 down-regulation is also associated with the up-regulation of co-inhibitory receptors by memory T cells and exhaustion in aged mice. Using adoptive transfer experiments, we show that the age-dependent down-regulation of Foxo1 in T cells is mediated by T-cell-extrinsic cues, including type 1 interferons. Taken together, our data suggest that type 1 interferon-induced Foxo1 down-regulation is likely to contribute significantly to T-cell dysfunction in aged mice.


Conflict of interest statement

The authors declare no competing interests.

Figures

Fig. 1
Fig. 1. Foxo1 is gradually down-regulated in T cells with age.
a Cell suspensions from the spleen of a 3-month-old mouse (Young adult) and a 22-month-old mouse (Old) were first stained separately with anti-CD45 antibodies conjugated to different fluorochromes and then mixed before further staining. Foxo1 and Foxo3 fluorescence histograms of the indicated T-cell subsets are shown for representative mice (left panel). Relative Mean Fluorescence Intensities (MFIs) were calculated by dividing the MFI of a given T-cell subset of the old mouse by the MFI of the same T-cell subset of the barcoded young adult mouse (right panel). b A cohort of female mice was bled at different ages and blood cells were mixed with cells from 3-month-old female mice before revealing Foxo1 and Foxo3 expression. Of note, before mixing them, blood cells were barcoded with anti-CD45 antibodies conjugated to different fluorochromes. Relative MFIs are shown for the indicated T-cell subsets. c phospho-Foxo (pFoxo) and phospho-AKT (pAKT) fluorescence histograms of the indicated T-cell subsets are shown for representative mice (left panel). Relative MFIs were calculated by dividing the MFI of a given T-cell subset of the old mouse by the MFI of the same T-cell subset of the barcoded young adult mouse (right panel). d Relative expression of pFoxo by the indicated T-cell subsets from the spleen of old mice as a function of pAKT relative expression. e Volcano plot representation of the transcriptomic signature of CD4N cells from aged versus young adult mice. f The relative expression of Foxo1 and Foxo3 mRNAs was directly derived from the obtained signature and was plotted as Mean ± SEM (n = 3 Young adult mice; n = 4 old mice). g, h A list of genes up- and down-regulated in CD4N cells from Foxo1TKO mice compared with CD4N cells from Foxo1Ctrl mice was also determined (p value of < 0.05 and fold change > 1.5 or <−1.5, see Supplementary Data 1). The expression of these genes by CD4 TN cells as a function of mouse age was visualized using the Volcano (g) or GSEA (h) plot. Quantifications are represented as Means ± SEM. The significance of differences between two series of results was assessed using Student’s unpaired t test (ac, f). For assessing correlations, Pearson correlation (two-sided test, coefficient, and 95% confidence intervals) was used (d). The p-values for the GSEA test statistics are calculated by permutation (h). Significant (p < 0.05) or almost significant (0.05 < p < 0.10) p-values are indicated. Source data are provided as a Source Data file.
Fig. 2
Fig. 2. Similar distribution of CD4 T-cell subsets in the SLOs of old WT and young adult Foxo1TKO mice.
a Foxp3/CD44 representative dot-plots are shown for spleen CD4 T cells from the indicated representative mice. b Distribution of CD4N, CD4M, and CD4R cells among CD4 T cells in the indicated SLOs (pLNs (peripheral Lymph Nodes), mLNs (mesenteric Lymph Nodes) and Spleen) of young adult and old WT mice versus young adult Foxo1Ctrl and Foxo1TKO mice. c Total cell numbers of CD4N, CD4M and CD4R cells recovered from the SLOs of the indicated mice. d Absolute cell numbers of total, double-positive (CD4+CD8+), triple-negative (CD4- CD8- TCRβ-), CD4N and CD8N thymocytes from 1-month-old Foxo1Ctrl and Foxo1TKO mice. e 1-month-old Foxo1Ctrl and Foxo1TKO mice were injected intrathymically with FITC and sacrificed 16 h later. FITC/FSC representative dot-plots are shown for CD4 T cells from the spleen, lymph nodes, and the thymus of representative mice (left panel). Absolute cell numbers of FITC+ CD4N and CD8N cells from the spleen and lymph nodes (right panel). fh 3.106 CD4N cells from the thymus of 1-month-old CD45.1 Foxo1TKO or Foxo1Ctrl mice were injected i.v. into 1-month-old CD45.2 Foxo1TKO or Foxo1Ctrl mice respectively. Diagram illustrating the experimental model (f). Distribution of CD4N, CD4M, and CD4R cells among donor CD4 T cells recovered from the indicated SLOs of recipient mice (g). Absolute cell numbers of CD4N, CD4M, and CD4R donor cells recovered from the indicated SLOs of recipient mice per 106 injected cells (h). Quantifications are represented as Means ± SEM. The significance of differences between two series of results was assessed using Student’s unpaired t test (ce, h). Significant (p < 0.05) or almost significant (0.05 < p < 0.10) p-values are indicated. Source data are provided as a Source Data file.
Fig. 3
Fig. 3. Memory and regulatory T cells from the SLOs of old WT and young adult Foxo1TKO mice exhibit an exhausted phenotype.
a p value/Z score dot-plots representing the canonical pathways determined by Ingenuity Pathway Analysis software as significantly (p < 0.05) involved in the transcriptomic signature of CD4N cells from old WT (left panel) or young adult Foxo1TKO (right panel) mice. b A list of genes up-or down-regulated in CD4 T cells undergoing exhaustion in the course of a chronic infection was determined (GSE30431 Day 30). Expression of these genes by CD4 TN cells from old WT (upper panel) or young adult Foxo1TKO (lower panel) mice was visualized using the GSEA software. c PD1 fluorescence histograms of the indicated T-cell subsets from the spleen of a representative old mouse and a representative young adult mouse are shown (upper panel). Percentages of PD1+ cells among CD4M, CD4R, and CD8M cells are shown for the indicated SLOs of old/young adult mice (lower left panel) and Foxo1TKO/Foxo1Ctrl mice (lower right panel). d Same as in (c) for KI67. e Percentages of PD1+ cells among CD4M, CD4R and CD8M cells from the spleen of old mice are shown as a function of their Foxo1 relative expression. f Percentages of PD1+ cells among CD4M, CD4R and CD8M cells from the spleen of old mice are shown as a function of their expression of KI67. Quantifications are represented as Means ± SEM. The significance of differences between two series of results was assessed using Student’s unpaired t test (a, c, d). The p-values for the GSEA test statistics are calculated by permutation (b). For assessing correlations, Pearson correlation (two-sided test, coefficient and 95% confidence intervals) was used (e, f). Significant (p < 0.05) or almost significant (0.05 < p < 0.10) p-values are indicated. Source data are provided as a Source Data file.
Fig. 4
Fig. 4. Foxo1 deficiency leads to T-cell exhaustion upon activation.
ad CTV-labeled purified CD4N cells from Foxo1TKO and Foxo1Ctrl mice were stimulated for 2 or 4 days with anti-CD3 in the presence of splenocytes from CD3εKO mice. Diagram illustrating the experimental model (a). PD1 (b) and TIGIT (c) fluorescence histograms of T cells after 4 days of culture are shown for a representative experiment (left panel). Percentages of PD1+ cells and PD1 MFI (b, n = 10 independent experiments) and percentages of TIGIT+ cells and TIGIT MFI (c, n = 10 independent experiments) among the progeny of CD4N cells after 4 days of culture (right panel). CTV fluorescence histograms of T cells after 4 days of culture are shown for a representative experiment (d, left panels). The average number of cell cycles was calculated and plotted (d, right panel, n = 3 independent experiments for day 2, n = 9 independent experiments for day 4). Each pair of dots represents an individual experiment. e Expression of genes characterizing exhausted CD4 T cells 8 days after LCMV infection (GSE30431 Day 8) by the progeny of activated CD4N cells from Foxo1TKO versus Foxo1Ctrl mice after 4 days of culture was visualized using the GSEA software. f Expression pattern of chosen genes differentially expressed by exhausted CD4 T cells (±1.5 fold change, with a p value of <0.05) by the progeny of activated CD4N cells from Foxo1TKO versus Foxo1Ctrl mice after 4 days of culture. g Expression of genes characterizing the progeny of activated CD4N cells from old versus young healthy donors 5 days after activation (SRP158502) by the progeny of CD4N cells from Foxo1TKO versus Foxo1Ctrl mice after 4 days of culture was visualized using the GSEA software. The significance of differences between two series of results was assessed using Student’s paired t test (bd). The p-values for the GSEA test statistics are calculated by permutation (e, g). Significant (p < 0.05) p-values are indicated. Source data are provided as a Source Data file.
Fig. 5
Fig. 5. Cell-extrinsic signals induce T-cell aging.
a Correlogram showing for the indicated SLO of old mice the correlations between Foxo1 expression by a given subset of T cells and its expression by the others (upper panel). Blue colors indicate positive correlations, while red colors indicate negative correlations. The darker the color, the more significant the correlation. Correlation curves are presented for the spleen (lower panel). b Diagram illustrating the experimental model. c Relative Foxo1 MFIs for CD4N, CD4M and CD4R donor cells recovered from the spleen of recipient mice are shown. The dashed lines represent the average Foxo1 MFI of the corresponding T-cell subset from the spleen of young adult (----) and old (….) recipient mice. d Distribution of CD4N, CD4M and CD4R cells among donor CD4 T cells recovered from the indicated SLOs of young adult versus old recipient mice. e Absolute cell numbers of CD4N, CD4M and CD4R donor cells recovered from the spleen of young adult versus old recipient mice per 106 injected cells.Percentages of PD1+ (f) and KI67+ (g) cells among CD4M and CD4R donor cells are shown for the indicated SLOs of old versus young adult recipient mice. The dashed lines represent the average percentages for the corresponding T-cell subset of young adult (----) and old (….) recipient mice. h Percentages of PD1+ cells among CD4M and CD4R donor cells recovered from the spleen of recipient mice are shown as a function of their Foxo1 relative expression. i Percentages of KI67+ cells among CD4M and CD4R donor cells recovered from the spleen of recipient mice are shown as a function of their expression of PD1. Quantifications are represented as Means ± SEM. The significance of differences between two series of results was assessed using Student’s unpaired t test (c, e, f, g). For assessing correlations, Pearson correlation (two-sided test, coefficient, and 95% confidence intervals) was used (a, h, i). Significant (p < 0.05) or almost significant (0.05 < p < 0.10) p-values are indicated. Source data are provided as a Source Data file.
Fig. 6
Fig. 6. Inflammatory cytokines modulate Foxo1 expression in T cells.
a p value/Z score dot-plots representing all Upstream Regulators (left panel), the cytokines and cytokines-related regulators (middle panel) and among these ones, those with a Z score >2 (right panel) determined by Ingenuity Pathway Analysis software as significantly (p < 0.05) involved in the transcriptomic signature of CD4N cells from old WT mice. b Representation of the 4 most significant GSEA Hallmarks gene sets retrieved in the transcriptomic signature of CD4N cells from old WT mice. c Purified T cells from young WT mice were cultured for 4 days with IL-7 alone or together with the indicated cytokines. Diagram illustrating the experimental model. d Relative Foxo1 MFIs for CD4N, CD4M and CD4R cells recovered after 4 days of culture with IL-7 alone or together with the indicated cytokines. Relative MFIs were calculated after barcoding by dividing the MFI of a given T-cell subset in the presence of one given cytokine by the MFI of the same T-cell subset cultured with IL-7 alone. e Diagram illustrating the experimental model depicted in GSE75202 and GSE124829 from the Immunological Genome Project Consortium. f A list of genes up- or down-regulated in CD4 T cells by type 1 interferons was determined from GSE75202 (Supplementary Data 5). Expression of these genes by CD4N cells from old WT mice was visualized using the GSEA software. g Relative Foxo1 and Foxo3 expressions from GSE75202 and GSE124829 were determined by dividing for each mouse the corresponding counts by the average number of counts in the control group. h GSEA analysis visualizing the expression of genes down- or up-regulated in Foxo1-deficient CD4N cells (Supplementary Data 1) by CD4 T cells from the spleen of mice treated as illustrated in (e). i A list of genes for which Foxo1 binds in the promoter region was determined from GSE46525 (Supplementary Data 6). GSEA analysis visualizing the expression of these genes by CD4 T cells from the spleen of mice treated as illustrated in (e). Quantifications are represented as Means ± SEM. The significance of differences between two series of results was assessed using Student’s unpaired t test (a, d, g). The p-values for the GSEA test statistics are calculated by permutation (b, f, h, i). Significant (p < 0.05) p-values are indicated. Source data are provided as a Source Data file.
Fig. 7
Fig. 7. Type 1 interferons induce Foxo1 down-regulation in T cells.
a Purified T cells from young WT mice were cultured for 4 days with IL-7 alone or together with the indicated inhibitors in the presence or absence of IFNα4. Diagram illustrating the experimental model. b Relative Foxo1 MFIs for CD4N, CD4M and CD4R cells recovered after 4 days of culture with IL-7 in the presence of IFNα4 and the indicated inhibitors. Relative MFIs were calculated after barcoding by dividing the MFI of a given T-cell subset in the presence of one given inhibitor and IFNα4 by the MFI of the same T-cell subset cultured with the same inhibitor alone. Statistics were calculated to compare Foxo1 down-regulation induced by IFNα4 alone with Foxo1 down-regulation induced by IFNα4 in the presence of the indicated inhibitors. ce CTV-labeled purified CD4N cells from WT mice were precultured or not with IFN-α and then stimulated for 4 days with anti-CD3 in the presence of splenocytes from CD3εKO mice. Diagram illustrating the experimental model (c). Percentages of PD1+ cells and PD1 MFI among the progeny of CD4N cells upon in vitro activation (d, n = 6 independent experiments). The average number of cell cycles undergone by CD4N cells upon in vitro activation was calculated and plotted (e, n = 6 independent experiments). Each pair of dots represents an individual experiment. Quantifications are represented as Means ± SEM. The significance of differences between two series of results was assessed using Student’s unpaired (b) or paired (d, e) t test. Significant (p < 0.05) p-values are indicated. Source data are provided as a Source Data file.
Fig. 8
Fig. 8. Analysis of the T-cell compartment of old IfnarKO mice.
a Cell suspensions from the spleen of a 3-month-old WT mouse (Young adult), a 22-month-old WT mouse (Old) and a 22-month-old IfnarKO mouse (old) were first stained separately with anti-CD45 antibodies conjugated to different fluorochromes and then mixed before further staining. Relative Foxo1 MFIs were calculated by dividing the MFI of a given T-cell subset of old mice by the MFI of the same T-cell subset of the barcoded young adult WT mouse. b Relative expression of CCR7 and CD62L by CD4N and CD8N cells from the spleen of old mice as a function of their Foxo1 relative expression. Relative MFIs were calculated by dividing the MFI of a given T-cell subset of old mice by the MFI of the same T-cell subset of the barcoded young adult WT mouse. c Distribution of CD4N, CD4M and CD4R cells among CD4 T cells and of CD8N, CD8M, and CD8R cells among CD8 T cells recovered from the indicated SLOs of old WT versus old IfnarKO mice. Percentages of PD1+ (d) and KI67+ (e) cells among CD4M, CD4R and CD8M cells recovered from the indicated SLOs of 22-month-old WT versus 22-month-old IfnarKO mice. Quantifications are represented as Means ± SEM. The significance of differences between two series of results was assessed using Student’s unpaired t test (a, d, e). For assessing correlations, Pearson correlation (two-sided test, coefficient and 95% confidence intervals) was used (b). Significant (p < 0.05) or almost significant (0.05 < p < 0.10) p-values are indicated. Source data are provided as a Source Data file.

Similar articles

Cited by

References

    1. Maklakov AA, Immler S. The expensive germline and the evolution of ageing. Curr. Biol. 2016;26:R577–R586. doi: 10.1016/j.cub.2016.04.012. - DOI - PubMed
    1. Kline KA, Bowdish DME. Infection in an aging population. Curr. Opin. Microbiol. 2016;29:63–67. doi: 10.1016/j.mib.2015.11.003. - DOI - PubMed
    1. Bottazzi B, Riboli E, Mantovani A. Aging, inflammation and cancer. Semin. Immunol. 2018;40:74–82. doi: 10.1016/j.smim.2018.10.011. - DOI - PubMed
    1. Drijvers JM, Sharpe AH, Haigis MC. The effects of age and systemic metabolism on anti-tumor T cell responses. eLife. 2020;9:e62420. doi: 10.7554/eLife.62420. - DOI - PMC - PubMed
    1. Lefebvre JS, et al. Vaccine efficacy and T helper cell differentiation change with aging. Oncotarget. 2016;7:33581–33594. doi: 10.18632/oncotarget.9254. - DOI - PMC - PubMed