. 2024 Feb 26;15(1):20.
doi: 10.1186/s13293-024-00590-7.

Microbial composition, functionality, and stress resilience or susceptibility: unraveling sex-specific patterns

Affiliations

Microbial composition, functionality, and stress resilience or susceptibility: unraveling sex-specific patterns

Arax Tanelian et al. Biol Sex Differ. .

Abstract

Background: Following exposure to traumatic stress, women are twice as likely as men to develop mood disorders. Yet, individual responses to such stress vary, with some people developing stress-induced psychopathologies while others exhibit resilience. The factors influencing sex-related disparities in affective disorders as well as variations in resilience remain unclear; however, emerging evidence suggests differences in the gut microbiota play a role. In this study, using the single prolonged stress (SPS) model of post-traumatic stress disorder, we investigated pre- and post-existing differences in microbial composition, functionality, and metabolites that affect stress susceptibility or resilience in each sex.

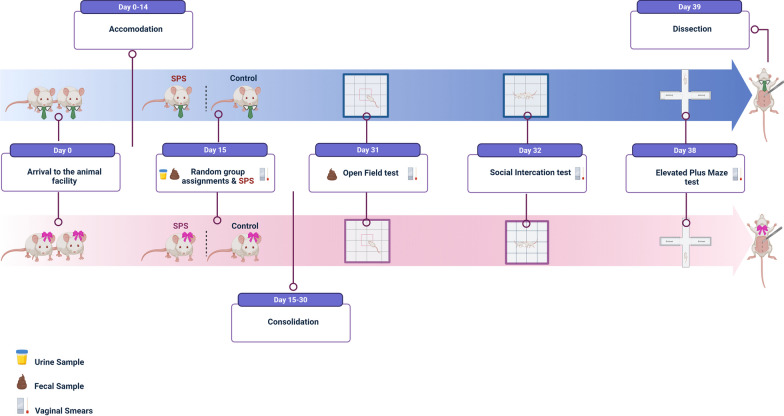
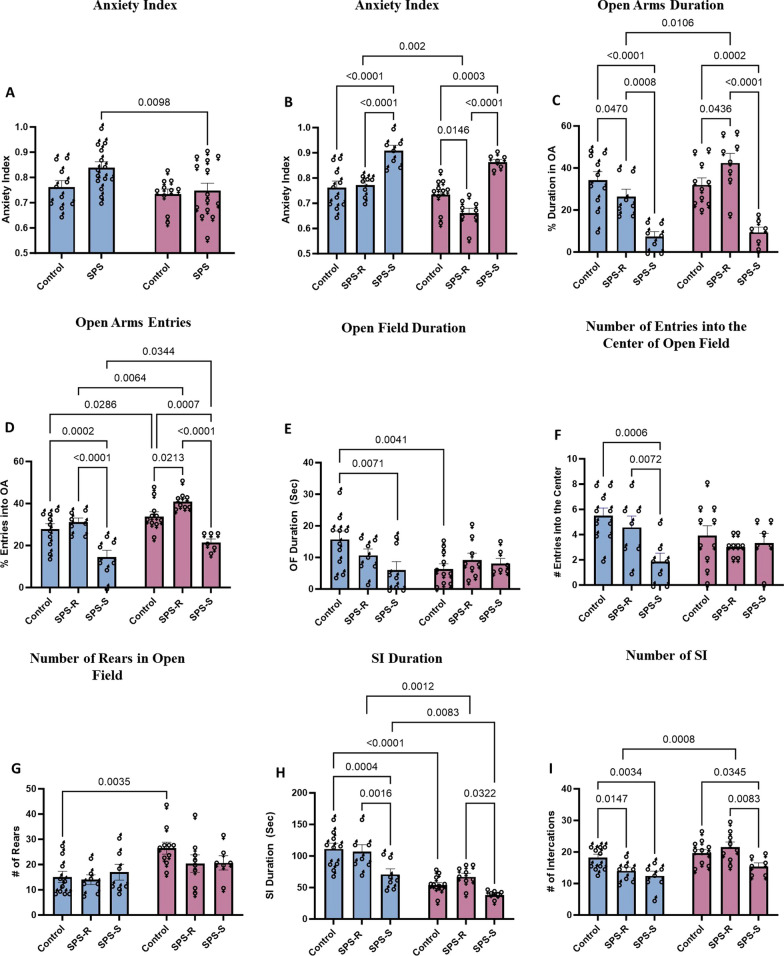
Methods: Male and female Sprague-Dawley rats were randomly assigned to control or SPS groups. Two weeks following SPS, the animals were exposed to a battery of behavioral tests and decapitated a day later. Based on their anxiety index, they were further categorized as SPS-resilient (SPS-R) or SPS-susceptible (SPS-S). On the day of dissection, cecum, and selected brain tissues were isolated. Stool samples were collected before and after SPS, whereas urine samples were taken before and 30 min into the SPS.

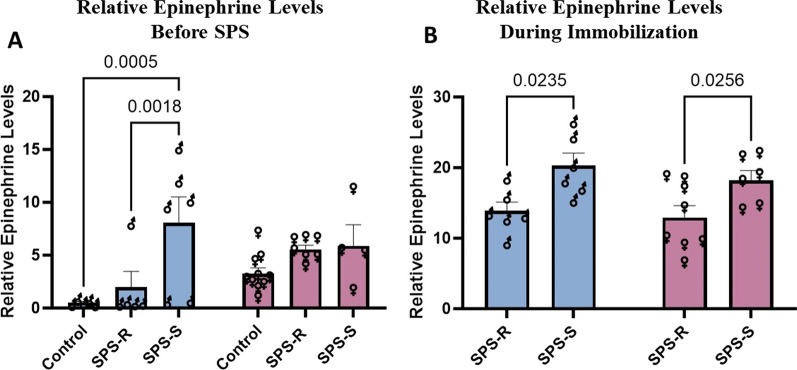
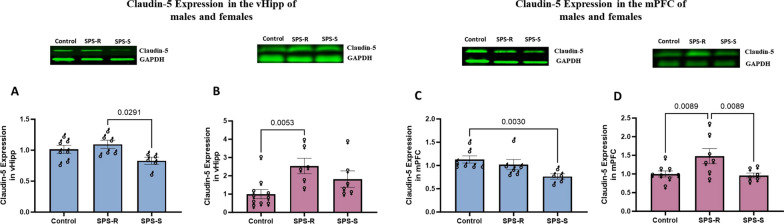
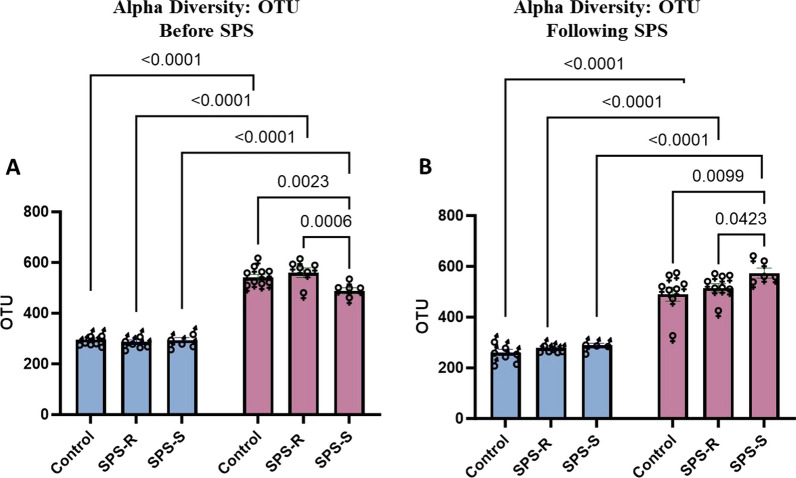
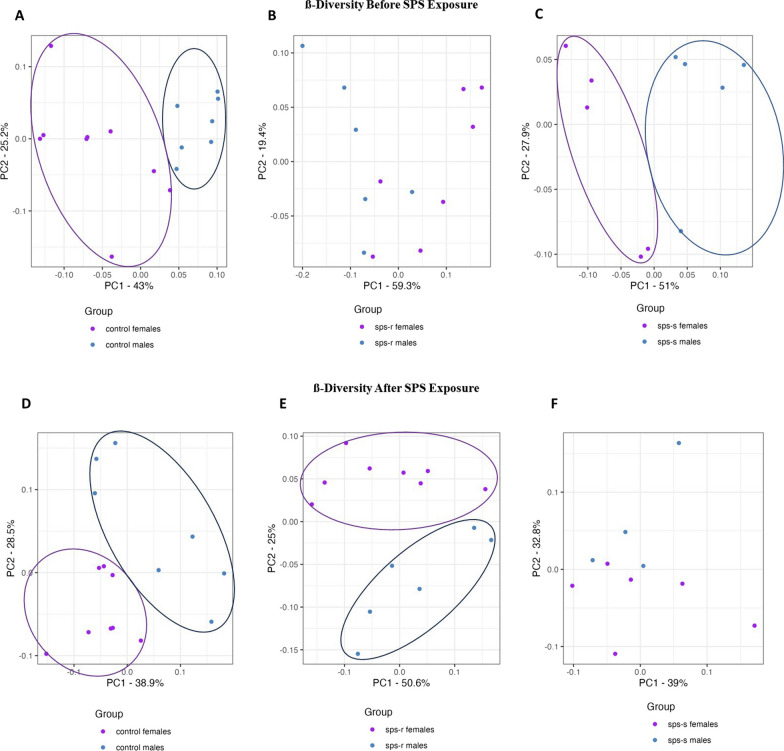
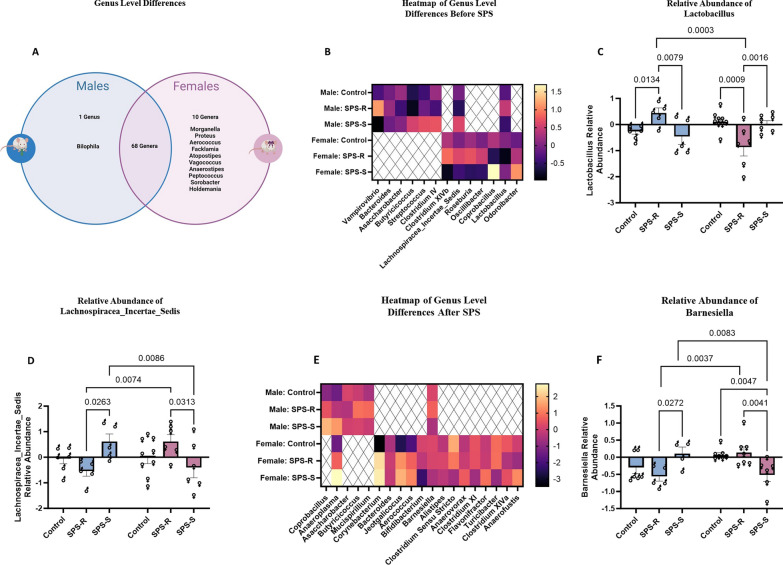
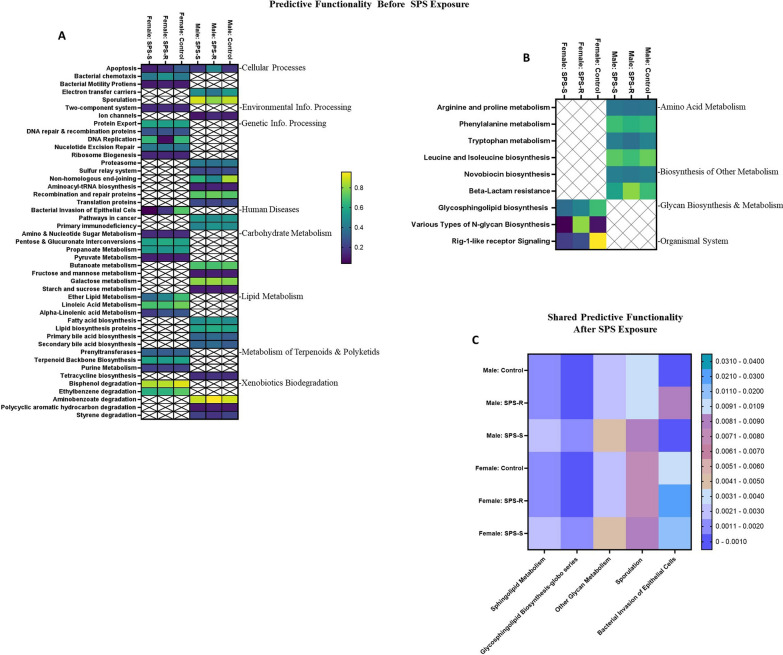
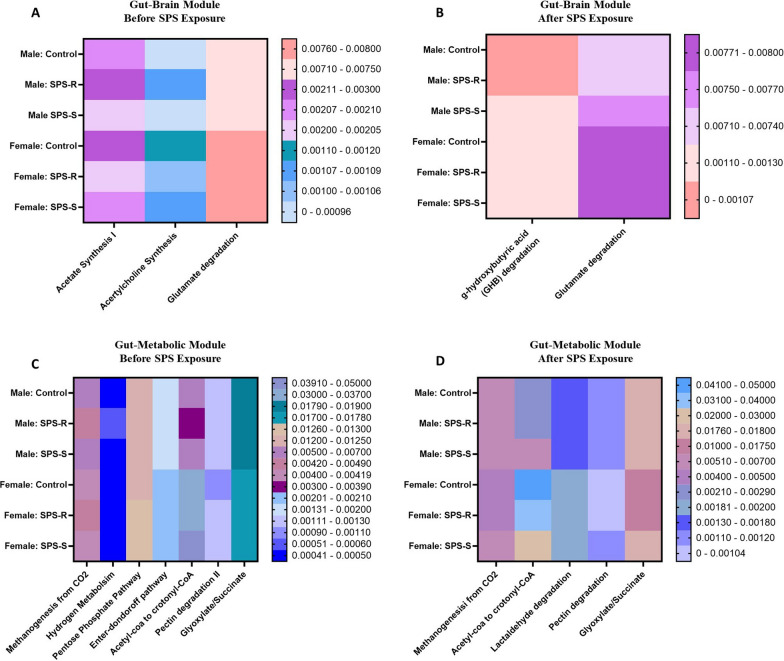
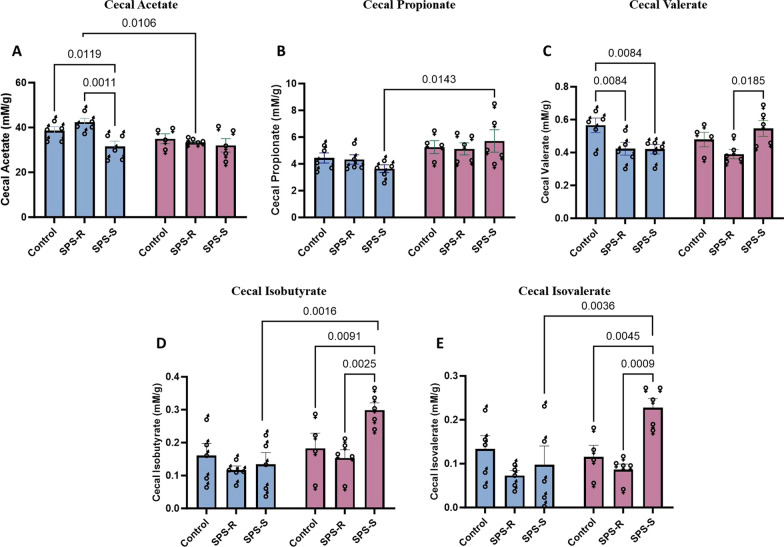
Results: Before SPS exposure, the sympathoadrenal axis exhibited alterations within male subgroups only. Expression of tight junction protein claudin-5 was lower in brain of SPS-S males, but higher in SPS-R females following SPS. Across the study, alpha diversity remained consistently lower in males compared to females. Beta diversity revealed distinct separations between male and female susceptible groups before SPS, with this separation becoming evident in the resilient groups following SPS. At the genus level, Lactobacillus, Lachnospiraceae_Incertae_Sedis, and Barnesiella exhibited sex-specific alterations, displaying opposing abundances in each sex. Additionally, sex-specific changes were observed in microbial predictive functionality and targeted functional modules both before and after SPS. Alterations in the microbial short-chain fatty acids (SCFAs), were also observed, with major and minor SCFAs being lower in SPS-susceptible males whereas branched-chain SCFAs being higher in SPS-susceptible females.

Conclusion: This study highlights distinct pre- and post-trauma differences in microbial composition, functionality, and metabolites, associated with stress resilience in male and female rats. The findings underscore the importance of developing sex-specific therapeutic strategies to effectively address stress-related disorders. Highlights SPS model induces divergent anxiety and social behavioral responses to traumatic stress in both male and female rodents. SPS-resilient females displayed less anxiety-like behavior and initiated more interactions towards a juvenile rat than SPS-resilient males. Sex-specific pre-existing and SPS-induced differences in the gut microbial composition and predictive functionality were observed in susceptible and resilient rats. SPS-resilient males displayed elevated cecal acetate levels, whereas SPS-susceptible females exhibited heightened branched-chain SCFAs.

Keywords: Anxiety; Microbiome; Resilience; SCFA; SPS; Sex differences.

Plain language summary

After experiencing traumatic stress, women are more likely than men to develop mood disorders like anxiety and depression. However, people's responses to trauma vary—some develop mental health issues while others remain resilient. Recent research suggests that the bacteria in the gut might play a role in these differences. In this study, using a rat model of post-traumatic stress disorder (PTSD), we investigated whether there are differences in gut bacteria between male and female rats before and after stress exposure. The study involved two groups of rats—one not exposed to stress (control) and the other exposed to a traumatic event (stressed). The rats' behavior was evaluated using different tests to determine who among the males and females were vulnerable to stress and who were resilient. We found that even before the stress, there were differences in the types of bacteria and their functions in the guts of male and female rats. These differences were also linked to how they responded to stress. Interestingly, the bacteria that were more abundant in resilient males were found to be more abundant in vulnerable females. Additionally, the traumatic stress affected these bacteria and the substances they produce differently in males and females. In essence, our study demonstrates that the types of gut bacteria, their functions, and their products contribute to stress resilience in different ways for male and female rats. This insight suggests that tailored treatments specifically targeting these differences could be specially effective in treating stress-related issues.


Conflict of interest statement

The authors declare that the research was conducted in the absence of any commercial or financial relationships that could be construed as a potential conflict of interest.

Figures

Fig. 1
Fig. 1
Experimental timeline. Two weeks following arrival, male and female rats were randomly divided into unstressed controls and experimental groups which got exposed to SPS. Two weeks later, a battery of behavioral tests was performed, and the animals were decapitated one day later. Stool samples were collected before SPS and on the day of open field test. Urine samples were collected before and during SPS. Vaginal smears were collected on the day of SPS and each behavioral test
Fig. 2
Fig. 2
Sex differences in anxiety-like behavior and social impairments following SPS. Anxiety-like behavior tested on EPM: A Anxiety Index before group subdivisions, B Anxiety Index following group subdivisions, C % duration in open arms (OA), D % entries into open arms (OA). Anxiety-like behavior tested on OF: E duration in the center of the arena, F number of entries into the center of the arena, G number of rears. Social behavior tested on SI: H time spent interacting with a juvenile rat of same sex, I number of interactions initiated by the test rat towards the juvenile rat. Each symbol represents the value for an individual animal (blue bars—males: control n = 10, SPS-R n = 7, SPS-S n = 7; pink bars—females: control n = 10, SPS-R n = 8, SPS-S n = 6)
Fig. 3
Fig. 3
Sex differences in net weight gain. All animals were weighed on the day of SPS (day 15) and two weeks later (day 31), and the net weight gain was calculated. Each symbol represents the value for an individual animal (blue bars—males: control n = 10, SPS-R n = 7, SPS-S n = 7; pink bars—females: control n = 10, SPS-R n = 8, SPS-S n = 6)
Fig. 4
Fig. 4
Sex differences in urinary epinephrine levels before SPS and 30 min into the immobilization step of SPS. Urine samples were collected before SPS and 30 min into immobilization step of SPS, to measure urinary epinephrine levels of individual animals. A Basal relative epinephrine levels, B relative epinephrine levels 30 min into the immobilization step of SPS. Each symbol represents the value for an individual animal. Due to technical difficulties, urine samples were not collected from every single animal. Moreover, during the immobilization step urine samples were not collected from the controls as they were not exposed to stress. Each symbol represents the value for an individual animal. Before SPS (blue bars—males: control n = 5, SPS-R n = 5, SPS-S n = 6; pink bars—females: control n = 10, SPS-R n = 7, SPS-S n = 4). Following SPS (blue bars—males: SPS-R n = 6, SPS-S n = 6, and pink bars—females: SPS-R n = 8, SPS-S n = 6)
Fig. 5
Fig. 5
Sex-specific alterations in claudin-5 expression in the brain following SPS exposure. Ventral hippocampus (vHipp) and medial prefrontal cortex (mPFC) of each animal were dissected and Western blot was performed to analyze the expression of tight junction protein claudin-5. Expression of claudin-5 in A vHipp of males and B females, C mPFC of males and D females. Representative Western blots are shown. The images have been previously published in Neurobiology of Stress [39]. The analysis was performed using one-way ANOVA, as the samples from males and females were not run simultaneously. The values are normalized to their respective controls taken as 1. Claudin-5 protein expression data in the vHipp. of females, and in the mPFC of males were non-parametrically distributed and were analyzed using Kruskal–Wallis test followed by FDR corrected multiple comparison test. The rest of the data passed the normality test and were analyzed using one-way ANOVA, followed FDR corrected multiple comparison test. Each symbol represents the value for an individual animal. vHipp (blue bars—males control n = 7, SPS-R n = 6, SPS-S n = 5; pink bars—females control n = 10, SPS-R n = 6, SPS-S n = 6);mPFC (blue bars—males control n = 7, SPS-R n = 6, SPS-S n = 5; pink bars—females control n = 8, SPS-R n = 7, SPS-S n = 6)
Fig. 6
Fig. 6
Sex differences in alpha diversity before and after SPS. Alpha diversity was measured using OTU counts A before SPS, B after SPS. Fecal samples collected from each rat were sent for 16S sequencing. Due to technical difficulties stool samples were not collected from every single animal. Each symbol represents the value for an individual animal. Before SPS (blue bars—males control n = 7, SPS-R n = 6, SPS-S n = 5; pink bars—females control n = 9, SPS-R n = 6, SPS-S n = 5), following SPS (blue bars—males control n = 7, SPS-R n = 6, SPS-S n = 4; pink bars—females control n = 8, SPS-R n = 8, SPS-S n = 5)
Fig. 7
Fig. 7
Sex differences in Beta diversity before and after SPS. Beta diversity was assessed using Aitchison distance. Before SPS A male vs female controls, B males vs females SPS-R subgroup, C males vs females SPS-S subgroup. After SPS: D male vs female controls, E males vs females SPS-R subgroup, F males vs females SPS-S subgroup. Due to technical difficulties stool samples were not collected from every single animal. Each symbol represents the value for an individual animal. Before SPS (blue bars—males control n = 7, SPS-R n = 6, SPS-S n = 5; pink bars—females control n = 9, SPS-R n = 7, SPS-S n = 5), following SPS (blue bars—males control n = 7, SPS-R n = 6, SPS-S n = 4; pink bars—females control n = 8, SPS-R n = 8, SPS-S n = 6)
Fig. 8
Fig. 8
Sex differences in the gut microbial composition at genus level before and after SPS. A Venn diagram depicting shared and sex specific genera, B heat map of the genera which showed significant pre-existing group differences in each sex as well as in both sexes, C relative abundance of Lactobacillus, D relative abundance of Lachnospiraceae_Incertae_Sedis, E heat map of the genera which showed significant SPS-induced group differences in each sex and in both sexes, F relative abundance of Barnesiella. Due to technical difficulties stool samples were not collected from every single animal. Each symbol represents the value for an individual animal. Before SPS (blue bars—males control n = 6, SPS-R n = 5, SPS-S n = 5; pink bars—females control n = 9, SPS-R n = 6, SPS-S n = 7/6), following SPS (blue bars—males control n = 6, SPS-R n = 5, SPS-S n = 4; pink bars—females control n = 7, SPS-R n = 7, SPS-S n = 6)
Fig. 9
Fig. 9
Sex differences in the gut microbial predictive functionality before and after SPS. A Heat map of the microbial predictive functionality which showed pre-existing group differences in both sexes (right side: general functional pathways, left side: specific domains in each pathway), B heat map of the microbial predictive functionality which showed pre-existing group differences in males or females only (right side: general functional pathways, left side: specific domains in each pathway), C heat map of the microbial predictive functionality which showed SPS-induced group differences in both males and females. Due to technical difficulties stool samples were not collected from every single animal. Each symbol represents the value for an individual animal. Before SPS (blue bars—males control n = 7, SPS-R n = 6, SPS-S n = 5; pink bars—females control n = 8, SPS-R n = 7, SPS-S n = 5), following SPS (blue bar—males control n = 7, SPS-R n = 6, SPS-S n = 4; pink bar—females control n = 7/8, SPS-R n = 7/8, SPS-S n = 5/6)
Fig. 10
Fig. 10
Sex differences in the gut–brain and gut–metabolic modules before and after SPS. A Heat map of the shared gut–brain module between males and females before SPS exposure, B heat map of the shared gut–brain module between males and females following SPS exposure, C heat map of the shared gut–metabolic module between males and females before SPS exposure, D heat map of the shared gut–metabolic module between males and females following SPS exposure. Due to technical difficulties stool samples were not collected from every single animal. Each symbol represents the value for an individual animal. Before SPS (blue bars—males control n = 6/7, SPS-R n = 5/6, SPS-S n = 5; pink bars—females control n = 8/9, SPS-R n = 6/7, SPS-S n = 5/6), following SPS (blue bars—males control n = 6/7, SPS-R n = 6, SPS-S n = 4; pink bars—females control n = 8, SPS-R n = 8, SPS-S n = 5/6). The values of acetyl-CoA to crotonyl-CoA were multiplied by 1000 to facilitate their integration into the heat map alongside the other data points
Fig. 11
Fig. 11
Sex differences in the gut microbial metabolites following SPS exposure. Cecum was collected from each rat on the day of dissection and randomly selected cecal samples from each subgroup were sent to SCFA analysis. A Levels of cecal acetate, B levels of cecal propionate, C levels of cecal valerate, D levels of cecal isobutyrate, E levels of cecal isovalerate. Each symbol represents the value for an individual animal (blue bars—males control n = 5, SPS-R n = 5, SPS-S n = 5; pink bars—females control n = 4, SPS-R n = 5, SPS-S n = 5)

Similar articles

Cited by

References

    1. DuMont M, Agostinis A, Singh K, et al. Sex representation in neurodegenerative and psychiatric disorders' preclinical and clinical studies. Neurobiol Dis. 2023;184:106214. doi: 10.1016/j.nbd.2023.106214. - DOI - PubMed
    1. Tolin DF, Foa EB. Sex differences in trauma and posttraumatic stress disorder: a quantitative review of 25 years of research. Psychol Bull. 2006;132:959–992. doi: 10.1037/0033-2909.132.6.959. - DOI - PubMed
    1. Kessler RC, Sonnega A, Bromet E, et al. Posttraumatic stress disorder in the National Comorbidity Survey. Arch Gen Psychiatry. 1995;52:1048–1060. doi: 10.1001/archpsyc.1995.03950240066012. - DOI - PubMed
    1. McCarthy MM, Nugent BM, Lenz KM. Neuroimmunology and neuroepigenetics in the establishment of sex differences in the brain. Nat Rev Neurosci. 2017;18:471–484. doi: 10.1038/nrn.2017.61. - DOI - PMC - PubMed
    1. Mendoza C, Barreto GE, Ávila-Rodriguez M, et al. Role of neuroinflammation and sex hormones in war-related PTSD. Mol Cell Endocrinol. 2016;434:266–277. doi: 10.1016/j.mce.2016.05.016. - DOI - PubMed