. 2024 Feb 26;15(1):1739.
doi: 10.1038/s41467-024-45466-x.

NINJ1 mediates inflammatory cell death, PANoptosis, and lethality during infection conditions and heat stress

Affiliations

NINJ1 mediates inflammatory cell death, PANoptosis, and lethality during infection conditions and heat stress

Joo-Hui Han et al. Nat Commun. .

Abstract

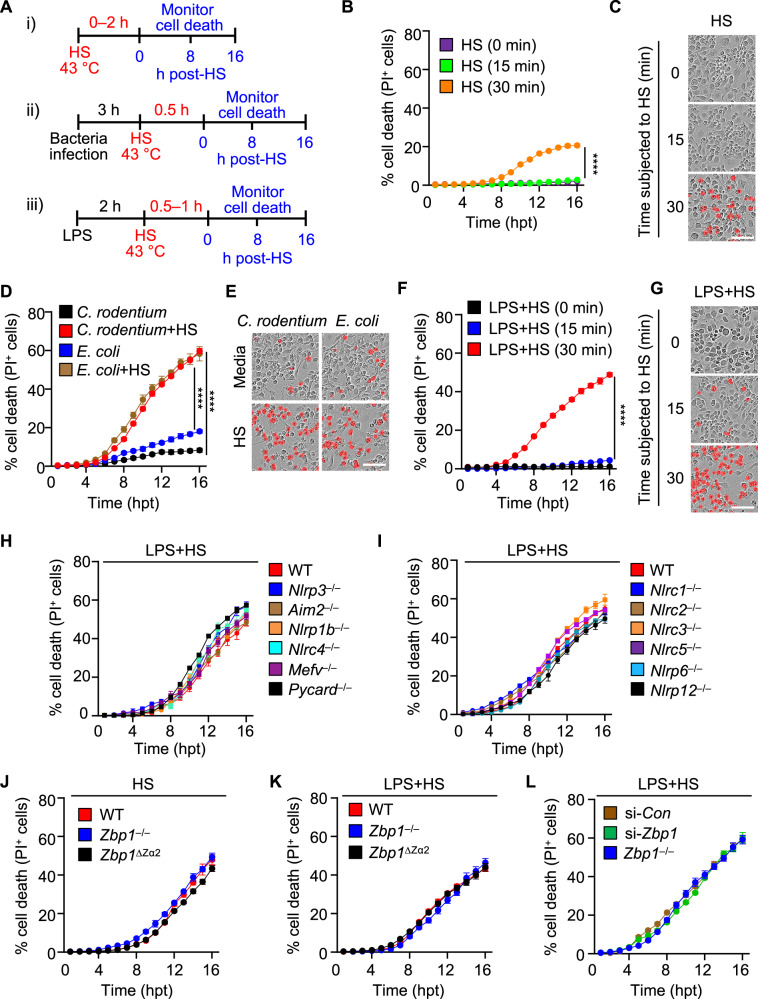
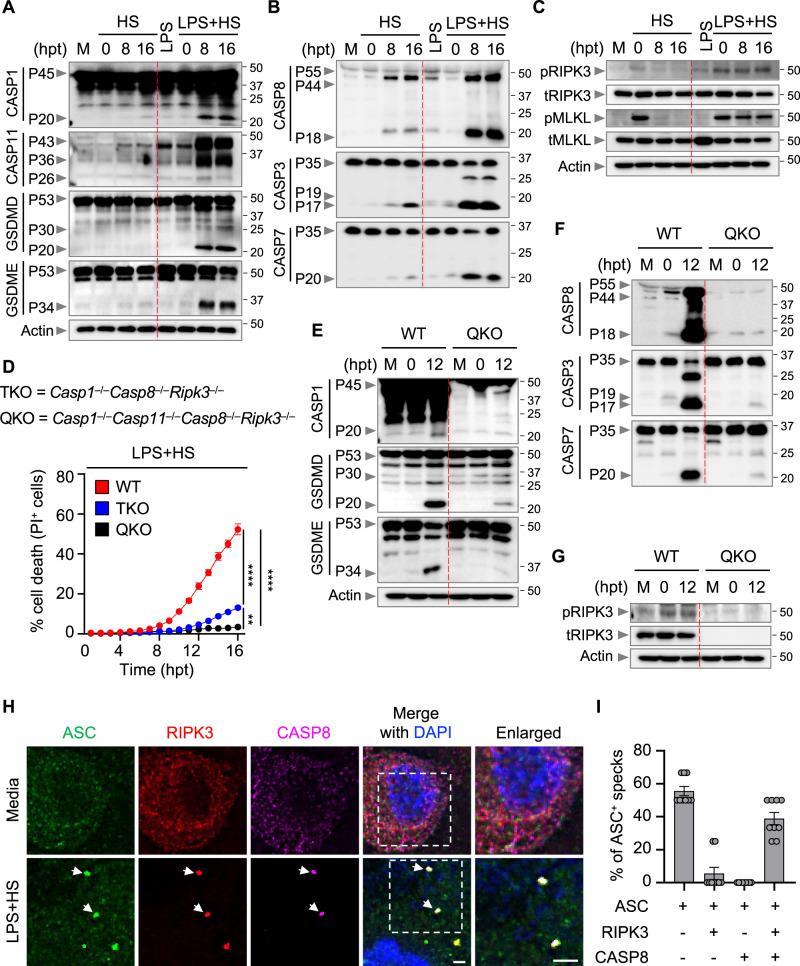
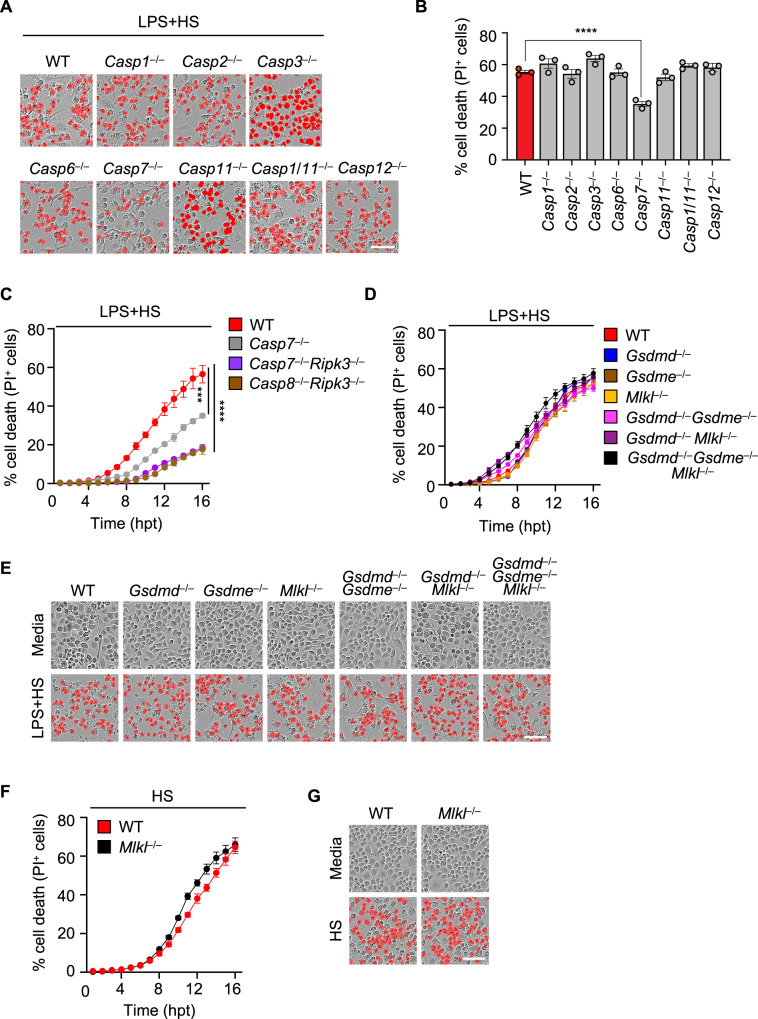
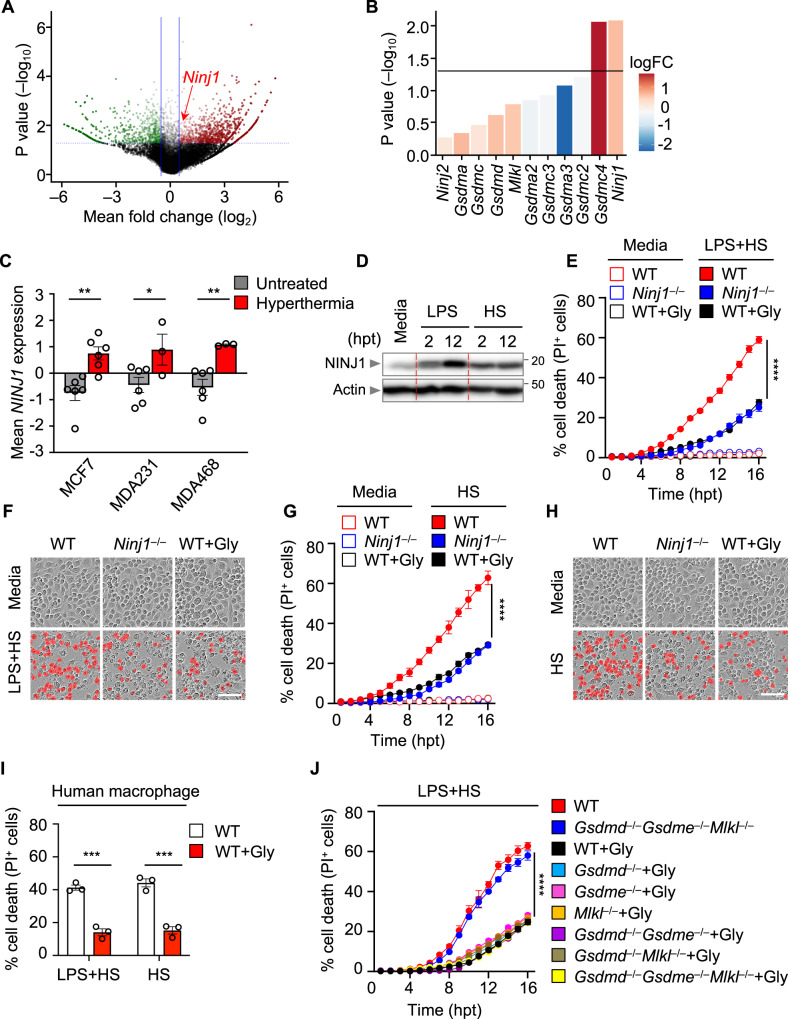
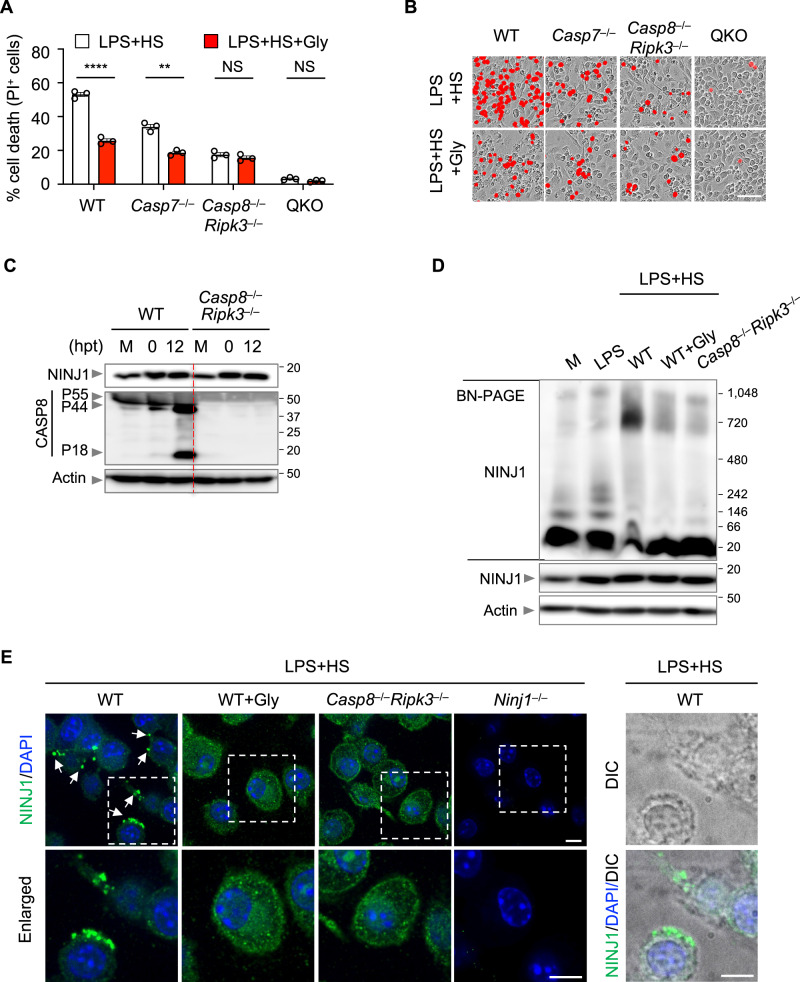
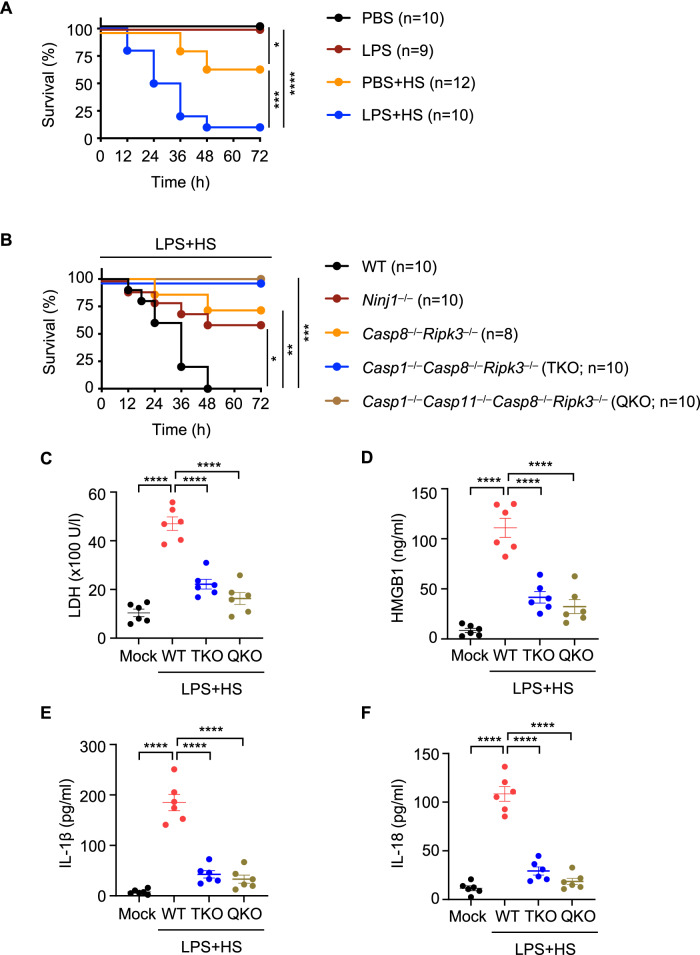
Innate immunity provides the first line of defense through multiple mechanisms, including pyrogen production and cell death. While elevated body temperature during infection is beneficial to clear pathogens, heat stress (HS) can lead to inflammation and pathology. Links between pathogen exposure, HS, cytokine release, and inflammation have been observed, but fundamental innate immune mechanisms driving pathology during pathogen exposure and HS remain unclear. Here, we use multiple genetic approaches to elucidate innate immune pathways in infection or LPS and HS models. Our results show that bacteria and LPS robustly increase inflammatory cell death during HS that is dependent on caspase-1, caspase-11, caspase-8, and RIPK3 through the PANoptosis pathway. Caspase-7 also contributes to PANoptosis in this context. Furthermore, NINJ1 is an important executioner of this cell death to release inflammatory molecules, independent of other pore-forming executioner proteins, gasdermin D, gasdermin E, and MLKL. In an in vivo HS model, mortality is reduced by deleting NINJ1 and fully rescued by deleting key PANoptosis molecules. Our findings suggest that therapeutic strategies blocking NINJ1 or its upstream regulators to prevent PANoptosis may reduce the release of inflammatory mediators and benefit patients.


Conflict of interest statement

T.-D.K. was a consultant for Pfizer. The remaining authors declare no competing interests.

Figures

Fig. 1
Fig. 1. Infection potentiates heat stress-induced inflammatory cell death.
A Schematic illustrating the treatment timeline for (i) heat stress (HS) alone, (ii) HS with bacterial infection, or iii) HS with lipopolysaccharide (LPS) priming. B Real-time analysis of cell death in bone marrow-derived macrophages (BMDMs) challenged with HS for the indicated times. C Representative images of cell death in (B) at 16 hours post-treatment (hpt). D Real-time analysis of cell death in Escherichia coli or Citrobacter rodentium-infected BMDMs with or without subsequent HS (43 °C for 30 min). E Representative images of cell death in (D) at 16 hpt. F Real-time analysis of cell death in LPS-primed BMDMs challenged with HS (43 °C for the indicated times). G Representative images of cell death in (F) at 16 hpt. H Real-time analysis of cell death in LPS-primed wild type (WT), Nlrp3–/–, Aim2–/–, Nlrp1b–/–, Nlrc4–/–, Mefv–/–, and Pycard–/– BMDMs following challenge with HS (43 °C for 30 min). I Real-time analysis of cell death in LPS-primed WT, Nlrc1–/–, Nlrc2–/–, Nlrc3–/–, Nlrc5–/–, Nlrp6–/–, and Nlrp12–/– BMDMs following challenge with HS (43 °C for 30 min). J Real-time analysis of cell death in WT, Zbp1–/–, and Zbp1∆Zα2 BMDMs following challenge with HS (43 °C for 1 h). K Real-time analysis of cell death in LPS-primed WT, Zbp1–/–, and Zbp1∆Zα2 BMDMs following challenge with HS (43 °C for 30 min). L Real-time analysis of cell death in LPS-primed WT control siRNA (si-Con)-treated, WT Zbp1 siRNA (si-Zbp1)-treated, and Zbp1–/– BMDMs following challenge with HS (43 °C for 30 min). B Data are shown as mean ± SEM; **** P < 0.0001 (two-tailed t-test; n = 4 from 4 biologically independent samples). C, E, G Images are representative of at least three independent experiments. Scale bar, 50 μm. D, F, HL Data are shown as mean ± SEM; ****P < 0.0001 (one-way ANOVA with Bonferroni’s multiple comparisons test; n = 4 from 4 biologically independent samples). Exact P values are presented in Supplementary data file 2.
Fig. 2
Fig. 2. Combined deletion of PANoptosis molecules inhibits cell death induced by LPS plus HS.
AC Immunoblot analysis of A pro- (P45) and activated (P20) caspase-1 (CASP1); pro- (P43) and cleaved (P36 and P26) caspase-11 (CASP11); pro- (P53), activated (P30), and inactivated (P20) gasdermin D (GSDMD); pro- (P53) and activated (P34) gasdermin E (GSDME); B pro- (P55) and cleaved (P44 and P18) caspase-8 (CASP8); pro- (P35) and cleaved (P19 and P17) caspase-3 (CASP3); pro- (P35) and cleaved (P20) caspase-7 (CASP7); C phosphorylated receptor-interacting serine/threonine kinase 3 (pRIPK3), total RIPK3 (tRIPK3), phosphorylated mixed lineage kinase domain-like (pMLKL), and total MLKL (tMLKL) in wild type (WT) bone marrow-derived macrophages (BMDMs) treated with lipopolysaccharide (LPS) alone or subjected to heat stress (HS; 43 °C for 30 min) with or without LPS priming. M, media control. Actin is used as the internal control. D Real-time analysis of cell death in LPS-primed WT, Casp1–/–Casp8–/–Ripk3–/– (TKO), and Casp1–/–Casp11–/–Casp8–/–Ripk3–/– (QKO) BMDMs challenged with HS (43 °C for 30 min). EG Immunoblot analysis of E pro- (P45) and activated (P20) CASP1; pro- (P53), activated (P30), and inactivated (P20) GSDMD; pro- (P53) and activated (P34) GSDME; F pro- (P55) and cleaved (P44 and P18) CASP8; pro- (P35) and cleaved (P19 and P17) CASP3; pro- (P35) and cleaved (P20) CASP7; and G pRIPK3 and tRIPK3 in LPS-primed WT and QKO BMDMs at the indicated timepoints after HS (43 °C for 30 min). Actin is used as the internal control. H Immunofluorescence images of WT LPS-primed BMDMs at 12 h post-treatment (hpt) (43 °C for 30 min). Nuclei were stained with DAPI. Arrowheads indicate the colocalized ASC, RIPK3, and CASP8 specks. Images are representative of three independent experiments. I Distribution of ASC+ specks colocalized with RIPK3+ or/and CASP8+ specks in (H). n > 100 specks were counted. AC, EH Images are representative of at least three independent experiments. D Data are shown as mean ± SEM; **P < 0.01, and ****P < 0.0001 (one-way ANOVA with Bonferroni’s multiple comparisons test; n = 4 from 4 biologically independent samples). I Data are shown as mean ± SEM (n = 9 from 4 biologically independent samples). H Scale bar, 5 μm. Exact P values are presented in Supplementary data file 2. For uncropped western blots, see the accompanying source data.
Fig. 3
Fig. 3. Loss of caspase-7, but not traditional lytic cell death executioners, impairs LPS plus heat stress-induced cell death.
A Representative images of cell death in lipopolysaccharide (LPS)-primed wild type (WT), Casp1–/–, Casp2–/–, Casp3–/–, Casp6–/–, Casp7–/–, Casp11–/–, Casp1/11–/–, and Casp12–/– bone marrow-derived macrophages (BMDMs) at 16 h post-treatment (hpt) with heat stress (HS) (43 °C for 30 min). B Quantification of cell death in (A) at 16 hpt. C Real-time analysis of cell death in LPS-primed WT, Casp7–/–, Casp7–/–Ripk3–/–, and Casp8–/–Ripk3–/– BMDMs following challenge with HS (43 °C for 30 min). D Real-time analysis of cell death in LPS-primed WT, Gsdmd–/–, Gsdme–/–, Mlkl–/–, Gsdmd–/–Gsdme–/–, Gsdmd–/–Mlkl–/–, and Gsdmd–/–Gsdme–/–Mlkl–/– BMDMs following challenge with HS (43 °C for 30 min). E Representative images of cell death in (D) at 16 hpt. F Real-time analysis of cell death in WT and Mlkl–/– BMDMs following challenge with HS (43 °C for 60 min). G Representative images of cell death in (F) at 16 hpt. A, E, G Images are representative of at least three independent experiments. Scale bar, 50 μm. BD, F Data are shown as mean ± SEM; *** P < 0.001 and **** P < 0.0001 (one-way ANOVA with Bonferroni’s multiple comparisons test; B n = 3 from 3 biologically independent samples and C, D, F n = 4 from 4 biologically independent samples). Exact P values are presented in Supplementary data file 2.
Fig. 4
Fig. 4. Genome-wide CRISPR screen identifies NINJ1 as a cell death executioner in response to LPS plus heat stress.
A Volcano plot showing the genes that are enriched or depleted in immortalized bone marrow-derived macrophages (iBMDMs) after a genome-wide CRISPR-Cas9 knockout screen of cell death induced by lipopolysaccharide (LPS) priming and heat stress (HS; 43 °C for 60 min). B Analysis of the enrichment of genes encoding pore-forming molecules identified in (A) in the CRISPR screen results. C NINJ1 expression in MCF7, MDA231, and MDA468 cancer cells with and without hyperthermia (GSE48398). D Immunoblot analysis of NINJ1 expression in wild type (WT) BMDMs after 2 or 12 h of LPS stimulation or following HS challenge (43 °C for 60 min). E Real-time analysis of cell death under basal conditions (no LPS + HS) or in LPS-primed WT, Ninj1–/–, and glycine (Gly)-treated WT BMDMs following challenge with HS (43 °C for 30 min). F Representative images of cell death in (E) at 16 h post-treatment (hpt). G Real-time analysis of cell death under basal conditions (no HS) or in WT, Ninj1–/–, and Gly-treated WT BMDMs following challenge with HS (43 °C for 60 min). H Representative images of cell death in (G) at 16 hpt. I Analysis of cell death in human macrophages 5 h after LPS + HS (43 °C for 60 min) treatment or HS (43 °C for 2 h) treatment in the presence or absence of Gly. J Real-time analysis of cell death in LPS-primed WT and Gsdmd–/–Gsdme–/–Mlkl–/– BMDMs and Gly-treated WT, Gsdmd–/–, Gsdme–/–, Mlkl–/–, Gsdmd–/–Gsdme–/–, Gsdmd–/–Mlkl–/–, and Gsdmd–/–Gsdme–/–Mlkl–/– BMDMs following challenge with HS (43 °C for 30 min). B Data are shown as mean. The detailed data analysis used for panels A and B is described in the “Methods”. C Data are shown as mean ± SEM; *P < 0.05, **P < 0.01 (two-tailed t-test; n = 3–6 samples from GSE48398). D, F, H Images are representative of at least three independent experiments. F, H Scale bar, 50 μm. E, G, J Data are shown as mean ± SEM; **** P < 0.0001 (one-way ANOVA with Bonferroni’s multiple comparisons test; n = 4 from 4 biologically independent samples). I Data are shown as mean ± SEM; ***P < 0.001 (two-tailed t-test; n = 3 from 3 biologically independent samples). Exact P values are presented in Supplementary data file 2. For uncropped western blots, see the accompanying source data.
Fig. 5
Fig. 5. The caspase-8/RIPK3 axis regulates NINJ1 oligomerization to control cell death.
A Analysis of cell death in lipopolysaccharide (LPS)-primed wild type (WT), Casp7–/–, Casp8–/–Ripk3–/–, and Casp1–/–Casp11–/–Casp8–/–Ripk3–/– (QKO) bone marrow-derived macrophages (BMDMs) 16 h post-treatment (hpt) with heat stress (HS; 43 °C for 30 min) in the presence or absence of glycine (Gly). B Representative images of cell death in (A) at 16 hpt. C Immunoblot analysis of NINJ1 and pro- (P55) and cleaved (P44 and P18) caspase-8 (CASP8) in LPS-primed WT and Casp8–/–Ripk3–/– BMDMs at the indicated timepoints after HS (43 °C for 30 min). M, media control. D Blue native polyacrylamide gel electrophoresis (BN-PAGE) analysis of NINJ1 in WT and Casp8–/–Ripk3–/– BMDMs 12 h after HS (43 °C for 30 min) with the indicated conditions. SDS-PAGE analysis of NINJ1 and actin is used as the internal control. E Immunofluorescence images of NINJ1 in LPS-primed WT, Gly-treated WT, Casp8–/–Ripk3–/–, and Ninj1–/– BMDMs 12 hpt following HS (43 °C for 30 min). Nuclei were stained with DAPI. Arrowheads indicate NINJ1 specks. The differential interference contrast (DIC) image depicts the same cells as shown in the WT enlarged panel. A Data are shown as mean ± SEM; NS, not significant, **P < 0.01, ****P < 0.0001 (two-tailed t-test; n = 3 from 3 biologically independent samples). BE Images are representative of at least three independent experiments. B Scale bar, 50 μm. E Scale bar, 25 μm. Exact P values are presented in Supplementary data file 2. For uncropped western blots, see the accompanying source data.
Fig. 6
Fig. 6. Inhibition of inflammatory cell death, PANoptosis, provides protection against LPS plus heat stress-induced lethality and DAMP release in mice.
A Survival of 6- to 8-week-old male and female wild-type (WT) mice injected with PBS or lipopolysaccharide (LPS) (5 mg/kg body weight) for 2 h, followed by heat stress (HS) at 39 °C for 2 h. The survival was monitored for 72 h following HS. PBS (n = 10), LPS (n = 9), PBS + HS (n = 12), LPS + HS (n = 10). B Survival of 6- to 8-week-old WT (n = 10), Ninj1–/– (n = 10), Casp8–/–Ripk3–/– (n = 8), Casp1–/–Casp8–/–Ripk3–/– (TKO; n = 10), and Casp1–/–Casp11–/–Casp8–/–Ripk3–/– (QKO; n = 10) mice injected with LPS (5 mg/kg body weight) for 2 h, followed by HS at 39 °C for 2 h. The survival was monitored for 72 h following HS. C–F Analysis of (C) LDH, (D) HMGB1, (E) IL-1β, and (F) IL-18 levels in the serum of untreated WT mice (mock, n = 6) or WT (n = 6), TKO (n = 6), and QKO (n = 6) mice injected with LPS (5 mg/kg body weight) for 2 h, followed by HS at 39 °C for 2 h. The serum was collected at 36 h post-HS. AF Data are pooled from three independent experiments. A, B *P < 0.05, **P < 0.01, ***P < 0.001, and ****P < 0.0001 (log-Rank [Mantel-Cox] test). C–F Data are shown as mean ± SEM; ****P < 0.0001 (one-way ANOVA with Bonferroni’s multiple comparisons test). Exact P values are presented in Supplementary data file 2.

Similar articles

Cited by

References

    1. Man SM, Karki R, Kanneganti TD. Molecular mechanisms and functions of pyroptosis, inflammatory caspases and inflammasomes in infectious diseases. Immunol. Rev. 2017;277:61–75. - PMC - PubMed
    1. El-Radhi, A. S. Clinical Manual of Fever in Children, 53–68 (2019).
    1. Evans SS, Repasky EA, Fisher DT. Fever and the thermal regulation of immunity: the immune system feels the heat. Nat. Rev. Immunol. 2015;15:335–349. - PMC - PubMed
    1. Hasday JD, Fairchild KD, Shanholtz C. The role of fever in the infected host. Microbes Infect. 2000;2:1891–1904. - PubMed
    1. Earn DJ, Andrews PW, Bolker BM. Population-level effects of suppressing fever. Proc. Biol. Sci. 2014;281:20132570. - PMC - PubMed