. 2024 Feb 26;15(1):1745.
doi: 10.1038/s41467-024-45614-3.

Human cytomegalovirus exploits STING signaling and counteracts IFN/ISG induction to facilitate infection of dendritic cells

Affiliations

Human cytomegalovirus exploits STING signaling and counteracts IFN/ISG induction to facilitate infection of dendritic cells

Bibiana Costa et al. Nat Commun. .

Abstract

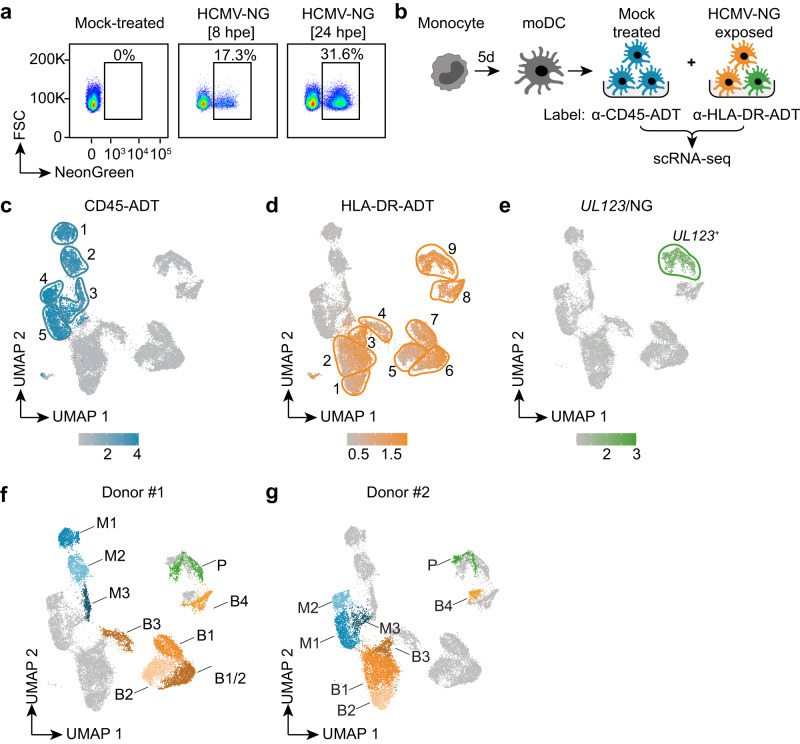
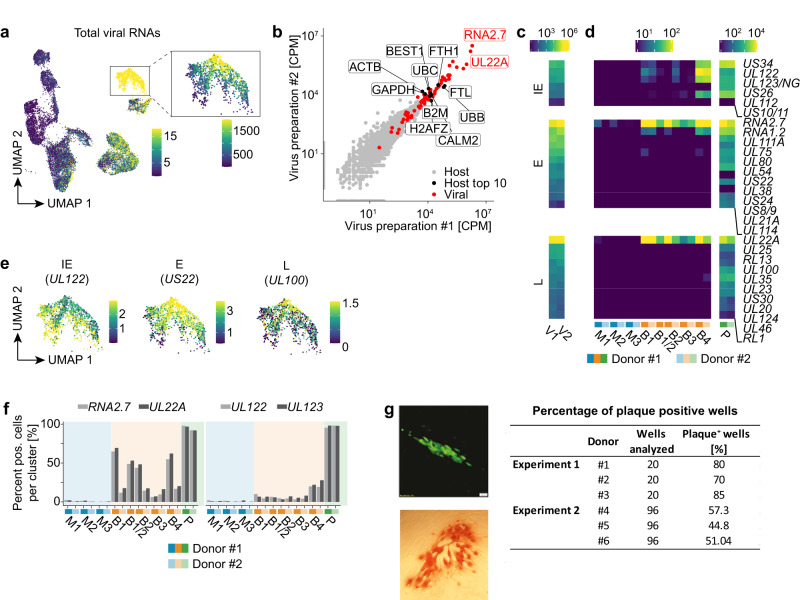
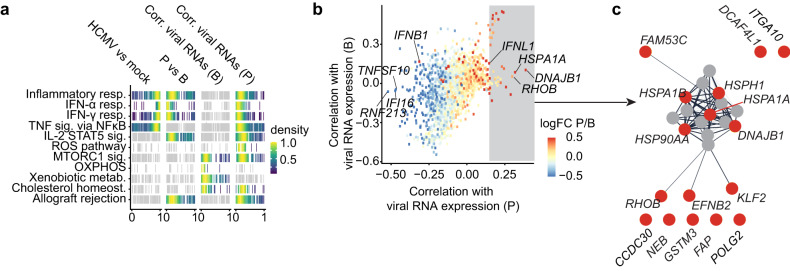
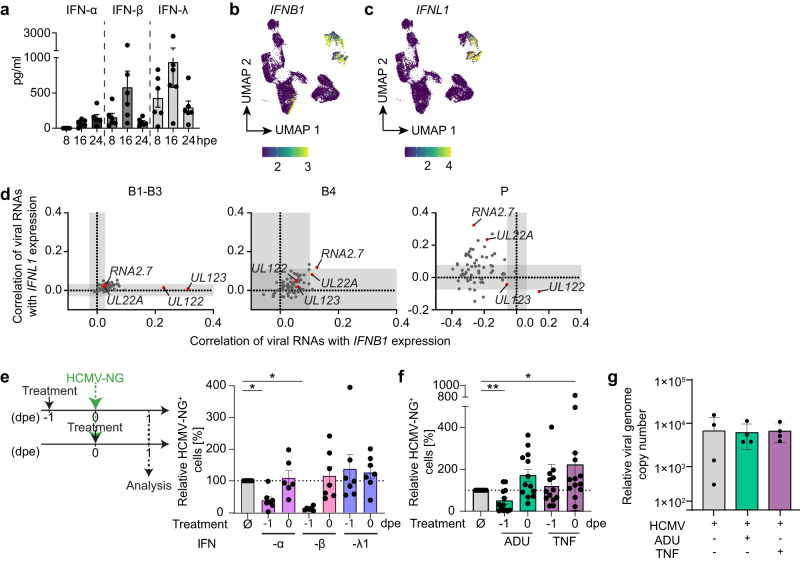
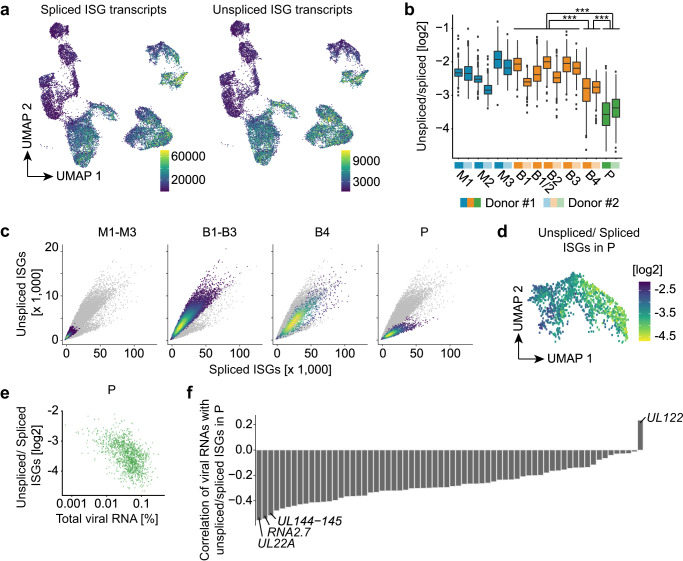
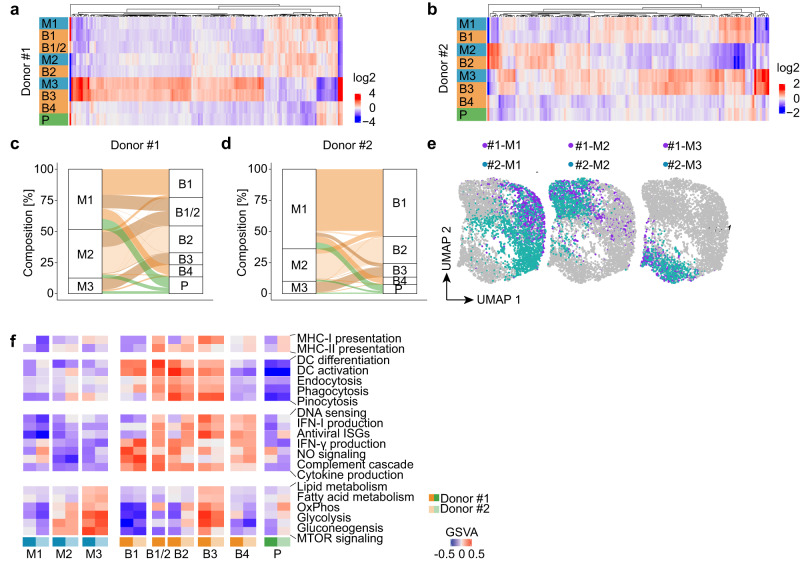
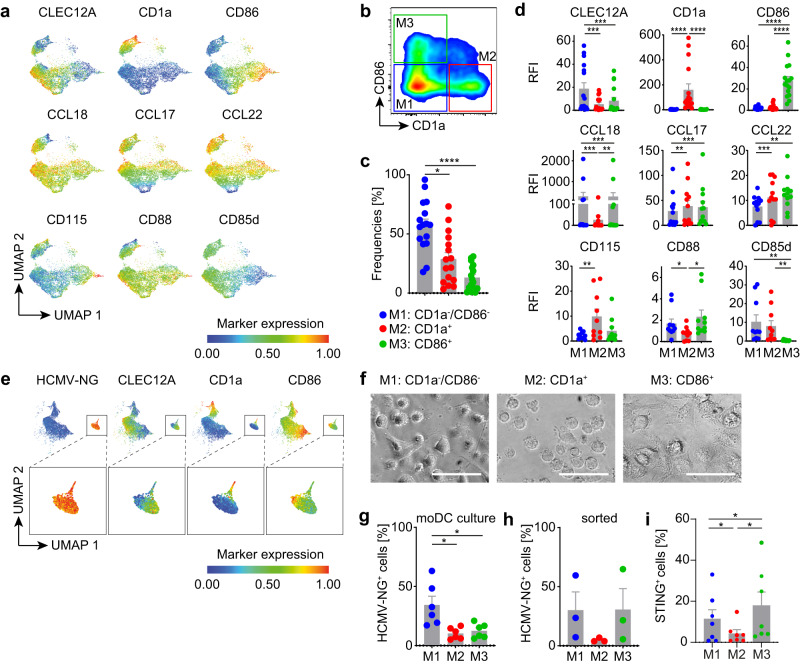
Human cytomegalovirus (HCMV) is a widespread pathogen that in immunocompromised hosts can cause life-threatening disease. Studying HCMV-exposed monocyte-derived dendritic cells by single-cell RNA sequencing, we observe that most cells are entered by the virus, whereas less than 30% of them initiate viral gene expression. Increased viral gene expression is associated with activation of the stimulator of interferon genes (STING) that usually induces anti-viral interferon responses, and with the induction of several pro- (RHOB, HSP1A1, DNAJB1) and anti-viral (RNF213, TNFSF10, IFI16) genes. Upon progression of infection, interferon-beta but not interferon-lambda transcription is inhibited. Similarly, interferon-stimulated gene expression is initially induced and then shut off, thus further promoting productive infection. Monocyte-derived dendritic cells are composed of 3 subsets, with one being especially susceptible to HCMV. In conclusion, HCMV permissiveness of monocyte-derived dendritic cells depends on complex interactions between virus sensing, regulation of the interferon response, and viral gene expression.


Conflict of interest statement

The authors declare no competing interests.

Figures

Fig. 1
Fig. 1. Single-cell RNA sequencing reveals heterogeneity of human monocyte-derived dendritic cells.
Blood-derived CD14+ monocytes were differentiated to moDCs and exposed to HCMV-NG (NeonGreen) at MOI 6. a Flow cytometry analysis of mock-treated and HCMV-NG exposed moDCs 8 and 24 hours post virus exposure (hpe). b Schematic depiction of the experimental setup (symbols from BioRender). Mock-treated and HCMV-NG exposed moDCs were labeled 8 hpe with anti-CD45-ADT and anti-HLA-DR-ADT antibodies, respectively, and pooled prior to scRNA-seq. This experiment was performed in four runs with moDCs from two donors and with two independent virus preparations. c, d Data from all four scRNA-seq runs were combined for non-linear dimensionality reduction (UMAP) and unsupervised clustering (bordered and numbered areas). Log normalized feature counts are shown for CD45-ADT (cells shown in blue) (c) and HLA-DR-ADT (cells shown in orange) (d). Two clusters (shown without borders) were identified to be composed of doublets and were removed for further analysis. e UMAP visualization of SCTransform normalized feature counts for the viral UL123/NeonGreen gene (cells shown in green). f Donor #1 and g donor #2 comprised 3 mock treated clusters (M1-3, CD45-ADT+), 4-5 bystander clusters (B1-4, HLA-DR-ADT+/UL123low), and 1 productively infected cluster (P, HLA-DR-ADT+/UL123high). Different colors show clusters with divergent gene expression profiles between mock, bystander, and productively infected moDCs from the two different analyzed donors.
Fig. 2
Fig. 2. Most HCMV-NG exposed moDCs contain virion-associated RNAs, but only few ones show de novo viral gene expression.
a UMAP embedding showing the total expression of viral RNAs (SCTransform normalized values) in the dataset analyzed also in Fig. 1. The color scale is chosen to highlight cells with weak viral gene expression, and all cells shown in yellow have expression values > 15. The inset shows the total expression of viral RNAs for cluster P with a different color scale resolving cells with strong viral gene expression. Here all cells shown in yellow have expression values > 1500. b Scatter plot showing the abundance of host (grey dots) and viral (red dots) RNAs (in counts per million) in the two independent virus preparations. The two most abundant viral RNAs (RNA2.7, UL22A) and the ten most abundant host RNAs (black dots) are labeled. Heatmap showing the abundance of viral RNAs in the virus preparations V1 and V2 (c) and in the clusters detected by scRNA-seq (d) (counts per million). IE genes are significantly more expressed in B4 than in B1-3 (p < 3.5e-57, two-sided Wilcoxon rank sum test). e UMAP embeddings depicting the expression (SCTransform normalized values) of representative viral RNAs of the different kinetic classes of HCMV gene expression in P. f Bar diagram showing the abundance (% of all cells that have detectable expression) of virion-associated (RNA2.7 and UL22A) and de novo transcribed (UL122 and UL123) viral RNAs in mock-treated and HCMV-NG exposed cells. g HCMV-NG exposed moDCs were FACS sorted and single NG+ moDCs were seeded on monolayers of MRC-5 cells. After 4 days of incubation, NG+ plaques were detected in the MRC-5 monolayer by wide-field fluorescent microscopy. A representative NG+ plaque is shown in the upper panel, and in the lower panel, one representative IE1+ plaque is shown, as detected by light microscopy of HRP-IE1 immunolabeled cells. The table shows the quantification of the number of wells analyzed and the number of wells showing NG+ plaques from 6 independent donors from 2 independent experiments.
Fig. 3
Fig. 3. Viral RNA expression is associated with decreased ISG and increased heat shock protein expression.
a Pathway analysis (i) of differentially regulated genes in HCMV-NG exposed versus mock-treated (1st panel), (ii) of productively infected versus bystander moDCs (2nd panel), and (iii) correlation of host genes with viral RNA expression in bystander (3rd panel) and (iv) in productively infected moDCs (4th panel). Shown are all MSigDB Hallmark pathways in which at least one analysis was statistically significant (highlighted in color, p < 0.01, two-sided Wilcoxon test, Benjamini-Hochberg multiple testing correction). Each vertical line is the rank of the fold change (1st and 2nd panel) or of the Spearman correlation (3rd and 4th panel) for a pathway gene. Ranks are divided by the total number of genes in a manner that rank 0 represents the value of the most down-regulated (1st and 2nd panel) or negatively correlated genes (3rd and 4th panel), whereas rank 1 represents the most up-regulated (1st and 2nd panel) or positively correlated (3rd and 4th panel) gene. Colors represent kernel density estimates of ranks with the mode of the density scaled to 1. b Spearman’s correlation coefficients between total viral RNA expression and expression of individual host genes across bystander cells (B, y-axis) and productively infected cells (P, x-axis). Dots are colored depending on their expression level in P relative to B (FC, fold change) revealing more down- (blue, n = 94) than upregulated (red, n = 29) genes (Wilcoxon test, false discovery rate < 0.01, absolute log2 fold change >0.5). c Protein-protein interaction network derived from the functional enrichment analysis provided by the STRING database. The data shows the 16 most positively correlated genes in HCMV-NG exposed clusters (highlighted in red). Connections represent predicted functional evidence for protein-protein interactions.
Fig. 4
Fig. 4. IFNB1 correlates with viral IE gene expression, whereas the progression of viral infection inhibits IFNB1, but not IFNL1 induction.
a moDCs were exposed to HCMV-NG and supernatants were harvested completely and replenished with fresh medium 8, 16 and 24 hpe to determine the IFN-α, IFN-β or IFN-λ content by ELISA methods. Mean ± SEM of 6 different donors from 2 independent experiments. UMAP embeddings showing expression levels (SCTransform normalized values) of IFNB1 (b) and IFNL1 (c). d Spearman´s correlation coefficients of each individual viral gene with IFNB1 (x-axis) and IFNL1 (y-axis) expression for clusters B1-3 (1st graph), B4 (2nd graph), and P (3rd graph). White areas indicate statistically significant regions (p < 0.01, approximate two-sided t-test, Benjamini-Hochberg multiple testing correction). moDCs were treated one day before HCMV-NG exposure (−1) or at the time of HCMV-NG exposure (0) with e IFN-α2b (lavender bars), IFN-β (pink bars), or IFN-λ1 (blue bars), and f ADU-S100 (ADU) (green bars), or tumor necrosis factor (TNF) (purple bars), and NG+ cells were quantified by flow cytometry one (1) day post HCMV-NG exposure (dpe). Values for NG+ cells after HCMV-NG exposure and the treatment as indicated are shown relative to values for NG+ cells after HCMV-NG exposure without any other treatment, which were set to 100%. Values for HCMV-NG exposed cells without any other treatment are the same in e and f as the experiments were performed simultaneously. e Mean ± SEM of 7 different donors from 3 independent experiments. Each dot represents a single donor. *p = 0.0156 (−1 IFN-α vs. untreated), p = 0.0313 (−1 IFN-β vs. untreated) using two-sided paired Wilcoxon signed-rank test. (f) Mean ± SEM of 13 different donors from 6 independent experiments. *p = 0.0266, **p = 0.0078 using two-sided paired Wilcoxon signed-rank test. g M1, M2 and M3 moDC subsets were FACS sorted and left untreated (grey bar) or treated with ADU-S100 (ADU) or tumor necrosis factor (TNF) (green and purple bar, respectively) followed by exposure to HCMV-NG for 4 h. The genomic DNA was extracted from the soluble nuclear fraction and the relative abundance of HCMV genomes in relation to the housekeeping gene GAPDH was analyzed by qPCR. Mean ± SEM of 4 different donors from 1 experiment.
Fig. 5
Fig. 5. Initial ISG transcription in productively infected cells is inhibited upon efficient viral gene expression.
a UMAP embeddings highlighting the expression (raw feature counts) of spliced and unspliced ISG RNAs (total sum of all ISGs as defined by MSigDB). b Boxplots showing the distribution of unspliced vs. spliced log2 fold changes for ISG RNAs in all clusters (***p < 2.22e−16, two-sided Wilcoxon ranks-sum test; center line, median; box limits, upper and lower quartiles; whiskers, 1.5x interquartile range; points, outliers). Log2 fold changes are computed from the values shown in panel a. c Phase portraits showing expression of unspliced (y-axis) and spliced (x-axis) ISG RNAs per cell. Cells from clusters M1-3 (1st graph), B1-3 (2nd graph), B4 (3rd graph), and P (4th graph) are highlighted in color. d UMAP depicting the ratio of unspliced/spliced ISG RNAs per cell in P. e Unspliced/spliced ISG RNAs in P (y-axis) compared to total viral RNA expression (x-axis, in percentage relative to total feature counts per cell). f Spearman’s correlation coefficient for the ratio of unspliced/spliced ISG RNAs with the expression of single viral RNAs in P.
Fig. 6
Fig. 6. HCMV-NG exposed moDCs can be traced back to three distinct clusters as identified in mock-treated moDCs.
Heat maps showing the average expression per cluster (log2-fold change vs. the grand mean) of marker genes that were common in mock-treated and HCMV-NG exposed cells of donor #1 (a) and donor #2 (b). Alluvial charts showing the contribution of mock-treated moDCs to HCMV-NG exposed clusters of donor #1 (c) and donor #2 (d). e Donor integration by canonical correlation analysis of M1, M2, and M3 clusters. The same UMAP embedding is shown for each of the three mock-treated clusters with donors highlighted. f Pathway analysis of manually selected DC characteristics pathways for the different clusters using gene set variation analysis (GSVA). Positive GSVA scores indicate an enrichment of strongly expressed genes in a pathway.
Fig. 7
Fig. 7. moDCs comprise three different subsets that are defined by characteristic protein expression profiles and differential susceptibilities to HCMV infection.
moDCs were differentiated from 16 independent donors, CLEC12A, CD1a, CD86, CCL18, CCL17, CCL22, CD115, CD88 and CD85d were immunolabeled and analyzed by flow cytometry. a UMAP of live cells showing heatmap coloring to indicate the abundance of each of the immunolabeling markers, data of one representative donor are shown. b Mock-treated moDCs were immunolabeled as described above and the three moDC subsets were discriminated by gating of CD1a/CD86 (M1, blue dots), CD1a+ (M2, red dots) and CD86+ (M3, green dots) cells. c Frequencies and d relative fluorescence intensities (RFI) of each of the analyzed markers in the three subset gates were determined. Data represents mean ± SEM of 16 different donors from 7 independent experiments. Each dot represents a single donor. ****p < 0.0001, *p = 0.0182 using two-sided paired Wilcoxon signed-rank test (c) and ****p < 0.0001 (CD1a, CD86), ***p = 0.0010 (CCL17, CCL18), p = 0.0003 (CLEC12A), p = 0.0005 (CCL18, CCL22), **p = 0.0039 (CD115), p = 0.0093 (CCL18), 0.0020 (CD85d), p = 0.0015 (CCL17, CCL22), *p = 0.0137 (CD88) using two-sided paired Wilcoxon signed-rank test (d). e moDCs were infected with HCMV-NG, immunolabeled and analyzed as in a. UMAP of NG fluorescence and the 3 most discriminative moDC subset markers, i.e., CD1a, CD86, and CLEC12A. Insets show the expression of the above-mentioned markers only in the NG+ cluster. f Mock-treated moDC subsets were sorted using the gating strategy shown in (b) and analyzed morphologically (scale bar 50 µm). moDC cultures (g) or sorted moDCs (h) as described in b were infected with HCMV-NG and percentages of NG+ cells were determined 24 hpe. Data represents mean ± SEM of 6 different donors from 3 independent experiments. Each dot represents a single donor. *p = 0.0313 using two-sided paired Wilcoxon signed-rank test (g) and ± SEM of 3 different donors from 1 experiment. Each dot represents a single donor. i Quantification of STING protein expression from the subsets described in b. Data represents mean ± SEM of 7 different donors from 4 independent experiments. Each dot represents a single donor. *p = 0.0469 (M2 vs. M1), p = 0.0156 (M3 vs. M2), and p = 0.0313 (M3 vs. M1) using two-sided paired Wilcoxon signed-rank test.

Similar articles

Cited by

References

    1. WHO, CDC & International Clearinghouse for Birth Defects. Birth defects surveillance: a manual for programme managers. 2nd edition https://www.who.int/publications/i/item/9789240015395 (2020).
    1. Taylor-Wiedeman J, Sissons JG, Borysiewicz LK, Sinclair JH. Monocytes are a major site of persistence of human cytomegalovirus in peripheral blood mononuclear cells. J. Gen. Virol. 1991;72:2059–2064. - PubMed
    1. Sinzger C, Plachter B, Grefte A, The TH, Jahn G. Tissue macrophages are infected by human cytomegalovirus in vivo. J. Infect. Dis. 1996;173:240–245. - PubMed
    1. Spector WG, Walters MN, Willoughby DA. The origin of the mononuclear cells in inflammatory exudates induced by fibrinogen. J. Pathol. Bacteriol. 1965;90:181–192. - PubMed
    1. Shi C, Pamer EG. Monocyte recruitment during infection and inflammation. Nat. Rev. Immunol. 2011;11:762–774. - PMC - PubMed

MeSH terms

Grants and funding