. 2024 Feb 26;9(1):12.
doi: 10.1038/s41539-024-00224-y.

Cerebellar interpositus nucleus exhibits time-dependent errors and predictive responses

Affiliations

Cerebellar interpositus nucleus exhibits time-dependent errors and predictive responses

Gloria G Parras et al. NPJ Sci Learn. .

Abstract

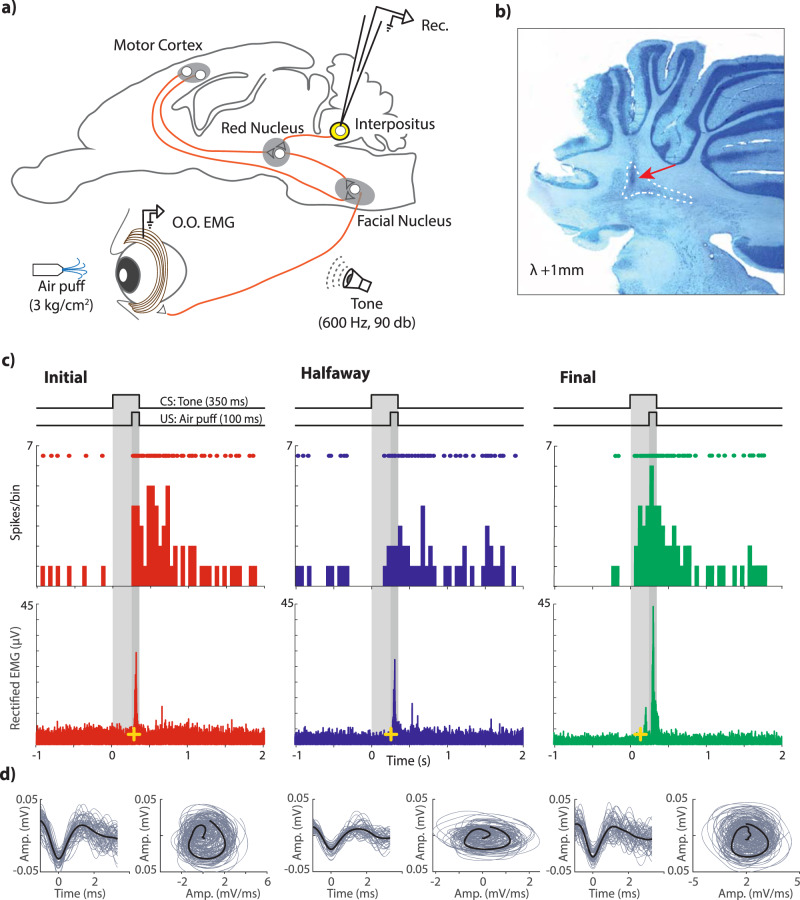
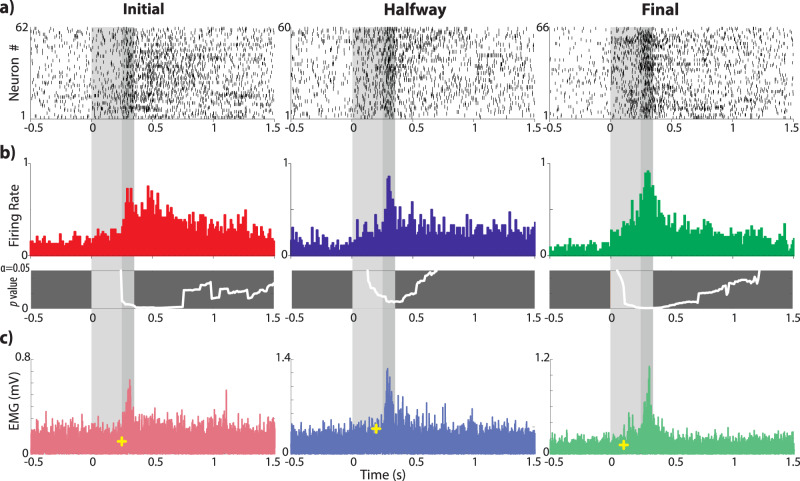
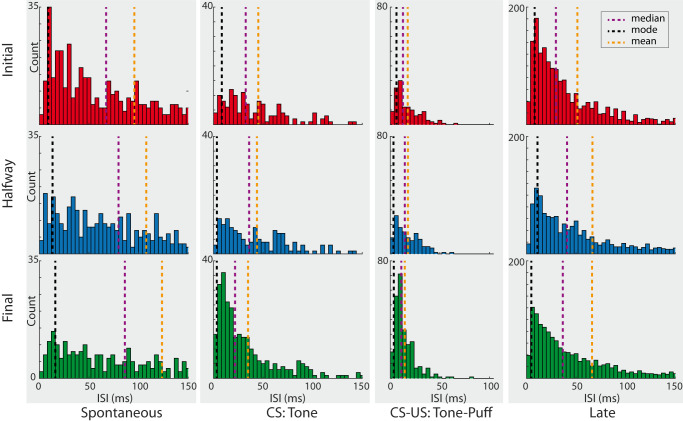
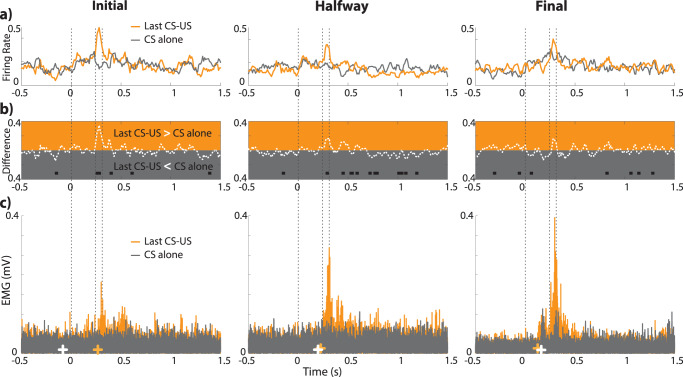
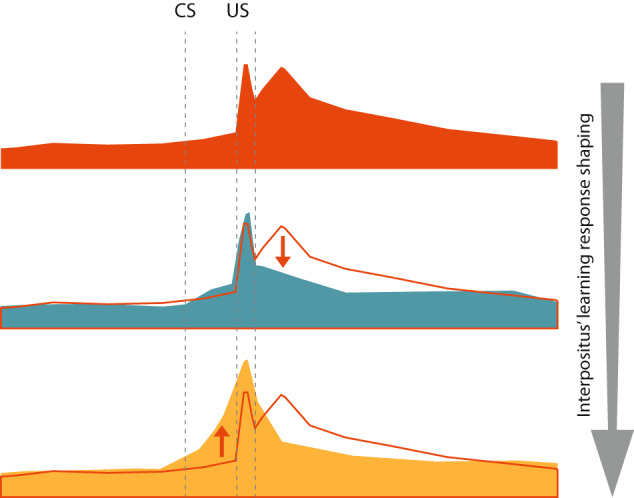
Learning is a functional state of the brain that should be understood as a continuous process, rather than being restricted to the very moment of its acquisition, storage, or retrieval. The cerebellum operates by comparing predicted states with actual states, learning from errors, and updating its internal representation to minimize errors. In this regard, we studied cerebellar interpositus nucleus (IPn) functional capabilities by recording its unitary activity in behaving rabbits during an associative learning task: the classical conditioning of eyelid responses. We recorded IPn neurons in rabbits during classical eyeblink conditioning using a delay paradigm. We found that IPn neurons reduce error signals across conditioning sessions, simultaneously increasing and transmitting spikes before the onset of the unconditioned stimulus. Thus, IPn neurons generate predictions that optimize in time and shape the conditioned eyeblink response. Our results are consistent with the idea that the cerebellum works under Bayesian rules updating the weights using the previous history.


Conflict of interest statement

The authors declare no competing interests.

Figures

Fig. 1
Fig. 1. Experimental design.
a Schematic diagram of the rabbit brain and eye illustrating the recording sites. b A representative photomicrography of a Nissl-stained brain section illustrating the track left by a glass micropipette. The dotted line outlines IPn boundaries. c Representative examples of three putative IPn neurons and their corresponding O.O. EMG for successive conditioning sessions. Red, blue, and green data correspond to the initial, halfway, and final conditioning sessions, respectively. From top to bottom are illustrated the CS (tone), the US (air puff), the firing activity of the selected neurons, their firing rates (spikes/bin), and the O.O. EMG. Yellow crosses indicate the precise moment at which a significant voltage change was detected in the recorded EMG (see “Methods”): initial = 276.8 ms; halfway = 263.2 ms, and final = 141.6 ms latencies with relation to CS presentation. d Spike waveform (left) and phase-space portrait (right) for each of the illustrated neurons. Spike sorting is based on a 24 D-vector for the first derivative in the time domain and phase-space.
Fig. 2
Fig. 2. Neuronal and rectified EMG responses across classical eyeblink conditioning sessions.
a Dot rasters of the recorded single IPn neurons during initial, halfway, and final conditioning sessions. Each dot on a row represents an action potential generated by one neuron during the corresponding trial. The Y-axis indicates the total number of neurons plotted and included in the analysis. Shadowed areas indicate the timing of CS (light gray) and CS-US (dark gray) presentations. b PSTH distribution of neuronal spike times for the three recorded conditioning sessions (initial in red, halfway in blue, and final in green; bin size 10 ms). The bottom panels show the instantaneous p value (white trace) of the corresponding PSTH (Wilcoxon signed-rank test for 300 comparisons, corrected for FDR = 0.1 and smoothed. The critical threshold for significance was set at p = 0.05 and is represented as the upper boundary of the box). c Rectified and averaged O.O. EMG. The yellow crosses indicate the precise moment at which we found an abrupt change in the voltage of the EEG signal. Note that significant EMG changes happened at 245.2 ms, 199.0 ms, and 102.8 ms after tone onset for non-conditioned, halfway, and conditioned sessions, respectively. Thus, animals learned to anticipate the eyeblink to avoid the US acting on the cornea. We found analogous decreases in the latency of IPn neuron activation with respect to CS presentation.
Fig. 3
Fig. 3. Violin plots representing the binned spike count for each time window (spontaneous, CS, CS-US, and late) and conditioning session (initial, halfway, and final).
The white dot and the gray line inside each distribution indicate the median and the interquartile range. Asterisks denote statistically significant differences between conditioning sessions (n.s., non-significant, *p < 0.05, **p < 0.01, ***p < 0.001).
Fig. 4
Fig. 4. ISI histograms for each time window and conditioning session.
The first row is for the initial, the second row for halfway, and the third row for final conditioning sessions. Dotted lines indicate the mode, median, and mean of the ISIs distribution. Note that ISIs become longer at spontaneous and late windows across conditioning, while ISIs become shorter during CS presentations. These results indicate that the IPn optimizes its firing activity to predict the US.
Fig. 5
Fig. 5. Comparisons between the firing patterns of IPn neurons across the successive conditioning sessions.
a Averaged binned spike count profiles for initial vs. halfway conditioning sessions (same data as in Fig. 2). White squares indicate the precise moment when the comparison between the two conditioning sessions is significantly different (two-sample t test, p < 0.01). b, c Same as in (a) but computed for halfway vs. final, and for initial vs. final, respectively. Note that from initial to halfway there was a significant reduction in firing rates following the end of the US (b), while the emergence of the conditioned response occurred once learning was well established (c).
Fig. 6
Fig. 6. Cross-correlation analysis between the firing rate of IPn neurons and the O.O. EMG across conditioning sessions.
a A colormap illustrating the correlation coefficient magnitude corresponding to time lags between –100 ms and 180 ms. The rectified O.O. EMG was displaced in steps of 10 ms with respect to the neuronal firing rate. In agreement with this, each block represents a 10 ms lag. Data are shown from top to bottom for the initial, halfway, and final sessions. b A representation of the highest cross-correlation index indicated in (a) with caret symbols (^). Black and gray lines represent the averaged spike count and the rectified EMG during the stimulus representation, respectively. From top to bottom, the highest r coefficient value occurs when the EMG is shifted backward –10 ms (for initial), 0 ms (for halfway), and +20 ms (for final), respectively. Note that the highest r values move from negative to positive lags across conditioning. Similarly, the number of lags with r values > 0.6 increases with the conditioning process. These results indicate that the IPn tunes a temporary transformation during the acquisition of a newly learned motor response.
Fig. 7
Fig. 7. Comparisons between last paired CS-US trials and CS alone trials across conditioning sessions.
a Neuronal responses in the PSTH profile distribution for the last paired CS-US trials (orange) and CS alone trials (gray). b Firing rate differences between the last CS-US and CS alone sessions, with black squares indicating statistically significant moments (p < 0.05, Wilcoxon signed rank test). c Averaged and rectified O.O. EMG for the last paired CS-US trials (orange) and the CS alone (gray). Crosses denote precise moments of signal changes (white for the CS alone and orange for the CS-US). Note that statistically significant differences in the period where the US occurs (or is omitted), vanishes across the successive conditioning sessions. These results indicate that, when animals are well conditioned, there are not differences at the neuronal level between the presence or the omission of the US. Furthermore, the EMG activity delineates the progression of the conditioned eyelid responses.
Fig. 8
Fig. 8. A diagrammatic representation of the modulation of IPn neuronal responses across learning.
From top to bottom are shown the temporal time-courses of IPn neuronal responses across initial (orange), halfway (cyan), and final (yellow) conditioning sessions. The orange outline is the silhouette of the initial conditioning session. The illustrated profiles are cartoon representations from the actual averaged data. Note the IPn activity is sustained in time after the stimulus offset before learning acquisition. Afterward, this sustained late response is reduced, and finally, the conditioned response is generated.

Similar articles

Cited by

References

    1. Delgado-García JM, Gruart A. The role of interpositus nucleus in eyelid conditioned responses. Cerebellum. 2002;1:289–308. - PubMed
    1. Delgado-García JM, Gruart A. Learning as a functional state of the brain: Studies in wild-type and transgenic animals. Adv. Exp. Med. Biol. 2017;1015:75–93. - PubMed
    1. Parr T, Friston KJ. The anatomy of inference: Generative models and brain structure. Front. Comput. Neurosci. 2018;12:90. - PMC - PubMed
    1. Friston K. A theory of cortical responses. Philos. Trans. R. Soc. B Biol. Sci. 2005;360:815–836. - PMC - PubMed
    1. Clark A. Whatever next? Predictive brains, situated agents, and the future of cognitive science. Behav. Brain Sci. 2013;36:181–204. - PubMed