. 2024 Feb 26;15(1):1352.
doi: 10.1038/s41467-024-45440-7.

Targeting HDAC6 to treat heart failure with preserved ejection fraction in mice

Affiliations

Targeting HDAC6 to treat heart failure with preserved ejection fraction in mice

Sara Ranjbarvaziri et al. Nat Commun. .

Erratum in

Abstract

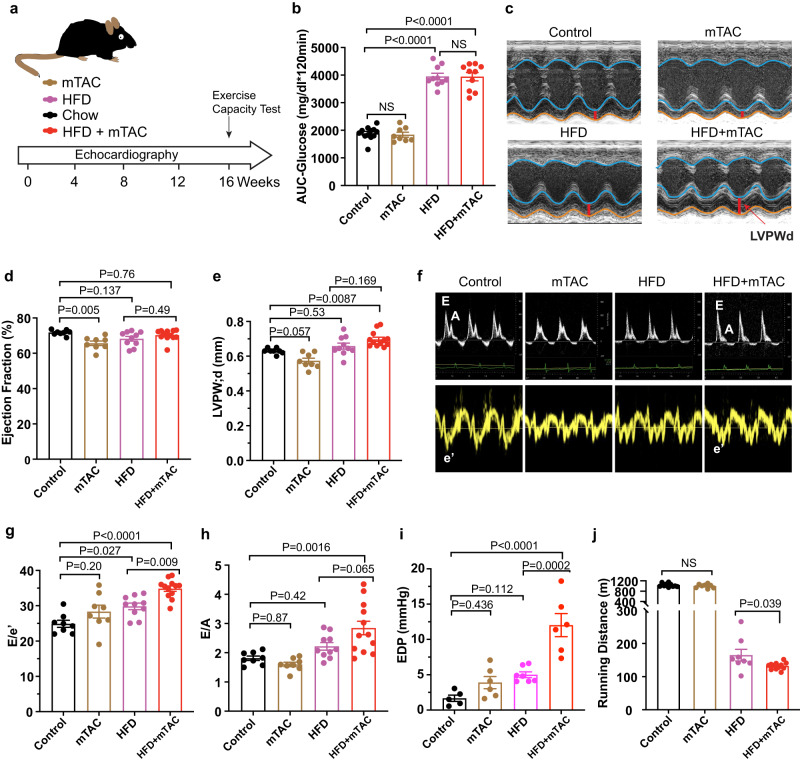
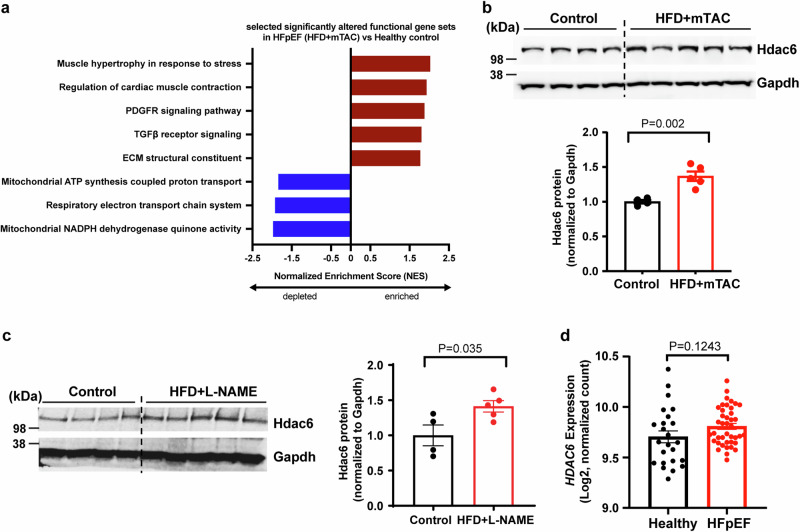
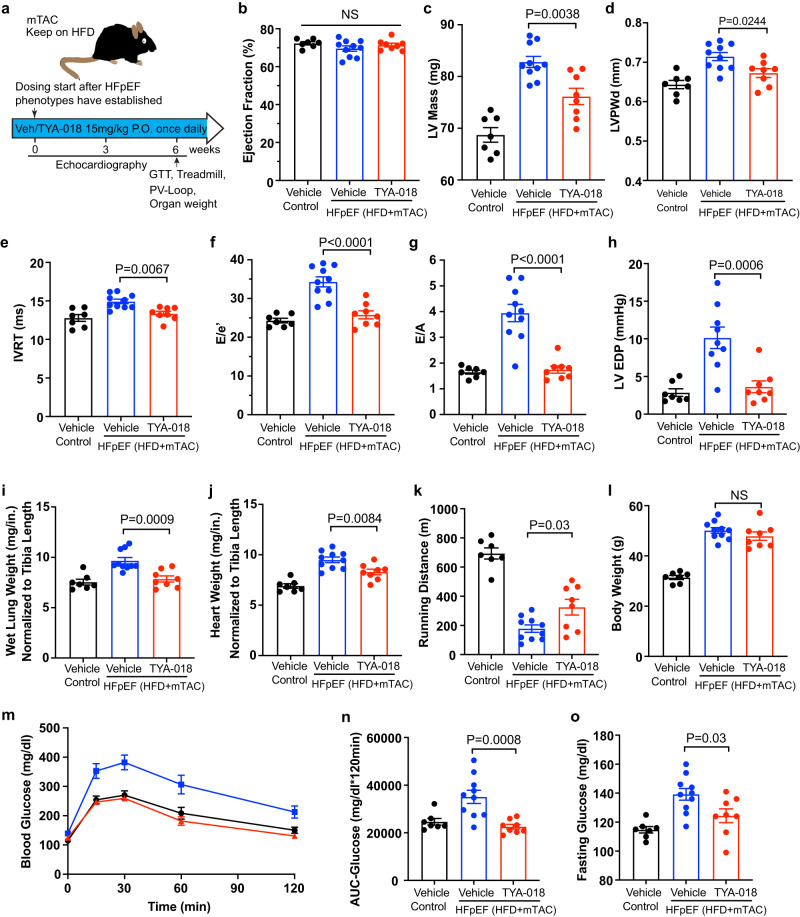
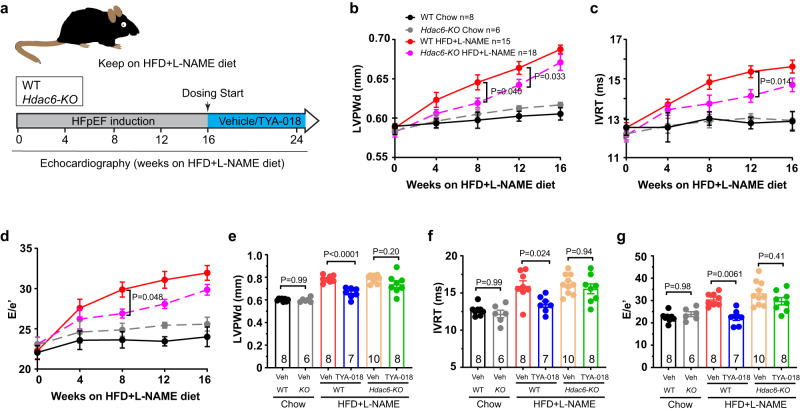
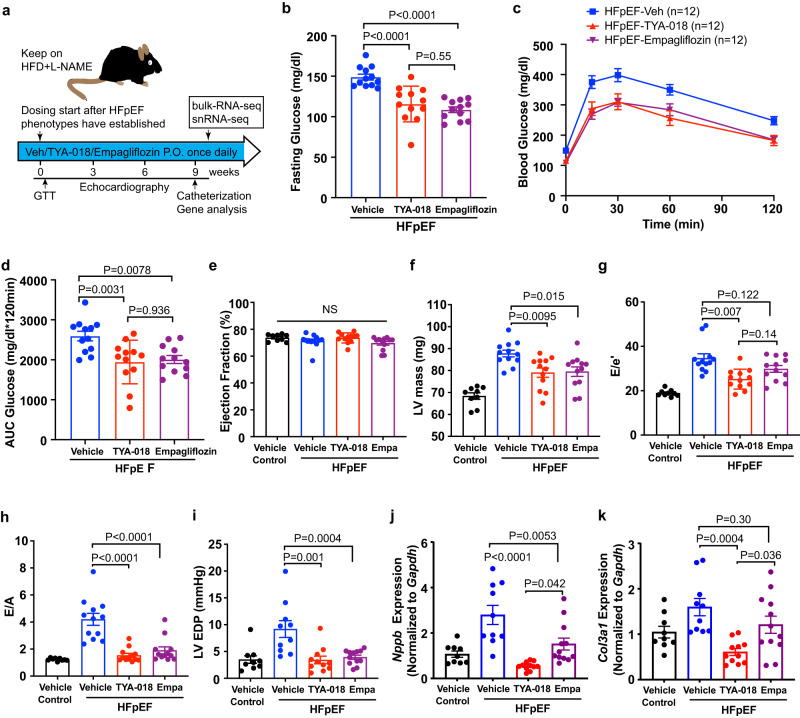
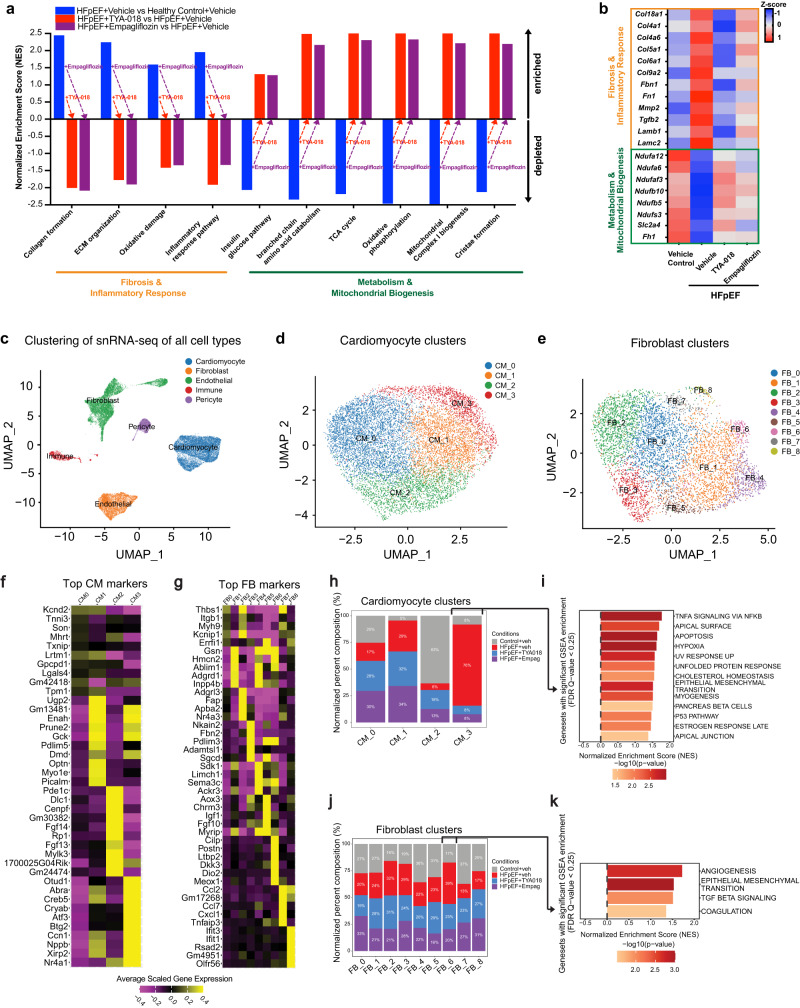
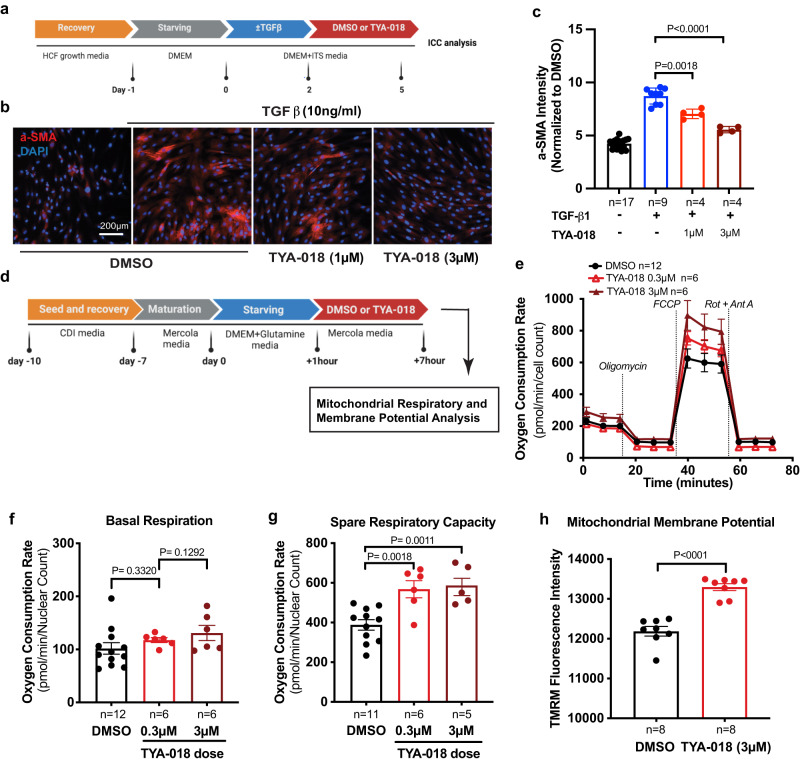
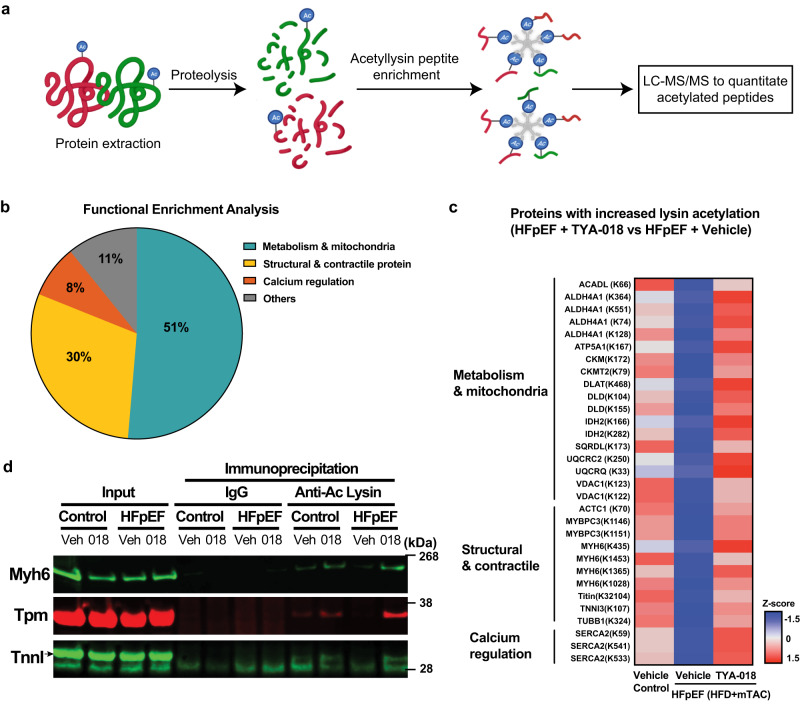
Heart failure with preserved ejection fraction (HFpEF) poses therapeutic challenges due to the limited treatment options. Building upon our previous research that demonstrates the efficacy of histone deacetylase 6 (HDAC6) inhibition in a genetic cardiomyopathy model, we investigate HDAC6's role in HFpEF due to their shared mechanisms of inflammation and metabolism. Here, we show that inhibiting HDAC6 with TYA-018 effectively reverses established heart failure and its associated symptoms in male HFpEF mouse models. Additionally, in male mice lacking Hdac6 gene, HFpEF progression is delayed and they are resistant to TYA-018's effects. The efficacy of TYA-018 is comparable to a sodium-glucose cotransporter 2 (SGLT2) inhibitor, and the combination shows enhanced effects. Mechanistically, TYA-018 restores gene expression related to hypertrophy, fibrosis, and mitochondrial energy production in HFpEF heart tissues. Furthermore, TYA-018 also inhibits activation of human cardiac fibroblasts and enhances mitochondrial respiratory capacity in cardiomyocytes. In this work, our findings show that HDAC6 impacts on heart pathophysiology and is a promising target for HFpEF treatment.


Conflict of interest statement

The authors of this publication are employed by Tenaya Therapeutics and hold stock in the company. This potential conflict of interest has been thoroughly reviewed and managed by Tenaya Therapeutics. There are no other competing interests.

Figures

Fig. 1
Fig. 1. HFD + mTAC mice developed key phenotypes of clinical HFpEF.
a Schematic overview of study design. Wild-type male C57BL/6J mice were separated into the following regimens for 16 weeks: standard chow (control), HFD, mTAC, or HFD+mTAC for 16 weeks. Heart function was measured with echocardiography every 4 weeks. b Area under the curve (AUC) of an intraperitoneal glucose-tolerance test of mice 16 weeks after induction (control n = 12, mTAC n = 8, HFD n = 10, HFD+mTAC n = 10 mice). c Representative LV M-mode echocardiographic tracings. Images are representative of 8–10 independent mice. d, e Echocardiographic measurement of ejection fraction and LVPWd 16 weeks after induction (control n = 8, mTAC n = 8, HFD n = 10, HFD+mTAC n = 12 mice). f Representative pulsed-wave Doppler (top) and tissue Doppler (bottom) tracings after 16 weeks of induction. Images are representative of 8–10 independent mice. g, h Non-invasive Doppler analysis of E/e’ and E/A ratios 16 weeks after induction (control n = 8, mTAC n = 8, HFD n = 10, HFD+mTAC n = 12 mice). i Pressure-volume loop measurement of EDP in each group of mice at 16 weeks after induction (control n = 5, mTAC n = 6, HFD n = 7, HFD+mTAC n = 6 mice). j Running distance during exercise exhaustion test (control n = 10, mTAC n = 8, HFD n = 8, HFD+mTAC n = 12 mice). Data are expressed as the mean ± SEM. Statistical analysis was performed using one-way ANOVA followed by Tukey’s multiple comparisons test (b, d, e, gi). Statistical significance was assessed by unpaired two-sided Student’s t test between the two groups of HFD and HFD+mTAC (j). The exact P values are shown in the figures. NS, not significant. Source data are provided as a Source Data file.
Fig. 2
Fig. 2. HDAC6 upregulation in heart tissues from HFpEF mouse models and patients with HFpEF.
a Gene Ontology terms associated with upregulated and downregulated genes in HFD+mTAC mice (n = 5) versus control mice (n = 3). b Western blot analysis and quantitation of Hdac6 protein in heart tissues from control (n = 4) and HFD+mTAC mice (n = 5). c Western blot analysis and quantitation of Hdac6 protein in heart tissues of control (n = 4) and HFD + L-NAME mice (n = 5). d Quantitation of HDAC6 mRNA expression in human heart tissues of healthy (n = 24) and patients with HFpEF (n = 41) from published RNA-Seq data. Data are expressed as the mean ± SEM. Statistical significance was assessed by unpaired two-sided Student’s t test (b, c), or unpaired two-sided t test with Welch’s correction (d). The exact P values are shown in the figure. ECM, extracellular matrix. Source data are provided as a Source Data file.
Fig. 3
Fig. 3. HDAC6 inhibition by TYA-018 reverses pre-existing heart failure in HFpEF model.
a Schematic overview of study design. C57BL/6J mice with established HFpEF induced by HFD+mTAC were randomized to receive oral dosing of vehicle or TYA-018 (15 mg/kg) once per day. Heart function was measured with echocardiography at 3 and 6 weeks after treatment began. Quantitation of (b) EF, (c) LV mass and (d) LVPWd by echocardiography after 6 weeks of treatment. Quantitation of (e) IVRT, (f) E/e’ ratio, and (g) E/A ratio by non-invasive Doppler analysis after 6 weeks of treatment. h EDP invasively measured by intracardiac catheterization (Control n = 7, HFD+mTAC-Vehicle n = 9, HFD+mTAC-TYA-018 n = 8 mice). i Lung and (j) heart weight normalized to tibia length. k Running distance during exercise exhaustion test after 6 weeks of treatment. l Body weight of mice. m Blood glucose and (n) quantification of the area under the curve (AUC) of intraperitoneal glucose-tolerance test (GTT) after TYA-018 treatment. o Fasting blood glucose at 6 h after the last dose of TYA-018. Mice numbers: Control n = 7, HFD+mTAC-vehicle n = 10, HFD+mTAC-TYA-018 n = 8 (bg, io). Data are expressed as the mean ± SEM. Statistical analysis was performed using one-way ANOVA followed by Tukey’s multiple comparisons test (bl, n, o). The exact P values are shown in the figures. NS not significant. Source data are provided as a Source Data file.
Fig. 4
Fig. 4. Hdac6-KO mice exhibit slower progression of HFpEF, and do not respond to TYA-018 treatment.
a Schematic overview of study design. Hdac6 knockout (KO) and wild-type (WT) mice treated with HFD + L-NAME for 16 weeks and then randomized to receive oral dosing of vehicle or TYA-018 (15 mg/kg) once per day for 8 weeks. Heart function was measured by echocardiography. Time course of (b) LVPWd, (c) IVRT (d) E/e’ ratio at 4, 8, 12, and 16 weeks after HFD + L-NAME induction. Quantitation of (e) LVPWd, (f) IVRT and (g) E/e’ ratio after 8 weeks of TYA-018 treatment. Mice number in each group is indicated in graphs. Data are expressed as the mean ± SEM. Statistical analysis was performed using two-way ANOVA (bd) or one-way ANOVA followed by Tukey’s multiple comparisons test (eg). The exact P values are shown in the figures. Source data are provided as a Source Data file.
Fig. 5
Fig. 5. TYA-018 has comparable efficacy to empagliflozin in HFpEF model.
a Schematic overview of study design. C57BL/6J mice with established HFpEF induced by HFD + L-NAME were randomized to receive oral dosing of vehicle, TYA-018 (15 mg/kg), or empagliflozin (10 mg/kg) once per day. b Quantitation of blood glucose at 6 h after dosing with TYA-018 or empagliflozin and fasting. Blood glucose (c) and area under the curve (d) of the intraperitoneal glucose-tolerance test (GTT) (n = 12 mice in each group). Heart function was measured with echocardiography every 3 weeks, and mice were euthanized after 9 weeks of treatment. Quantitation of (e) EF, (f) LV mass, (g) E/e’ and (h) E/A ratios by echocardiography and non-invasive Doppler after 9 weeks of treatment (n = 9 in control vehicle group, n = 12 in each of the other groups). Quantitation of EDP (i) by invasive intracardiac catheterization before euthanization at 9 weeks after treatment (Vehicle control n = 9, HFpEF-vehicle n = 10, HFpEF-TYA-018 n = 11, HFpEF-Empa n = 12). Quantitation of Nppb (j) and Col3a1 (k) mRNA in mouse hearts after 9 weeks of treatment (Vehicle control n = 9, HFpEF-vehicle n = 10, HFpEF-TYA-018 n = 11, HFpEF-Empa n = 12). Data are expressed as the mean ± SEM. Statistical analysis was performed using one-way ANOVA followed by Tukey’s multiple comparisons test (b, dk). The exact P values are shown in the figures. NS not significant. Source data are provided as a Source Data file.
Fig. 6
Fig. 6. HDAC6 inhibition by TYA-018 restores dysregulated fibrosis and metabolic transcripts in heart tissue from HFpEF mice.
a Significantly altered gene sets from MSigDB canonical pathways. b Heatmap of differentially regulated genes associated with cardiac fibrosis as well as inflammatory and mitochondrial function in all groups (n = 8–11 mice per group). c Uniform manifold approximation and projection (UMAP) plot after single-nuclei RNA sequencing of left ventricular tissue. d UMAP plot of four cardiomyocytes (CM) subclusters. e UMAP plot of nine fibroblast (FB) subclusters. f Heatmap of the top 10 maker genes for each CM subclusters. g Heat map showing the expression of the top 5 maker genes for each FB subclusters. h Composition of the four CM subclusters within the four groups. i Gene ontology enrichment analysis of CM cluster 3. j Composition of the nine FB subclusters within the four groups. k Gene ontology enrichment analysis of FB cluster 6. ECM extracellular matrix; TCA tricarboxylic acid.
Fig. 7
Fig. 7. TYA-018 reduces cardiac fibroblast activation and improves the metabolic signature of iPSC-CMs.
a Schematic diagram of an in vitro model of cardiac fibroblast activation using TGF-β. b Representative immunocytochemistry (ICC) images of α-SMA (red) and 4′,6-diamidino-2-phenylindole (DAPI; blue) staining in cardiac fibroblasts. Scale bar, 200 μm. c Quantification of cardiac fibroblasts positive for α-SMA after treatment with TYA-018 (1 and 3 µM). d Schematic workflow of Seahorse oximetry analysis in human iPSC-CMs. Seahorse oximetry kinetics (e), and quantification of basal respiration (f), reserve respiratory capacity (measured by the oxygen consumption rate) (g) in iPSC-CMs after treatment with TYA-018 0.3 µM and TYA-018 3 µM versus DMSO control. h Quantification of average florescent TMRM signal (normalized to DMSO) in iPSC-CMs treated with TYA-018 (3 µM) versus DMSO control. Data are expressed as the mean ± SEM. Statistical analysis was performed using two-tailed unpaired Student t test (c, fh). The exact P values and replicates are shown in the figures. Source data are provided as a Source Data file.
Fig. 8
Fig. 8. TYA-018 regulates the acetylation of proteins associated with myofilaments, mitochondrial metabolic enzymes, and calcium regulation in HFpEF mice.
a Schematic overview illustrating acetylome workflow. b Pie chart shows STRING analysis of enriched proteins with altered acetylation in HFpEF mouse hearts after TYA-018 treatment. c Heatmap of altered lysine acetylation at sites of selected proteins after STRING analysis. Red represents relative increases in the lysine acetylation, and blue represents relative decreases in lysine acetylation. Proteins with their respective acetylation sites are listed on the left side of each row (n = 3 animals per group). d Representative western blot of tropomyosin (Tpm), troponin I (TnnI), and myosin heavy chain 6 (Myh6) after immunoprecipitation with anti-lysine acetylation antibody in heart samples. Immunoglobulin G (IgG) pulldown was used as a control.

References

    1. Omote, K., Verbrugge, F. H. & Borlaug, B. A. Heart failure with preserved ejection fraction: mechanisms and treatment strategies. Annu. Rev. Med.73, 321–337 (2022). - PMC - PubMed
    1. Heidenreich, P. A. et al. 2022 AHA/ACC/HFSA guideline for the management of heart failure: executive summary: a report of the American College of Cardiology/American Heart Association Joint Committee on Clinical Practice Guidelines. J. Am. Coll. Cardiol.79, 1757–1780 (2022). - PubMed
    1. Borlaug, B. A. Evaluation and management of heart failure with preserved ejection fraction. Nat. Rev. Cardiol.17, 559–573 (2020). - PubMed
    1. Kumar, A. A., Kelly, D. P. & Chirinos, J. A. Mitochondrial dysfunction in heart failure with preserved ejection fraction. Circulation139, 1435–1450 (2019). - PMC - PubMed
    1. Sweeney, M., Corden, B. & Cook, S. A. Targeting cardiac fibrosis in heart failure with preserved ejection fraction: mirage or miracle? EMBO Mol. Med.12, e10865 (2020). - PMC - PubMed