. 2024 Feb 26;14(1):4608.
doi: 10.1038/s41598-024-53614-y.

Altered hippocampal neurogenesis in a mouse model of autism revealed by genetic polymorphisms and by atypical development of newborn neurons

Affiliations

Altered hippocampal neurogenesis in a mouse model of autism revealed by genetic polymorphisms and by atypical development of newborn neurons

Isabel Barón-Mendoza et al. Sci Rep. .

Abstract

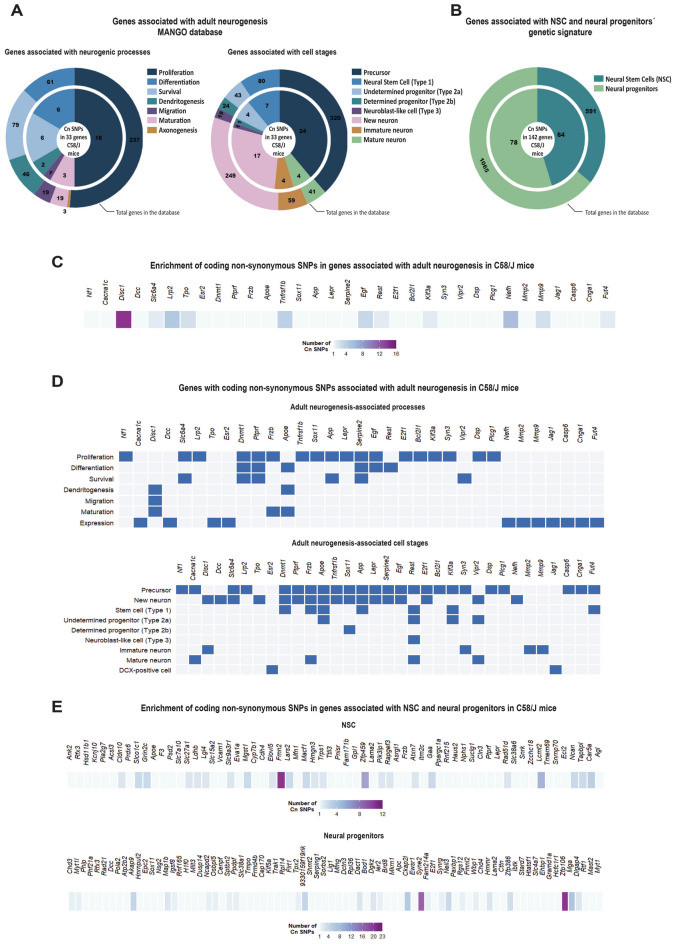
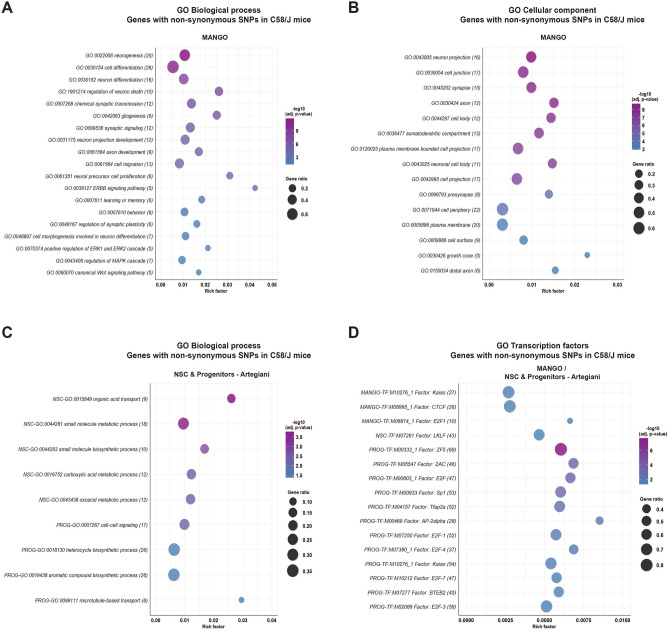
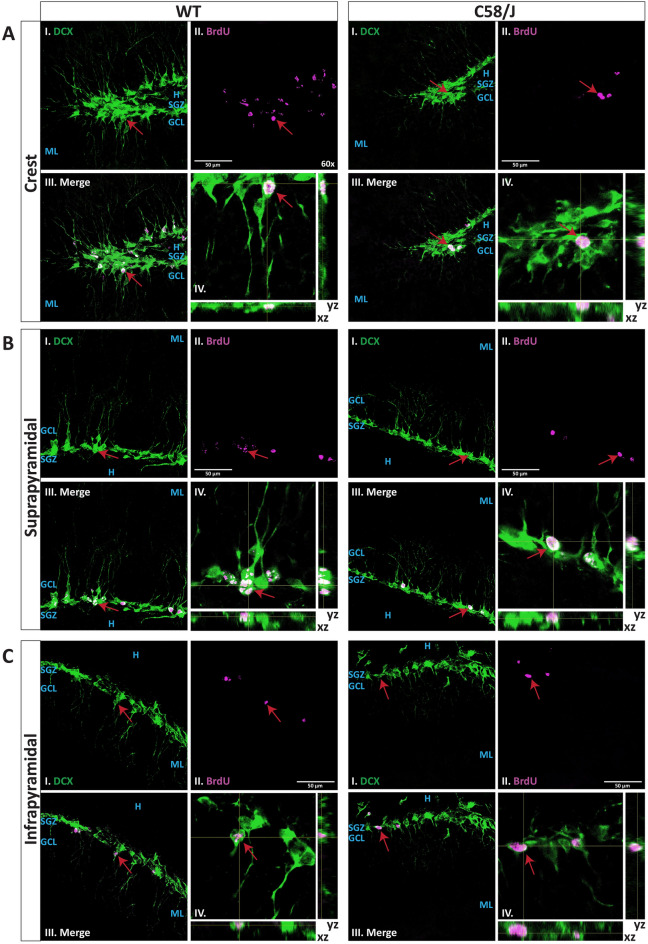
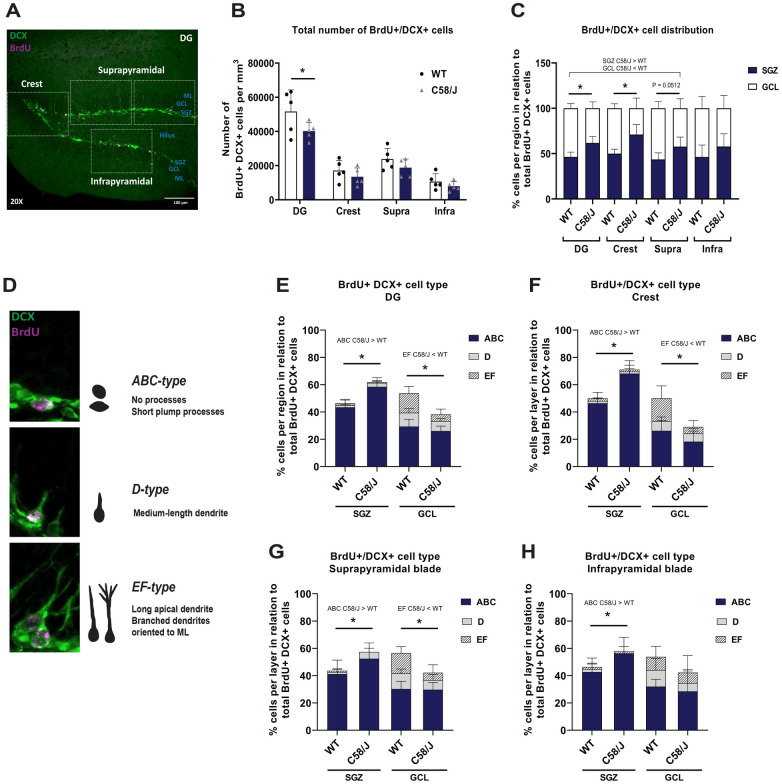
Individuals with autism spectrum disorder (ASD) often exhibit atypical hippocampal anatomy and connectivity throughout their lifespan, potentially linked to alterations in the neurogenic process within the hippocampus. In this study, we performed an in-silico analysis to identify single-nucleotide polymorphisms (SNPs) in genes relevant to adult neurogenesis in the C58/J model of idiopathic autism. We found coding non-synonymous (Cn) SNPs in 33 genes involved in the adult neurogenic process, as well as in 142 genes associated with the signature genetic profile of neural stem cells (NSC) and neural progenitors. Based on the potential alterations in adult neurogenesis predicted by the in-silico analysis, we evaluated the number and distribution of newborn neurons in the dentate gyrus (DG) of young adult C58/J mice. We found a reduced number of newborn cells in the whole DG, a higher proportion of early neuroblasts in the subgranular layer (SGZ), and a lower proportion of neuroblasts with morphological maturation signs in the granule cell layer (GCL) of the DG compared to C57BL/6J mice. The observed changes may be associated with a delay in the maturation trajectory of newborn neurons in the C58/J strain, linked to the Cn SNPs in genes involved in adult hippocampal neurogenesis.


Conflict of interest statement

The authors declare no competing interests.

Figures

Figure 1
Figure 1
Neurogenesis-associated genes with coding non-synonymous SNPs in the C58/J strain. In silico analysis of coding non-synonymous (Cn) single-nucleotide polymorphisms (SNPs) in genes relevant to adult neurogenesis in the mouse DG. (A) Among the 397 genes associated with processes (left) and cell stages (right) involved in adult neurogenesis, according to the MANGO database (data inside the large circle), 33 genes carried at least one Cn SNP in C58/J mice (data inside the small circle). (B) Among the genes characterizing the genetic profile of neural stem cells (NSC) (591 genes) and neural progenitors (1065 genes) in the mouse DG, as reported by Artegiani (2017) (data inside the large circle), 142 genes carried at least one Cn SNP in C58/J mice, with 64 genes corresponding to NSC and 78 genes to the neural progenitors (data inside the small circle). (C) The 33 genes reported by the MANGO database display from 1 to 16 Cn SNPs in C58/J mice in comparison with the control C57BL/6 J strain. (D) The genes with Cn SNPs in C58/J mice are expressed during specific neurogenic processes (upper panel: proliferation, differentiation, survival, dendritogenesis, migration, maturation) and throughout different cell stages (inferior panel: stem cells [Type 1], undetermined progenitors [Type 2a], determined progenitors [Type 2b], neuroblast-like cells [Type 3], immature neurons, mature neurons, DCX-positive cells), according to the MANGO database. (E) 64 and 78 genes corresponding to the NSC (upper panel) and neural progenitors’ (inferior panel) datasets, respectively, display from 1 to 23 Cn SNPs in C58/J mice.
Figure 2
Figure 2
Gene Ontology (GO) enrichment analysis for neurogenesis-associated genes with coding non-synonymous SNPs in the C58/J strain. Enriched GO terms resulting from the enrichment analysis of the 33 genes with Cn SNPs associated with adult neurogenesis in C58/J mice, according to the MANGO database, in the biological process (A) and cellular component (B) categories. (C) Enriched GO terms resulting from the analysis of the 64 and 78 genes with Cn SNPs associated with NSC and neural progenitors (PROG) in C58/J mice, according to the Artegiani database, in the biological process category. (D) The genes with Cn SNPs in C58/J mice from both databases (MANGO and Artegiani) were enriched in DNA-binding motifs for specific transcription factors (TFs). Adjusted p-values were obtained through g:SCS multiple testing correction method on g:Profiler. The number of genes found in each GO term is indicated in parentheses. Gene ratio: the number of requested genes found in the functional category divided by the number of genes from the background genome. Rich factor: the number of requested genes found in the functional category divided by the number of total genes comprised in the specific functional category.
Figure 3
Figure 3
Evaluation of BrdU + /DCX + newborn neurons in the DG of the C58/J and WT strains. The representative confocal images show immunofluorescence for BrdU (magenta) and DCX (green) in cells of the DG from WT mice (left panel) and C58/J mice (right panel). The panels correspond to the crest (A), suprapyramidal (B), and infrapyramidal (C) blades in both strains. Each panel shows I) DCX channel, II) BrdU channel, III) merged channels, and IV) orthogonal xz and yz views of the BrdU + /DCX + cells indicated by red arrows. The DG layers (SGZ, GCL, ML, and hilus) are indicated in blue legends. The images are maximal intensity projections from 60x magnification z-stacks. The orthogonal views are shown as enlarged insets from the 60x magnification. Scale bars: 50 µm.
Figure 4
Figure 4
Analysis of the number and morphology of BrdU + /DCX + cells in the C58/J and WT strains according to their distribution within DG regions and layers. (A) A representation of the analyzed regions of interest (rectangles) in the crest, suprapyramidal and infrapyramidal blades in the dorsal DG from C57BL/6 J WT mice is shown (20x magnification. Scale bar: 100 µm). (B) Estimated total number of BrdU + /DCX + cells per mm3 in the whole DG, the crest, suprapyramidal (supra), and infrapyramidal (infra) blades from both strains. Two-way ANOVA followed by Sidak’s correction: DG: F(1,32) = 7.620, *p = 0.0374. (C) Percentage of BrdU + /DCX + cells distributed within the subgranular zone (SGZ) and the granule cell layer (GCL) of the whole DG, the crest, suprapyramidal (supra), and infrapyramidal (infra) blades from both strains. Two-way ANOVA followed by Sidak’s correction: DG-SGZ: F(1, 16) = 8.609, *p = 0.0025; DG-GCL: *p = 0.0025; Crest-SGZ: F(1, 16) = 29.43, *p = 0.0028; Crest-GCL: *p = 0.0028; Supra-SGZ: F(1,16) = 0.08987, p = 0.0512; Supra-GCL: p = 0.0512. (D) Representative examples of BrdU + /DCX + cells categorized as ABC-type, D-type, and EF-type. Percentage of BrdU + /DCX + cells classified according to their morphology within the subgranular zone (SGZ) and the granule cell layer (GCL) of the whole DG (E), the crest (F), suprapyramidal (G), and infrapyramidal (H) blades from both strains. Two-way ANOVA followed by Sidak’s correction: (E) SGZ-ABC: F(1, 24) = 13.35, *p < 0.0001; GCL-EF: F(1, 24) = 12.28, *p = 0.0039; (F) SGZ-ABC: F(1, 24) = 15.32, *p < 0.0001; GCL-EF: F(1, 24) = 9.102, *p = 0.0185; (G) SGZ-ABC: F(1, 24) = 3.721, *p = 0.0351; GCL-EF: F(1, 24) = 7.023, *p = 0.0171; (H) SGZ-ABC: F(1, 24) = 2.385, *p = 0.0125. All results are expressed as mean ± SD. n = 5 animals per group.

Similar articles

Cited by

References

    1. American Psychiatric Association . Diagnostic And Statistical Manual Of Mental Disorders, Fifth Edition, Text Revision (DSM-5-TR) American Psychiatric Association Publishing; 2022.
    1. World Health Organization. Autism. Fact sheets: Autismhttps://www.who.int/news-room/fact-sheets/detail/autism-spectrum-disorders (2023).
    1. Willsey HR, Willsey AJ, Wang B, State MW. Genomics, convergent neuroscience and progress in understanding autism spectrum disorder. Nat. Rev. Neurosci. 2022;23:323–341. doi: 10.1038/s41583-022-00576-7. - DOI - PMC - PubMed
    1. Courchesne E, et al. The ASD Living Biology: From cell proliferation to clinical phenotype. Mol. Psychiatry. 2019;24:88–107. doi: 10.1038/s41380-018-0056-y. - DOI - PMC - PubMed
    1. Stoner R, et al. Patches of disorganization in the neocortex of children with autism. N. Engl. J. Med. 2014;370:1209–1219. doi: 10.1056/NEJMoa1307491. - DOI - PMC - PubMed