. 2024 Feb 26;15(1):1752.
doi: 10.1038/s41467-024-46076-3.

Intestinal stroma guides monocyte differentiation to macrophages through GM-CSF

Affiliations

Intestinal stroma guides monocyte differentiation to macrophages through GM-CSF

Egle Kvedaraite et al. Nat Commun. .

Abstract

Stromal cells support epithelial cell and immune cell homeostasis and play an important role in inflammatory bowel disease (IBD) pathogenesis. Here, we quantify the stromal response to inflammation in pediatric IBD and reveal subset-specific inflammatory responses across colon segments and intestinal layers. Using data from a murine dynamic gut injury model and human ex vivo transcriptomic, protein and spatial analyses, we report that PDGFRA+CD142-/low fibroblasts and monocytes/macrophages co-localize in the intestine. In primary human fibroblast-monocyte co-cultures, intestinal PDGFRA+CD142-/low fibroblasts foster monocyte transition to CCR2+CD206+ macrophages through granulocyte-macrophage colony-stimulating factor (GM-CSF). Monocyte-derived CCR2+CD206+ cells from co-cultures have a phenotype similar to intestinal CCR2+CD206+ macrophages from newly diagnosed pediatric IBD patients, with high levels of PD-L1 and low levels of GM-CSF receptor. The study describes subset-specific changes in stromal responses to inflammation and suggests that the intestinal stroma guides intestinal macrophage differentiation.


Conflict of interest statement

The authors declare no competing interests.

Figures

Fig. 1
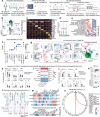
Fig. 1. Intestinal stroma is activated already at first diagnostic colonoscopy in pediatric IBD.
a Overview of overall study design. b Cleared mucosal biopsy from the healthy colon of a pediatric non-IBD patient (diagnosed with a colonic polyp), scale indicates 1 mm, higher magnification panel indicates 0.25 mm. c Levels of PDPN measured as mean fluorescence intensity (MFI) in colon biopsies from pediatric non-IBD patients (n = 3) and pediatric IBD patients (n = 4) using immunofluorescence microscopy. d Representative flow cytometry scheme for identification of PDPN+ and PDPN stroma in colon biopsies (newly diagnosed pediatric IBD, CD). e Correlation between PDPN levels in PDPN+ stroma and neutrophil counts in colon biopsies from children undergoing first diagnostic colonoscopy (see also Supplementary Fig. 1). f Levels of PDPN in PDPN+ stroma from non-inflamed and inflamed matched mucosal colon tissue in 14 newly diagnosed pediatric IBD patients; for inflamed/non-inflamed definition see also Supplementary Fig. 1. Mean with SD in (c), unpaired t-test (two-tailed p-value) for unmatched data (c) and Wilcoxon test for matched data (two-tailed p-value) (f) were used, and Spearman test (two-tailed p-value) was used to assess correlation (e).
Fig. 2
Fig. 2. Composition of intestinal stroma based on sc-RNAseq validated across colon segments and intestinal layers using 25-color flow cytometry.
a scRNA-seq design and validation analysis. b Clustering of scRNA-seq data showing clusters 0–10 in UMAP space. c Heatmap of top 50 differentially expressed genes among clusters 0–10. d Violin plots showing differential PDPN expression in clusters 0–10 from non-inflamed and inflamed samples. e Heatmap illustrating pathway significance, calculated as −log10(p-value) using right-tailed Fisher’s Exact test, from IPA analysis on genes upregulated in inflamed compared to non-inflamed samples, assessed in each cluster independently; #Hepatic Fibrosis/Hepatic Stellate Cell Activation, ##Tumor Microenvironment Pathway. f Dot plot of gene expression, selected for validation on protein level, non-inflamed; for inflamed, see Supplementary Fig. 3a. g Gating strategy of stoma populations using FACS; gated populations shown in UMAP space see Supplementary Fig. 3b for more details. h Percentage of total stromal cells in 81–97 biologically independent non-inflamed and inflamed biopsies from pediatric patients undergoing first diagnostic colonoscopy. i Heatmap illustrating percentage of total stromal cells across the segments of the colon in matched samples from treatment naïve pediatric patients with no inflammation in the colon (Non-inf) or total colitis (Inf). j Percentage of total stromal cells across dissected intestinal layers from three adult IBD patients undergoing gut resection. k Representative flow cytometry plot of Fibro_4 subset across intestinal layers. l Levels of stromal activation markers across stromal subsets in non-inflamed and inflamed colon biopsies from children undergoing first diagnostic colonoscopy. m MFI levels of stroma activation markers in non-inflamed and inflamed colon biopsies from children undergoing first diagnostic colonoscopy, comparing levels across non-immune (epithelial, stromal) and immune cells (upper panels); and PDPN levels across immune cells only (lower panel), for gating strategy see Supplementary Fig. 3e. n Significant (p < 0.05) Spearman correlations between PDPN levels (MFI) in Fibro_0_2 and immune cell frequencies (two-tailed p-value). Mean with SE in (h) and (j); Mann–Whitney test was used to compare differences between two groups (two-tailed p value) (h, l), significance level for (l): ns > 0.05, *p < 0.05, **p < 0.01, ***p < 0.001 and ****p < 0.0001, for p values see Supplementary Fig. 3c.
Fig. 3
Fig. 3. Ultra-high content imaging reveals the spatial composition of intestinal stroma.
a Schematic overview of experimental design. b Gating strategy for identification of stroma, immune, and epithelial populations using ultra-high content MACSimaTM Imaging Platform; gated populations are backgated to the image; scale bars indicate 100 µm in images on the left and 50 µm in images presented in higher magnification in areas (ad); color codes for the lines defining gated cellular units are shown in upper left corner and color codes for marker signal are shown in lower left corner. c Gated populations projected in UMAP space. d Absolute numbers (cells/mm2) of cell subsets quantified across intestinal layers in 14 biologically independent non-inflamed and inflamed samples from adult gut resections; lymphoid tissue was excluded from the analyses. e Composition of stromal cells in non-inflamed and inflamed samples across intestinal layers. f Quantification of distance from stromal subsets to different microanatomical landmarks in 14 (epithelium) to 42 (endothelium, lymphatic endothelium) biologically independent samples; only mucosa was included in the calculation of the distance to epithelium; scale bar indicates 100 µm. Mean with SE in (d) and (f); Mann–Whitney test was used to compare differences between non-inflamed and inflamed samples (two-tailed p value) (d), and Kruskal–Wallis with Dunn’s multiple comparisons test was used to comparing differences among stromal populations (f), ns not significant, nd not detected.
Fig. 4
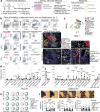
Fig. 4. Spatial stromal-immune relationship in dynamic modeling of gut healing reveals co-localization between fibroblasts and monocytes/macrophages.
a Schematic overview of cross-data set validation. b Stromal clusters aligned to scRNA-seq data from Smillie et al. using Label Transfer (see Online Methods). c Cell annotations in scRNA-seq data from Smillie et al. d Significant spatial correlations among cell subsets deconvoluted in spatial mouse colon data during the gut healing phase (day 14) from Parigi et al. e Inflammatory fibroblasts, macrophages, and inflammatory monocytes aligned to spatial transcriptomics data at steady state (day 0) or during the gut healing phase (day 14). f Volcano plot of human gut cellular composition deconvoluted from mouse steady state vs. post-injury phase (day 0 vs. day 14) from Parigi et al. g Monocyte/macrophage differentiation/recruitment score (CSF1, CSF2, IL33, IL34, IL6, CCL2, CCL7, CCL8, CCL13, IL3) calculated in stromal cell clusters, shown in UMAP. h Statistical differences between clusters in the enrichment of Monocyte/macrophage differentiation/recruitment score. i Representative image from six independent experiments using ultra-high content imaging showing colors for staining in the lower left corner and segmented monocytes, macrophages, and Fibro_0_2 in the upper left corner; scale bar indicates 50 µm. j Correlations of absolute cell numbers from ultra-high content imaging experiments on human gut resections. Spearman r was calculated for correlations (two-tailed p value) (j), significance level: ****p < 0.0000000005, ***p < 0.000005, **p < 0.00005, *p < 0.05; Kruskal–Wallis test was used to compare differences between the clusters (h): ***** indicates adjusted p value < 0.00001 for comparison to all other clusters, and **** indicates adjusted p value < 0.00001 for comparison to all other clusters, except cluster 0.
Fig. 5
Fig. 5. PDGFRA+CD142low/ fibroblasts guide monocyte to macrophage transition through GM-CSF.
a Overview of the co-culture, for gating see Supplementary Fig. 7. b Phenograph clusters of HLA-DR+lin cells in UMAP space across the three conditions. c Percentage of total HLA-DR+lin cells per cluster across the three conditions. d Cell frequencies across conditions in the three largest clusters of monocytes only condition (upper panels) or monocytes cultured with fibroblast conditions (lower panels). e Heatmap of marker expression across clusters. f Expression of selected markers across conditions in total CD11b+CD14+ monocyte/macrophage pool; same data ± TNF in Supplementary Fig. 8e. g Distribution and annotation of Phenograph clusters ± TNF. h Cell frequencies across conditions in selected clusters, +TNF. i Soluble factors in supernatants from sorted fibroblasts stimulated with OSM, TNF, and LPS for 24 h. j CD206 levels on monocytes/macrophages ± blocking antibodies against IL-34, IL-33, GM-CSF, or M-CSF. k Concatenated HLA-DR+lin cells in UMAP space; transwell (left) and contact (right) condition, ± anti-GM-CSF. l Cell frequencies across conditions of monocyte cluster #1 and macrophage cluster #10, ±anti-GM-CSF. m Double staining of intestinal PDGFRAB+ fibroblasts and GM-CSF in inflamed submucosa of three representative patients with IBD, scale bar indicates 20 µm (see Supplementary Fig. 9). n Concatenated total intestinal CD11b+CD14+ monocytes/macrophages from 96 mucosal ex vivo biopsy samples in UMAP space; expression of CD206 and FOLR2, and gating strategy shown. o Quantification of GM-CSF receptor (CD116) and PDL1 in intestinal CD206 monocytes/macrophages (pink), CD206+ macrophages (blue), and FOLR2+ macrophages (green) gated as shown in (n). p Heatmap of marker expression across intestinal monocyte/macrophage subsets in non-inflamed or inflamed samples. Data from three (i), four (j), five (b, d, f, hl), and 96 (o) biologically independent samples were examined. Mean with SD in (i) and (j), mean with SE in (o); differences among three groups were assessed using one-way ANOVA with Holm–Šídák’s multiple comparisons tests (d, f, h, i, j, l) and Kruskal-Wallis with Dunn’s multiple comparisons tests (o, p); significance in (p): *p < 0.05, **p < 0.01, ***p < 0.001 and ****p < 0.0001; for p values see Supplementary Fig. 8m.

References

    1. Davidson S, et al. Fibroblasts as immune regulators in infection, inflammation and cancer. Nat. Rev. Immunol. 2021;21:704–717. - PubMed
    1. Koliaraki V, Prados A, Armaka M, Kollias G. The mesenchymal context in inflammation, immunity and cancer. Nat. Immunol. 2020;21:974–982. - PubMed
    1. Greicius G, et al. PDGFRα+ pericryptal stromal cells are the critical source of Wnts and RSPO3 for murine intestinal stem cells in vivo. Proc. Natl Acad. Sci. USA. 2018;115:E3173–E3181. - PMC - PubMed
    1. Owens BMJ, et al. CD90(+) stromal cells are non-professional innate immune effectors of the human colonic mucosa. Front. Immunol. 2013;4:307. - PMC - PubMed
    1. McCarthy N, et al. Distinct mesenchymal cell populations generate the essential intestinal BMP signaling gradient. Cell Stem Cell. 2020;26:391–402.e5. - PMC - PubMed

Substances